A Comprehensive RNA-seq Protocol for Endometrial Biopsy: From Sample Collection to Clinical Translation
This article provides a detailed framework for implementing RNA sequencing (RNA-seq) in endometrial biopsy analysis, addressing the unique challenges of this dynamic tissue.
A Comprehensive RNA-seq Protocol for Endometrial Biopsy: From Sample Collection to Clinical Translation
Abstract
This article provides a detailed framework for implementing RNA sequencing (RNA-seq) in endometrial biopsy analysis, addressing the unique challenges of this dynamic tissue. It covers foundational principles of endometrial biology and transcriptome dynamics, a step-by-step methodological protocol from biopsy collection to data analysis, troubleshooting for common pitfalls, and validation strategies for clinical applications. Aimed at researchers and drug development professionals, this guide synthesizes current best practices to enable robust and reproducible endometrial transcriptomic studies, with direct relevance to understanding endometrial receptivity, endometriosis, adenomyosis, and other gynecological conditions.
Understanding the Endometrial Transcriptome: Biological Complexity and Research Applications
The Dynamic Nature of the Endometrial Cycle and Transcriptomic Variability
The endometrium, the inner lining of the uterus, is a remarkably dynamic tissue that undergoes extensive cyclic remodeling throughout the menstrual cycle to support embryo implantation and pregnancy. This plasticity is governed by complex molecular changes, and transcriptomic analyses have become indispensable for elucidating the underlying mechanisms of both physiological and pathological states. Disruptions in the precise transcriptional programs of the endometrial cycle are implicated in a range of clinical challenges, from repeated implantation failure (RIF) to endometrial cancer (EC) [1] [2]. The advent of high-resolution genomic technologies, including RNA sequencing (RNA-seq) and spatial transcriptomics (ST), is revolutionizing our understanding of endometrial biology by providing unprecedented insights into cellular heterogeneity, gene expression dynamics, and spatial organization [2]. This Application Note details standardized protocols for RNA-seq analysis of endometrial samples, framed within a broader thesis on endometrial biopsy research, to support researchers and drug development professionals in advancing diagnostic and therapeutic innovation.
The following tables synthesize key quantitative findings from recent transcriptomic studies of the endometrium, highlighting sample viability, sequencing quality, and analytical outputs.
Table 1: Sample and Sequencing Quality Metrics from Endometrial Transcriptomic Studies
| Study Parameter | Tampon-Based Menstrual Effluence Collection [3] | Endometrial Tissue Spatial Transcriptomics [2] |
|---|---|---|
| Sample Type | At-home collected tampon samples | Endometrial biopsies (fundal/upper uterus) |
| Sample Preservation | Ambient temperature for up to 14 days in preservation buffer | Fresh frozen in isopentane, stored at -80°C |
| Total High-Quality Spots/Cells | 1,067 tampon samples from 328 participants | 10,131 spots |
| RNA Quality Threshold | Sufficient for sequencing in >97% of samples | RNA Integrity Number (RIN) > 7 |
| Median Genes per Spot | Information Missing | 3,156 |
| Sequencing Saturation | Information Missing | > 90% |
| Key Quality Metrics | RNA stability for up to 14 days without refrigeration; 100% SNV concordance with matched blood. | Q30 values for barcode, UMI, and RNA read all exceeded 90%; >90% reads mapped to genome. |
Table 2: Key Analytical Findings from Endometrial Transcriptomic Profiling
| Analytical Focus | Key Findings | Clinical/Research Implications |
|---|---|---|
| Genetic Concordance | 100% concordance among overlapping single nucleotide variants (SNVs) between menstrual fluid and matched venous blood [3]. | Validates menstrual effluence as a clinically equivalent, non-invasive source for genetic screening. |
| Transcriptomic Variation | Cycle-dependent variation in key reproductive and immune markers identified via RNA-seq [3]. | Enables molecular phenotyping for reproductive health assessment and biomarker discovery. |
| Microbial Composition | Metatranscriptomic profiling identified shifts in microbial communities consistent with known reproductive tract dysbiosis [3]. | Offers a pathway for infectious disease and dysbiosis monitoring. |
| Spatial Cellular Niches | Seven distinct cellular niches (Niche 1–7) with specific characteristics identified in endometrial tissue via ST [2]. | Provides a spatial atlas for investigating local cellular environments and communication in RIF and other conditions. |
| Cellular Deconvolution | Uncilated Epithelia were the dominant cellular components identified through integration of ST and public scRNA-seq data [2]. | Clarifies major cell types contributing to bulk tissue transcriptomic signals and niche identity. |
Experimental Protocols
Protocol 1: At-Home Tampon-Based Collection of Menstrual Effluence for RNA-Seq
This protocol, adapted from a validated system, enables standardized, remote specimen acquisition for clinical-grade RNA-seq analyses [3].
Materials and Equipment
- TOTM-brand organic, low-absorbency tampons with cardboard applicators.
- Collection jar containing 20 mL of nucleic acid preservation buffer (e.g., from Norgen Biotek).
- Nitrile glove.
- Pre-labeled, leak-proof return bag and shipping materials.
Step-by-Step Procedure
- Collection: During menstruation (cycle days 1–3 are recommended), wear the provided tampon for approximately 4 hours.
- Sample Retrieval: Using the nitrile glove, remove the tampon and immediately place it into the collection jar.
- Preservation Activation: Seal the jar tightly. Upon sealing, ensure the cap mechanism pulls the tampon string inside and punctures the foil seal to release the preservation buffer, supersaturating the tampon.
- Metadata Recording: Complete the provided intake form, capturing cycle day, flow type, and clinical history.
- Shipment: Place the sealed jar into the provided bag and return to the central laboratory via standard mail at ambient temperature.
- Laboratory Processing: Upon receipt, process samples through extrusion and centrifugation. Aliquot and store the resulting cell pellet or nucleic acids at -80°C.
Protocol 2: RNA Sequencing and Analysis from Menstrual Effluence
This protocol covers the downstream RNA-seq workflow from preserved tampon samples [3].
Materials and Equipment
- DNase treatment reagents.
- RNA XP clean beads or equivalent for clean-up.
- Qubit 4.0 fluorometer or equivalent for RNA quantification.
- Zymo-Seq RiboFree Total RNA Library Kit or equivalent.
- Illumina NextSeq2000 or equivalent sequencing platform.
Step-by-Step Procedure
- Nucleic Acid Extraction: Extract total RNA using a column-based (e.g., Norgen) or bead-based (e.g., MagMax mirVana Total RNA Isolation) method, including a DNase treatment step to remove genomic DNA.
- RNA Quality Assessment: Quantify RNA concentration using a fluorometer and assess integrity.
- Library Preparation: Prepare RNA sequencing libraries using the Zymo-Seq RiboFree Total RNA Library Kit or a similar kit to generate strand-specific libraries.
- Sequencing: Sequence the libraries on an Illumina NextSeq2000 platform to generate a minimum of 25 million paired-end 150 bp reads per sample.
- Bioinformatic Analysis:
- Quality Control & Trimming: Use FastQC to assess raw read quality and trim adapters.
- Alignment: Align cleaned reads to the human reference genome (hg38) using the STAR aligner.
- Gene Counting: Generate gene-level count matrices using FeatureCounts.
- Transcript Integrity: Account for RNA degradation effects using a tool like DegNorm.
- Differential Expression: Perform analysis using tools such as those available in XLSTAT or R/Bioconductor packages (e.g., DESeq2).
Protocol 3: Spatial Transcriptomics of Endometrial Biopsies
This protocol describes the workflow for spatial transcriptomic profiling of endometrial tissue biopsies using the x Visium platform [2].
Materials and Equipment
- Pipelle endometrial biopsy catheter or equivalent.
- Liquid nitrogen and pre-chilled isopentane.
- 10x Visium Spatial Tissue Optimization Slide and 10x Visium Spatial Gene Expression Slide.
- Space Ranger analysis pipeline (version 2.0.0).
- Seurat R toolkit (version 4.3.0 or later).
Step-by-Step Procedure
- Sample Collection: Obtain endometrial biopsies from the fundal/upper part of the uterus during the mid-luteal phase (e.g., LH +7) using a Pipelle catheter.
- Tissue Freezing: Immediately embed the tissue in Optimal Cutting Temperature (OCT) compound, submerge in isopentane pre-chilled with liquid nitrogen, and store at -80°C.
- Cryosectioning: Section the frozen tissue into slices at a specified thickness (e.g., 10 µm) and place them onto the Visium slides.
- Staining and Imaging: Stain the tissue sections with Hematoxylin and Eosin (H&E) and image them using a brightfield microscope.
- Permeabilization: Permeabilize the tissue to release mRNA, which is captured by spatially barcoded spots on the slide.
- Library Construction and Sequencing: Perform reverse transcription, cDNA amplification, and library construction per the 10x Visium protocol. Sequence libraries on an Illumina NovaSeq 6000 platform.
- Data Processing and Integration:
- Alignment and Clustering: Use the Space Ranger pipeline to align sequences to the reference genome (GRCh38), detect tissue spots, and perform clustering. Subsequent analysis can be performed in Seurat.
- Cellular Deconvolution: Integrate spatial data with a matched single-cell RNA-seq (scRNA-seq) dataset using a tool like CARD (v1.1) to infer cell type composition within each spot.
The Scientist's Toolkit: Research Reagent Solutions
Table 3: Essential Research Reagents and Kits for Endometrial Transcriptomics
| Item | Function/Application in Protocol |
|---|---|
| Nucleic Acid Preservation Buffer (e.g., Norgen Biotek) | Preserves RNA integrity in collected samples at ambient temperature during shipment, critical for reliable sequencing results [3]. |
| Total RNA Extraction Kit (e.g., MagMax mirVana) | Isolates high-quality, DNA-free total RNA from complex biological samples like menstrual effluence or tissue for downstream sequencing [3]. |
| RiboFree Total RNA Library Kit (e.g., Zymo-Seq) | Prepares strand-specific RNA-seq libraries from total RNA, effectively removing ribosomal RNA to enrich for mRNA and non-coding RNA [3]. |
| 10x Visium Spatial Kit | Enables spatial transcriptomic profiling by capturing mRNA from tissue sections on spatially barcoded spots, allowing for mapping of gene expression to tissue morphology [2]. |
| Single-Cell RNA-seq Kit (e.g., 10x Genomics) | Facilitates the generation of single-cell transcriptome maps from digested endometrial tissues, which can be integrated with spatial data for deconvolution [2]. |
Signaling Pathways and Experimental Workflows
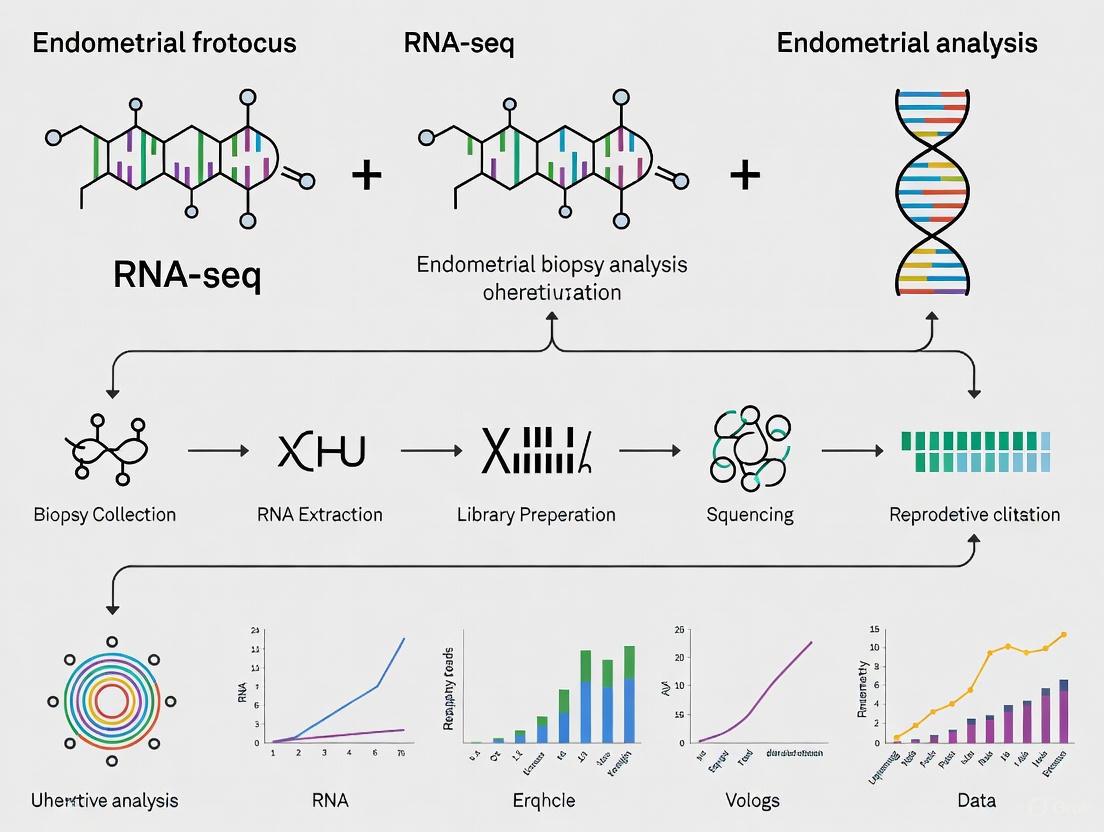
Diagram 1: Comprehensive RNA-seq Workflow for Endometrial Analysis. This diagram outlines the core steps for transcriptomic profiling of endometrial samples, accommodating both bulk RNA-seq from menstrual effluence and spatial transcriptomics from tissue biopsies.
Diagram 2: Transcriptional Pathways in Endometrial Cycle and Pathogenesis. This diagram illustrates key transcriptional pathways activated during the endometrial cycle and their potential dysregulation in disease states, as revealed by transcriptomic studies.
Application Notes: RNA-Seq in Endometrial Research
The application of RNA sequencing (RNA-Seq) in endometrial research has revolutionized our understanding of both reproductive health and disease pathogenesis. By providing a comprehensive, high-resolution view of the transcriptome, this technology enables researchers to move beyond histological dating to a molecular-based classification of endometrial status. This is particularly critical in areas such as the assessment of endometrial receptivity and the molecular subtyping of endometrial cancer (EC), where precise diagnostic and prognostic tools are essential for clinical decision-making.
Assessing Endometrial Receptivity
A primary application of endometrial RNA-Seq is the identification of the window of implantation (WOI) in the context of assisted reproductive technologies (ART). During the mid-secretory phase, the endometrium undergoes dynamic molecular changes to become receptive to embryo implantation. Displacement of the WOI is a major cause of recurrent implantation failure (RIF), affecting a significant proportion of in vitro fertilization (IVF) patients [4].
Traditional methods for assessing receptivity, such as histological evaluation, lack the objectivity and reproducibility needed for precise WOI identification [4]. RNA-Seq overcomes these limitations by quantifying the expression of hundreds to thousands of genes simultaneously. For instance, a novel endometrial receptivity test (ERT) based on RNA-Seq utilizes a machine learning algorithm and a panel of 175 predictive genes to diagnose the WOI status objectively [4]. This allows for personalized embryo transfer (pET), where the transfer is timed according to the patient's unique receptivity window. Clinical studies are underway to validate whether pET guided by ERT can significantly improve live birth rates in patients with RIF [4].
Furthermore, research has explored non-invasive alternatives to endometrial biopsies by analyzing the transcriptomic profile of extracellular vesicles isolated from uterine fluid (UF-EVs). A recent study analyzing UF-EVs from 82 women identified 966 genes that were differentially expressed between women who achieved pregnancy and those who did not after a single euploid blastocyst transfer [5]. Systems biology approaches, such as Weighted Gene Co-expression Network Analysis (WGCNA), clustered these genes into functional modules related to key biological processes for implantation. A Bayesian model integrating these gene modules with clinical variables achieved a high predictive accuracy for pregnancy outcome, highlighting the potential of RNA-Seq data from non-invasive sources to guide clinical practice [5].
Unveiling Endometrial Cancer Pathogenesis
In the realm of oncology, RNA-Seq has been instrumental in the molecular characterization of endometrial cancer, directly influencing diagnosis, prognosis, and treatment. The 2023 update to the FIGO staging system for EC underscores the critical importance of integrating molecular classification with traditional clinicopathological factors for accurate risk stratification [1].
The foundation for this molecular classification was laid by The Cancer Genome Atlas (TCGA), which categorized EC into four distinct molecular subgroups: POLE ultramutated, microsatellite unstable (MSI), copy-number low, and copy-number high. This classification provides vital prognostic information that guides adjuvant therapy decisions [1]. In clinical practice, the identification of mismatch repair deficient (dMMR) tumors is particularly crucial. For patients with advanced or recurrent dMMR EC, first-line treatment now standardly involves chemo-immunotherapy followed by maintenance immunotherapy, a regimen that has significantly improved outcomes [1]. RNA-Seq and related genomic techniques are essential for identifying these molecular subtypes, enabling oncologists to offer more personalized and effective treatments.
Experimental Protocols
Protocol 1: RNA-Seq for Endometrial Receptivity Assessment from UF-EVs
This protocol details the process for using RNA-Seq to analyze extracellular vesicles from uterine fluid for non-invasive endometrial receptivity assessment [5].
I. Sample Collection and Processing
- Uterine Fluid Aspiration: Perform uterine fluid aspiration during the mid-secretory phase (LH+7 to LH+9) or on day P+5 in a hormone replacement cycle. Use a specialized aspiration catheter to minimize discomfort and tissue contamination.
- UF-EVs Isolation: Centrifuge the aspirated uterine fluid at 2,000 × g for 10 minutes at 4°C to remove cells and debris. Transfer the supernatant to a new tube and use ultracentrifugation (110,000 × g for 70 minutes) or a commercially available extracellular vesicle isolation kit to pellet the UF-EVs.
- RNA Extraction: Resuspend the UF-EVs pellet in TRIzol LS reagent. Proceed with total RNA extraction according to the manufacturer's instructions, including a DNase digestion step to remove genomic DNA contamination. Quantify RNA using a fluorometric assay and assess integrity with an Agilent Bioanalyzer (RIN > 7 recommended).
II. Library Preparation and Sequencing
- RNA Library Construction: Use a strand-specific total RNA library preparation kit. Select for polyadenylated RNA or use ribosomal RNA depletion to enrich for mRNA transcripts. Fragment the RNA, synthesize cDNA, and ligate with platform-specific adapters.
- High-Throughput Sequencing: Pool the resulting libraries and perform sequencing on an Illumina platform (e.g., NovaSeq 6000) to generate a minimum of 30 million 150bp paired-end reads per sample.
III. Bioinformatic and Statistical Analysis
- Primary Analysis: Quality control of raw sequencing reads using FastQC. Trim adapters and low-quality bases with Trimmomatic. Align reads to the human reference genome (e.g., GRCh38) using a splice-aware aligner like STAR.
- Secondary Analysis: Generate a counts matrix using featureCounts. Perform differential gene expression analysis in R using packages like DESeq2 or edgeR. Normalize read counts and model the data to identify genes significantly differentially expressed between experimental groups (e.g., pregnant vs. non-pregnant).
- Advanced Analysis:
- Gene Set Enrichment Analysis (GSEA): Use pre-ranked GSEA to identify Biological Process and Molecular Function GO terms that are coordinately up- or down-regulated [5].
- Network Analysis: Apply Weighted Gene Co-expression Network Analysis (WGCNA) to group differentially expressed genes into modules of highly correlated genes. Correlate module eigengenes with clinical traits of interest [5].
- Predictive Modeling: Integrate key gene expression modules with relevant clinical variables (e.g., vesicle size, previous miscarriages) using a Bayesian logistic regression model to build a predictor for pregnancy outcome [5].
Protocol 2: RNA-Seq for Molecular Classification of Endometrial Cancer
This protocol outlines the steps for utilizing RNA-Seq in the molecular subtyping of endometrial cancer, aligned with clinical guidelines [1].
I. Tumor Tissue Acquisition and Nucleic Acid Extraction
- Endometrial Sampling: Obtain tumor tissue via endometrial biopsy or dilatation and curettage. For surgical specimens, sample the tumor from the hysterectomy specimen, ensuring a high tumor cell content (>80% if possible).
- DNA/RNA Co-Extraction: Use a commercial kit designed for the simultaneous extraction of genomic DNA and total RNA from the same tissue section. This ensures matched samples for integrated molecular analysis.
- Quality Control: Assess DNA integrity by gel electrophoresis or genomic DNA tape. Assess RNA integrity as described in Protocol 1.
II. Sequencing and Molecular Classification
- RNA Sequencing: Prepare RNA libraries as in Protocol 1. Sequence to a depth of 50-100 million paired-end reads.
- Bioinformatic Classification: Process RNA-Seq data through a standardized computational pipeline (e.g., the TCGA molecular classifier). The analysis should determine:
- POLE Mutation Status: Identify pathogenic mutations in the POLE exonuclease domain from the matched DNA sequencing data.
- Microsatellite Instability (MSI) Status: Evaluate MSI from RNA-Seq data using specialized tools like MSIsensor or by assessing the mutation burden from DNA data.
- Transcriptional Subtype: Assign a copy-number subtype (copy-number high vs. low) based on the expression of specific genes and inferred copy-number alterations.
III. Clinical Reporting and Integration
- Generate a Comprehensive Report: The final report should integrate the molecular classification (POLEmut, dMMR/MSI, copy-number high, copy-number low) with histopathological findings.
- Guide Clinical Decision-Making: Use the report to inform FIGO 2023 staging and guide adjuvant therapy recommendations, including the suitability of immunotherapy for dMMR/MSI tumors [1].
Data Presentation
Table 1: Key Quantitative Findings from an RNA-Seq Study of UF-EVs and Pregnancy Outcome [5]
| Analysis Category | Metric | Value / Finding | Description |
|---|---|---|---|
| Study Cohort | Total Patients | 82 | Women undergoing single euploid blastocyst transfer |
| Pregnant | 37 | Achieved clinical pregnancy | |
| Not Pregnant | 45 | Did not achieve pregnancy | |
| Differential Expression | Genes Analyzed | 14,282 | Counts per million (CPM) > 1 in at least 37 samples |
| Nominally Significant (p < 0.05) | 966 | Differentially expressed genes | |
| SEQC Cut-off (p < 0.01, |log2FC|>1) | 262 | 236 over-expressed in pregnant group | |
| 26 down-regulated in pregnant group | |||
| Statistically Significant (padj < 0.05) | 4 | RPL10P9, LINC00621, MTND6P4, LINC00205 | |
| Functional Enrichment (GSEA) | Top Biological Processes | Adaptive immune response (NES=1.71) | Enriched in the pregnant group |
| Ion homeostasis (NES=1.53) | Enriched in the pregnant group | ||
| Inorganic cation transmembrane transport (NES=1.45) | Enriched in the pregnant group | ||
| Predictive Modeling | Model Performance (Accuracy/F1) | 0.83 / 0.80 | Bayesian model with gene modules & clinical variables |
Table 2: Clinical Context for Endometrial RNA-Seq Applications
| Clinical Scenario | Objective | Sample Type | Key RNA-Seq Outcomes | Clinical Utility |
|---|---|---|---|---|
| Recurrent Implantation Failure (RIF) [4] | Identify displaced Window of Implantation (WOI) | Endometrial Biopsy / UF-EVs | ERT result (Receptive/Non-Receptive) and personalized transfer timing | Guide personalized embryo transfer (pET) to improve live birth rates |
| Pregnancy Outcome Prediction [5] | Predict likelihood of success after euploid blastocyst transfer | UF-EVs | Differential expression signature and WGCNA module scores | Inform prognosis and guide decisions on further treatment interventions |
| Endometrial Cancer Diagnosis [1] | Molecular classification for risk stratification | Tumor Tissue | Molecular subtype (POLEmut, dMMR, CN-high, CN-low) | Inform FIGO 2023 staging and guide adjuvant therapy (e.g., immunotherapy) |
Signaling Pathways and Workflows
RNA-Seq Workflow for Endometrial Analysis
Clinical Impact of Endometrial RNA-Seq
The Scientist's Toolkit
Table 3: Essential Research Reagents and Materials for Endometrial RNA-Seq Studies
| Item | Function/Application | Specific Example/Note |
|---|---|---|
| Aspiration Catheter | Non-invasive collection of uterine fluid for UF-EVs analysis [5]. | Specialized for endometrial fluid aspiration to minimize contamination. |
| Ultracentrifuge | Isolation of extracellular vesicles (UF-EVs) from biofluids by high-speed centrifugation [5]. | Critical for pelleting EVs from uterine fluid supernatant. |
| TRIzol LS Reagent | Simultaneous extraction of RNA, DNA, and proteins from liquid samples. Maintains RNA integrity [5]. | Preferred for RNA extraction from small-volume, complex biofluids. |
| Ribosomal RNA Depletion Kit | Removal of abundant ribosomal RNA to enrich for mRNA and non-coding RNA prior to library prep. | Essential for total RNA-seq from samples with low mRNA content. |
| Strand-Specific RNA Library Prep Kit | Construction of sequencing libraries that preserve the strand orientation of the original transcript. | Allows for accurate mapping of antisense transcripts and overlapping genes. |
| Illumina Sequencing Platform | High-throughput sequencing of cDNA libraries (e.g., NovaSeq 6000). | Generates the raw data (FASTQ files) for all downstream analysis. |
| DESeq2 / edgeR (R Packages) | Statistical analysis of differential gene expression from raw read counts. | Accounts for library size and biological variability to find significant genes. |
| GSEA Software | Gene Set Enrichment Analysis to identify coordinated changes in predefined gene sets/pathways [5]. | Moves beyond single-gene analysis to interpret biological pathways. |
| WGCNA (R Package) | Weighted Gene Co-expression Network Analysis to find modules of highly correlated genes [5]. | Identifies networks of genes associated with clinical traits like pregnancy. |
Overcoming the Challenge of Menstrual Cycle Staging with Molecular Models
The endometrium undergoes dramatic, rapid molecular changes throughout the menstrual cycle, driven by fluctuations in estrogen and progesterone levels [6]. Traditional methods for determining endometrial cycle stage—including last menstrual period (LMP) dating, endocrine measures of luteinizing hormone (LH) surge, and histopathological dating—are limited by significant inter-individual variability in cycle length and subjective interpretation [6]. These challenges have hampered reproducibility in studies investigating endometrial-related pathologies such as heavy menstrual bleeding, endometriosis, and recurrent implantation failure [6].
The development of a molecular staging model using global gene expression data represents a transformative approach for precisely timing the endometrial cycle. This protocol details the application of RNA sequencing (RNA-seq) from endometrial biopsies to create a high-resolution, objective molecular clock that accurately normalizes cycle stage across individuals, thereby enabling more robust differential expression analysis related to age, ancestry, and disease states [6].
Model Development and Key Findings
Quantitative Foundations of the Molecular Staging Model
The molecular staging model was developed using RNA-seq data from 236 endometrial biopsies, with cycle stage initially classified by pathologists into one of seven stages [6]. The model analyzes the expression patterns of over 20,000 genes, identifying more than 3,400 that show significant, synchronized changes across the cycle, with the most dramatic expression shifts occurring during the secretory phase [6].
Table 1: Key Quantitative Findings from the Molecular Staging Model Development
| Parameter | Description | Value |
|---|---|---|
| Total Subjects | Number of subjects in the final model development (Study 1) | 236 [6] |
| Subject Age | Median age at time of biopsy | 33 years (range 18-49) [6] |
| Gene Number | Total genes analyzed in the model | 20,067 [6] |
| Cyclical Genes | Genes with significant synchronized daily expression changes | >3,400 [6] |
| Staging Accuracy | Correlation (r) between molecular and pathology-post-ovulatory day (POD) estimates | 0.9297 [6] |
| Model Flexibility | Correlation (r) between model using 14 POD stages vs. 3 broad secretory stages | 0.9807 [6] |
Analysis Workflow and Computational Validation
The model was built and validated through a multi-step analytical process:
- Analysis 1 (Secretory Phase Focus): A model was built using 96 secretory-phase samples where multiple pathology reports agreed within 2 post-ovulatory days. Splines were fitted to expression data for each gene, and the post-ovulatory day for each sample was estimated by minimizing the mean squared error (MSE) between observed and expected gene expression [6].
- Analysis 2 (Whole-Cycle Model): Using all 236 samples, proliferative phase samples were re-assigned into early, mid, and late stages by fitting a penalized cubic regression spline. A cyclic cubic regression spline was then fitted for all genes across the 7 cycle stages [6].
- Temporal Normalization: Samples were ranked from start to end of the cycle, transforming the timeline to a percentage of cycle completion, thus removing reliance on an idealized 28-day cycle [6].
- Validation: The final model demonstrated strong correlation with pathology-derived estimates and maintained accuracy even when using broader cycle stage classifications [6].
Experimental Protocol: Endometrial Biopsy RNA-seq for Molecular Staging
Sample Collection and Preparation
Patient Selection and Consent:
- Recruit premenopausal women with regular, self-reported menstrual cycles and normal endometrial pathology as confirmed by an experienced pathologist [6].
- Record detailed patient metadata, including age, last menstrual period (LMP), symptoms, pregnancy history, and endometriosis status [6].
- Obtain informed consent for endometrial biopsy and molecular analysis, following institutional ethical guidelines.
Endometrial Tissue Biopsy:
- Perform endometrial biopsy via standard clinical procedure (e.g., Pipelle biopsy) at the suspected time point in the cycle [6].
- Note: An alternative, less-invasive method involves collecting menstrual effluent using a specialized tampon-based platform for RNA analysis [7].
- Immediately following collection, place the tissue sample in a sterile cryovial and flash-freeze in liquid nitrogen. Store at -80°C until RNA extraction.
RNA Extraction, Sequencing, and Quality Control
RNA Extraction:
- Homogenize frozen endometrial tissue using a mortar and pestle with liquid nitrogen or a commercial homogenizer.
- Extract total RNA using a column-based kit with DNase I treatment to remove genomic DNA contamination.
- Quantify RNA concentration using a fluorometer and assess integrity via an automated electrophoresis system. Accept samples with an RNA Integrity Number (RIN) > 7.0 for sequencing.
Library Preparation and Sequencing:
- Prepare stranded mRNA-seq libraries from 1 µg of total RNA using poly-A selection for mRNA enrichment.
- Perform library amplification with appropriate cycle number to avoid over-amplification.
- Validate library quality and quantity using a fragment analyzer and quantitative PCR.
- Sequence libraries on a high-throughput platform (e.g., Illumina NovaSeq) to a minimum depth of 30 million paired-end 150 bp reads per sample.
Bioinformatic Analysis and Molecular Staging
Read Processing and Alignment:
- Quality control of raw sequencing reads is performed using FastQC.
- Trim adapters and low-quality bases using Trimmomatic.
- Al processed reads to the human reference genome (GRCh38) using a splice-aware aligner like STAR.
Gene Expression Quantification:
- Quantify read counts for each gene using featureCounts, based on the GENCODE gene annotation.
- Normalize raw counts to account for library size and compositional biases, generating Transcripts Per Million (TPM) values for downstream modeling.
Molecular Stage Assignment:
- Input the normalized expression matrix for the ~20,000 genes into the pre-trained molecular staging model.
- The model fits a cyclic cubic regression spline for each gene and calculates the model time for the sample by finding the time point that minimizes the Mean Squared Error (MSE) between the observed expression data and the expected expression from the gene models [6].
- The output is a precise "model time," represented as a percentage of the way through the menstrual cycle, which can be mapped back to conventional pathological stages.
Workflow Visualization
Figure 1: Endometrial RNA-seq and Molecular Staging Workflow. The process from patient sample collection to final cycle stage assignment, highlighting the key wet-lab (green) and computational (blue) phases.
Research Reagent Solutions
Table 2: Essential Materials and Reagents for Molecular Staging Experiments
| Item | Function/Application | Example/Note |
|---|---|---|
| Endometrial Biopsy Kit | Minimally invasive tissue collection for RNA preservation. | Pipelle de Cornier or similar device [8]. |
| RNA Stabilization Reagent | Preserves RNA integrity immediately post-collection. | RNAlater or similar commercial reagent. |
| Total RNA Extraction Kit | Isolation of high-quality, DNA-free total RNA. | Column-based kits with DNase I treatment step. |
| RNA QC Instrument | Assessment of RNA quality and quantity prior to library prep. | Bioanalyzer or TapeStation; require RIN > 7.0. |
| Stranded mRNA-seq Kit | Library preparation from total RNA for sequencing. | Kits utilizing poly-A selection for mRNA enrichment. |
| Sequence Alignment Software | Maps sequenced reads to the reference genome. | STAR or HISAT2 splice-aware aligners. |
| Expression Quantification Tool | Generates count data for each gene per sample. | featureCounts or HTSeq. |
| Computational Staging Model | Assigns cycle stage based on gene expression input. | Pre-trained model using cyclic cubic regression splines [6]. |
Integrating Single-Cell and Bulk RNA-seq for Cellular Heterogeneity Insights
The integration of single-cell RNA sequencing (scRNA-seq) and bulk RNA sequencing (bulk RNA-seq) has emerged as a powerful methodological framework for unraveling cellular heterogeneity in complex tissues. This approach is particularly valuable in endometrial research, where dynamic cellular composition changes throughout the menstrual cycle significantly impact physiological and pathological states. While bulk RNA-seq provides population-average transcriptional profiles, it obscures cell-to-cell variation. scRNA-seq resolves this heterogeneity but may miss rare cell populations due to sampling limitations. Their integration offers a comprehensive perspective, enabling researchers to contextualize single-cell findings within broader tissue transcriptomic landscapes and identify clinically relevant cellular subpopulations and biomarkers [9].
In endometrial biology, this integrated approach has advanced our understanding of conditions such as thin endometrium, endometriosis, repeated implantation failure (RIF), and intrauterine adhesions (IUA). These insights are transforming reproductive medicine by identifying specific cellular contributors to disease pathogenesis and revealing novel therapeutic targets [10] [11] [12]. This Application Note provides detailed protocols for implementing integrated scRNA-seq and bulk RNA-seq analysis specifically for endometrial biopsy research, enabling the resolution of cellular heterogeneity and its functional consequences.
Integrated Analysis Workflow: From Endometrial Tissue to Biological Insights
The following diagram illustrates the comprehensive workflow for integrating single-cell and bulk RNA-seq data in endometrial research, from sample preparation through final interpretation:
Experimental Protocols
Sample Collection and Preparation
Endometrial Tissue Collection Protocol
- Patient Selection and Consent: Obtain written informed consent following institutional ethics committee approval. For RIF studies, include patients with ≥3 failed embryo transfers of good-quality euploid embryos. Control groups should comprise multiparous women without uterine pathologies or history of miscarriage [2].
- Cycle Timing and LH Surge Detection: Monitor menstrual cycles using transvaginal ultrasound combined with urinary LH dipstick testing to detect the LH surge (designated LH+0). Schedule endometrial biopsies for LH+7 (mid-luteal phase) to assess endometrial receptivity [2].
- Biopsy Procedure: Collect endometrial tissues from the fundal and upper uterine regions using a Pipelle endometrial biopsy catheter under hysteroscopic guidance to ensure precise anatomical sampling [2].
- Sample Processing: Immediately process collected tissues. For scRNA-seq: Place tissue in cold preservation medium and process within 1 hour for viability. For bulk RNA-seq: Snap-freeze in liquid nitrogen and store at -80°C. For spatial transcriptomics: Embed tissue in OCT compound, freeze in isopentane pre-chilled with liquid nitrogen, and store at -80°C [2] [12].
Single-Cell RNA Sequencing
Cell Isolation and Library Preparation
- Tissue Dissociation: Mince endometrial tissue into approximately 5mm pieces and digest in freshly prepared enzymatic solution (collagenase IV + DNase I) at 37°C for 45-60 minutes with gentle agitation [13].
- Cell Suspension Processing: Filter dissociated cells through 40μm cell strainers, centrifuge at 400g for 5 minutes, and resuspend in PBS with 0.04% BSA. Assess cell viability using trypan blue exclusion (>90% viability required) and count with a hemocytometer or automated cell counter [13] [12].
- Single-Cell Partitioning and Barcoding: Use the 10x Genomics Chromium Next GEM Single-Cell 3' Reagent Kit v3.1 according to manufacturer instructions. Target cell recovery of 5,000-10,000 cells per sample. Incorporate Unique Molecular Identifiers (UMIs) to control for amplification biases [13] [9].
- Library Construction and Sequencing: Perform reverse transcription, cDNA amplification, and library construction following 10x Genomics protocols. Assess library quality using Agilent Bioanalyzer. Sequence on Illumina NovaSeq 6000 with 150bp paired-end reads, targeting 50,000 reads per cell [13] [12].
Computational Analysis Pipeline
- Data Preprocessing: Process raw sequencing data through Cell Ranger (v7.0.1) pipeline for alignment to GRCh38 reference genome, barcode assignment, and UMI counting [13].
- Quality Control and Filtering: Using Seurat R package (v5.0.1), filter out low-quality cells with <250 detected genes, >10% mitochondrial gene content, or <500 transcripts. Remove doublets using DoubletFinder (v2.0.3) [14] [12].
- Data Integration and Normalization: Normalize data using
SCTransformand integrate datasets from multiple samples using Harmony algorithm to correct for batch effects while preserving biological variation [14]. - Cell Clustering and Annotation: Perform principal component analysis, followed by graph-based clustering (resolution=0.7) and UMAP/t-SNE for visualization. Annotate cell types using canonical marker genes and reference databases (Human Primary Cell Atlas) [10] [14].
Bulk RNA Sequencing
RNA Extraction and Library Preparation
- RNA Extraction: Homogenize frozen endometrial tissue in TRIzol reagent using a mechanical homogenizer. Extract total RNA following manufacturer protocol, including DNase I treatment to remove genomic DNA contamination [15].
- RNA Quality Control: Assess RNA integrity using Agilent Bioanalyzer, requiring RNA Integrity Number (RIN) >7.0 for inclusion. Verify concentration using Qubit RNA HS Assay [2].
- Library Preparation and Sequencing: Use Illumina TruSeq Stranded mRNA Library Prep Kit following manufacturer instructions. Sequence on Illumina NovaSeq 6000 platform with 150bp paired-end reads, targeting 30-50 million reads per sample [15] [16].
Computational Analysis
- Data Processing: Align raw reads to GRCh38 reference genome using HISAT2. Perform quality control with FastQC and aggregate gene counts using featureCounts [16].
- Differential Expression Analysis: Identify differentially expressed genes using DESeq2 R package with thresholds of |log2FC| >1 and adjusted p-value <0.05. Visualize results with volcano plots and heatmaps [15] [16].
- Pathway Analysis: Conduct Gene Ontology (GO) and KEGG pathway enrichment analyses using clusterProfiler R package (v3.14.3) to identify biological processes and pathways dysregulated in endometrial conditions [15] [16].
Data Integration Approaches
Cell Type Deconvolution
- Reference-Based Deconvolution: Use CARD (v1.1) or MuSiC algorithms to estimate cell type proportions in bulk RNA-seq data using scRNA-seq data as reference. This enables tracking cellular composition changes across conditions and samples [2].
- Validation: Compare deconvolution results with immunohistochemistry or flow cytometry data from parallel samples to validate computational predictions [12].
Cross-Platform Validation
- Target Identification: Identify key cell subpopulations and marker genes from scRNA-seq data, then validate their clinical relevance using survival analysis or differential expression in bulk RNA-seq datasets [13] [17].
- Pathway Conservation: Assess whether pathways identified in single-cell analyses are recapitulated in bulk tissue data, indicating broader relevance beyond specific subpopulations [14] [16].
Key Applications in Endometrial Research
Resolving Cellular Heterogeneity in Endometrial Disorders
Integrated single-cell and bulk RNA-seq analyses have revealed previously unappreciated cellular heterogeneity in various endometrial conditions. In thin endometrium (TE), researchers identified perivascular CD9+SUSD2+ cells as putative progenitor stem cells with altered functionality. scRNA-seq of proliferative-phase endometrial samples from TE patients and controls demonstrated TE-associated shifts in cell function, manifesting as increased fibrosis and attenuated cell cycle progression and adipogenic differentiation [10].
Cell-cell communication network mapping further revealed aberrant crosstalk among specific cell types in TE, implicating crucial pathways such as excessive collagen deposition around perivascular CD9+SUSD2+ cells. This indicates a disrupted response to endometrial repair in TE, particularly in remodeling of the extracellular matrix [10]. The integration of bulk RNA-seq data confirmed the relevance of these findings at the tissue level and enabled the development of molecular classifiers for disease stratification.
In intrauterine adhesions (IUA), characterized by endometrial fibrosis, integrated analysis of 139,395 single cells from nine individuals identified seven stromal and five macrophage subsets, revealing increased immune cell infiltration and a profibrotic shift in macrophage states. Immunohistochemistry confirmed elevated CD68+ macrophages and higher expression of S100A8, CCL2, CCL5, and SPP1 in IUA tissues. Functional experiments demonstrated that macrophage-derived CCL5 and SPP1 promote fibroblast-to-myofibroblast transition, a key mechanism in fibrosis development [12].
Understanding Endometrial Receptivity and Implantation Failure
For repeated implantation failure (RIF), spatial transcriptomics of endometrial tissues from normal individuals and RIF patients during the mid-luteal phase has provided unprecedented insights into the spatial organization of cellular niches critical for embryo implantation. Seven distinct cellular niches with specific characteristics were identified, with deconvolution of spatial data integrated with public single-cell datasets revealing that unciliated epithelia were the dominant components [2].
In endometriosis-associated infertility, integrated analyses have uncovered altered embryo-endometrial dialogue. Construction of an interactome network between normal secretory-phase endometrial samples and day-5 blastocysts showed significant enrichment of pathways associated with tissue remodeling, angiogenesis, and immune regulation, all of which were disrupted in endometriosis patients. Additionally, endometriosis patients presented an increased frequency and activation of NK, CD4+, and CD8+ cells, which interfere with embryo-endometrial crosstalk [11].
Table 1: Key Cell Populations Identified Through Integrated RNA-seq Analysis in Endometrial Disorders
| Cell Population | Biological Function | Alteration in Disease | Identification Method |
|---|---|---|---|
| Perivascular CD9+SUSD2+ cells | Endometrial progenitor cells, tissue regeneration | Reduced adipogenic differentiation in thin endometrium | scRNA-seq + IHC validation [10] |
| SPP1+ macrophages | Immune regulation, tissue repair | Profibrotic shift in intrauterine adhesions | scRNA-seq + CellChat [12] |
| Unciliated epithelial cells | Endometrial receptivity, embryo implantation | Altered spatial distribution in RIF | Spatial transcriptomics + scRNA-seq [2] |
| Activated NK cells | Immune tolerance during implantation | Increased activation in endometriosis | scRNA-seq + flow cytometry [11] |
| Cluster 3 stromal cells | Extracellular matrix production | Expansion in intrauterine adhesions | scRNA-seq + RNA velocity [12] |
Signaling Pathways in Endometrial Disorders
The following diagram summarizes key signaling pathways and cellular interactions discovered through integrated RNA-seq analyses in endometrial disorders:
The Scientist's Toolkit: Essential Research Reagents and Platforms
Table 2: Key Research Reagent Solutions for Integrated RNA-seq Studies
| Category | Specific Product/Platform | Application in Endometrial Research |
|---|---|---|
| Single-Cell Platforms | 10x Genomics Chromium Next GEM | Single-cell partitioning and barcoding [13] |
| Smart-Seq2 | Full-length transcript sequencing [9] | |
| Spatial Transcriptomics | 10x Visium Spatial Gene Expression | Spatial mapping of endometrial niches [2] |
| Bioinformatics Tools | Seurat R package (v5.0.1) | scRNA-seq data integration and analysis [10] [14] |
| Harmony algorithm | Batch effect correction [14] | |
| CARD (v1.1) | Cell type deconvolution [2] | |
| CellChat (v1.6.1) | Cell-cell communication analysis [10] [12] | |
| Critical Assays | Pipelle Endometrial Biopsy Catheter | Standardized endometrial tissue collection [2] |
| TrimGalore | Read quality trimming and adapter removal [16] | |
| HISAT2 | Read alignment to reference genome [16] | |
| DoubletFinder (v2.0.3) | Doublet identification and removal [14] |
The integration of single-cell and bulk RNA sequencing technologies provides a powerful framework for resolving cellular heterogeneity in endometrial biology and pathology. The protocols outlined in this Application Note enable comprehensive characterization of endometrial tissues at multiple resolutions, from population-level transcriptomic changes to cell-type-specific alterations in rare subpopulations. As demonstrated in applications ranging from thin endometrium to implantation failure, this integrated approach reveals not only which cell types are present but how they communicate and contribute to clinical outcomes.
The essential tools and methodologies described here provide researchers with a roadmap for implementing these cutting-edge approaches in their own endometrial research programs. As spatial transcriptomics and multi-omics integrations continue to evolve, they will further enhance our ability to connect molecular findings to tissue structure and function, ultimately advancing both fundamental understanding and clinical applications in reproductive medicine.
A Step-by-Step RNA-seq Workflow for Endometrial Tissue
Within the context of advanced genomic research, particularly studies utilizing RNA sequencing (RNA-seq) for endometrial analysis, the method of initial tissue sampling is a critical determinant of data quality and reliability. The integrity of RNA-seq findings is profoundly influenced by the biopsy technique employed, making the selection of an optimal sampling method a foundational step in endometrial research. This document provides a detailed comparison of common endometrial biopsy techniques—Pipelle suction curettage, dilatation and curettage (D&C), and hysteroscopically directed biopsy—with specific emphasis on their applicability in research settings where subsequent RNA-seq analysis is required. We evaluate these methods based on diagnostic accuracy, sample adequacy, patient acceptability, and, most importantly, their compatibility with downstream molecular applications.
Comparative Analysis of Endometrial Biopsy Techniques
Diagnostic Performance Characteristics
The diagnostic accuracy of various endometrial sampling methods has been systematically evaluated in multiple studies. Hysteroscopically directed biopsy demonstrates superior diagnostic accuracy (AUC 0.957) compared to D&C (AUC 0.909) and Pipelle suction curettage (AUC 0.858) for detecting endometrial hyperplasia or carcinoma [18]. Sensitivity follows a similar pattern: 91.3% for hysteroscopically directed biopsy, 82.0% for D&C, and 71.7% for Pipelle suction curettage, while specificity remains excellent across all methods (>95%) [18].
A recent prospective observational study of 125 women with abnormal uterine bleeding (AUB) demonstrated that Pipelle biopsy showed high diagnostic concordance with D&C (Cohen's Kappa=0.948, p<0.001), with 97.6% agreement between the methods [19]. The sensitivity, specificity, positive predictive value, and negative predictive value of Pipelle biopsy were 94.1%, 99.8%, 99.6%, and 99.5%, respectively, when D&C was used as the reference standard [19].
Table 1: Diagnostic Accuracy of Endometrial Biopsy Methods for Detecting Endometrial Pathology
| Method | Area Under Curve (AUC) | Sensitivity (%) | Specificity (%) | Positive Predictive Value (%) | Negative Predictive Value (%) |
|---|---|---|---|---|---|
| Hysteroscopically Directed Biopsy | 0.957 | 91.3 | >95 | 99.6 | 99.5 |
| Dilatation and Curettage (D&C) | 0.909 | 82.0 | >95 | - | - |
| Pipelle Suction Curettage | 0.858 | 71.7-94.1 | >95-99.8 | 99.6 | 99.5 |
Sample Adequacy and Histopathological Correlation
Sample adequacy is crucial for both diagnostic accuracy and downstream research applications. Studies indicate that Pipelle biopsy provides adequate samples for histological evaluation in 97.6% of cases, compared to 100% for D&C (p=0.247) [19]. A comparative study of 300 women with AUB found no significant differences in sample adequacy between Pipelle and D&C techniques [20].
The diagnostic efficacy of these methods was further validated in a study of 100 women with perimenopausal bleeding, which reported 100% correlation between Pipelle biopsy and D&C in detecting specific endometrial pathologies including simple hyperplasia without atypia, secretory endometrium, complex hyperplasia without atypia, and carcinoma [21]. However, it is noteworthy that 37% of endometrial samples obtained by aspiration cytology using a nasogastric tube were inadequate for evaluation, compared to only 4% for both Pipelle biopsy and D&C [21].
Patient Tolerability and Procedural Characteristics
Patient acceptability and procedural efficiency are important considerations for both clinical practice and research protocols. Pipelle endometrial biopsy is significantly better tolerated than D&C, with markedly lower pain scores (visual analog scale 1.64 vs. 5.81, p<0.0001) [19]. The procedure time for Pipelle is substantially shorter (3.65 minutes vs. 12.07 minutes for D&C, p<0.0001), and it is more cost-effective (₹322.48 vs. ₹1387.40, p<0.0001) [19].
Complication rates also favor the Pipelle device, with studies reporting significantly fewer complications compared to D&C (4% vs. 15.2%, p=0.003) [19]. Women who underwent endometrial biopsies with anesthesia for D&C reported reduced pain levels and greater satisfaction, highlighting the importance of pain management strategies, particularly in high-resource settings [20].
Table 2: Procedural Characteristics and Patient Acceptability of Endometrial Biopsy Methods
| Characteristic | Pipelle Biopsy | Dilatation and Curettage (D&C) |
|---|---|---|
| Pain Score (VAS) | 1.64 | 5.81 |
| Procedure Time (minutes) | 3.65 | 12.07 |
| Cost (₹) | 322.48 | 1387.40 |
| Complication Rate (%) | 4 | 15.2 |
| Sample Adequacy (%) | 97.6 | 100 |
| Anesthesia Requirement | Not required | Required |
Experimental Protocols for Endometrial Biopsy in Research Settings
Pipelle Endometrial Biopsy Protocol for RNA-seq Applications
Equipment and Reagents:
- Pipelle endometrial suction catheter (3.0-3.6 mm diameter)
- Sterile speculum
- Cervical cleaning solution (povidone-iodine or chlorhexidine)
- Vulsellum forceps
- RNA stabilization solution (RNAlater or equivalent)
- Liquid nitrogen container for flash freezing
- Cryovials for sample storage
Procedure:
- Position the patient in dorsal lithotomy position and insert sterile speculum to visualize the cervix.
- Clean the cervix thoroughly with povidone-iodine or chlorhexidine solution.
- Gently insert the Pipelle device through the cervical os into the uterine cavity without using tenaculum or anesthesia when possible.
- Withdraw the inner piston completely to create negative pressure and maintain suction.
- Slowly rotate and move the device back and forth in the endometrial cavity for 60-90 seconds to ensure adequate tissue sampling.
- Release suction before withdrawing the device from the uterine cavity.
- Immediately expel the tissue sample into RNA stabilization solution or flash-freeze in liquid nitrogen within 30 seconds of collection to preserve RNA integrity [22].
- Store samples at -80°C until RNA extraction.
Technical Notes:
- For RNA-seq applications, minimize warm ischemia time by rapid tissue processing.
- Document the menstrual cycle date precisely, as endometrial gene expression varies significantly throughout the cycle [6].
- For optimal RNA preservation, consider dividing the sample for both histopathological analysis and RNA extraction.
Hysteroscopically Directed Biopsy Protocol
Equipment and Reagents:
- Rigid or flexible hysteroscope (2.5-4.0 mm diameter)
- Biopsy forceps
- Distension media (saline or glycine)
- Light source and video system
- RNA stabilization solution
Procedure:
- Perform the procedure under sterile conditions with or without anesthesia.
- Insert the hysteroscope through the cervical os under direct visualization.
- Systematically inspect the entire endometrial cavity, documenting any abnormalities.
- Under direct visualization, obtain targeted biopsies from suspicious areas using biopsy forceps.
- Obtain additional random biopsies from normal-appearing endometrium for research comparison.
- Immediately transfer tissue to RNA stabilization solution or flash-freeze as described above.
Technical Notes:
- Use saline as distension media when planning RNA extraction to avoid chemical interference.
- Limit procedure time to minimize tissue exposure to distension media.
- Document the exact location of each biopsy for spatial transcriptomics applications.
Integrated Workflow for Endometrial Biopsy and RNA-seq Analysis
The relationship between biopsy methods and subsequent RNA-seq analysis can be visualized as an integrated workflow where each step influences downstream outcomes:
Diagram 1: Integrated workflow from biopsy to RNA-seq analysis
The Scientist's Toolkit: Essential Research Reagents and Materials
Table 3: Essential Research Reagents for Endometrial Biopsy and RNA-seq Analysis
| Reagent/Material | Function | Application Notes |
|---|---|---|
| Pipelle Endometrial Suction Device | Minimally invasive tissue collection | Flexible catheter, 3.0-3.6 mm diameter; suitable for outpatient sampling [19] |
| RNAlater Stabilization Solution | RNA preservation at collection | Maintains RNA integrity; compatible with both histopathology and RNA extraction |
| CD13 and CD9 Antibodies | Cell-type specific sorting | Enables separation of stromal (CD13+) and epithelial (CD9+) cells for single-cell analysis [22] |
| Collagenase Solution | Tissue dissociation | Digests extracellular matrix for single-cell suspension preparation; optimize concentration and timing [22] |
| STRT (Single-cell Tagged Reverse Transcription) Kit | Single-cell RNA-seq library prep | Modified protocol for endometrial cells; enables 48-plex Illumina-compatible libraries [22] |
| Molecular Staging Model Algorithm | Cycle stage normalization | Computational tool for normalizing gene expression across menstrual cycle stages [6] |
Discussion and Research Implications
The selection of an endometrial biopsy method for RNA-seq research requires careful consideration of multiple factors. While Pipelle biopsy offers excellent patient acceptability, cost-effectiveness, and sufficient sample adequacy for most applications, hysteroscopically directed biopsy provides superior diagnostic accuracy and enables targeted sampling of specific endometrial regions.
For RNA-seq applications, particularly single-cell analyses, the rapid processing and RNA preservation capabilities of the Pipelle method make it highly suitable, especially when combined with immediate stabilization protocols [22]. However, the visual guidance offered by hysteroscopy may be preferable for studies targeting specific endometrial pathologies or anatomical regions.
A critical consideration in endometrial research is accounting for the dramatic cyclical changes in gene expression throughout the menstrual cycle. The development of a molecular staging model that normalizes gene expression data across cycle stages represents a significant advancement, enabling more accurate comparisons between samples [6]. This model reveals significant and remarkably synchronized daily expression changes for over 3400 endometrial genes throughout the cycle, with the most dramatic changes occurring during the secretory phase.
Future research directions should focus on optimizing biopsy protocols specifically for genomic applications, establishing standardized RNA quality metrics for endometrial tissue, and developing integrated analysis pipelines that incorporate both histological and molecular data. The combination of precise sampling techniques with advanced computational normalization methods will significantly enhance the reliability and reproducibility of endometrial transcriptomic studies.
For researchers designing studies involving endometrial RNA-seq analysis, Pipelle endometrial biopsy represents the optimal balance of patient acceptability, procedural efficiency, and sample adequacy when global endometrial assessment is required. In cases where targeted sampling or superior diagnostic accuracy is prioritized, hysteroscopically directed biopsy is recommended. Regardless of the method selected, immediate RNA stabilization and precise documentation of menstrual cycle stage are essential for generating high-quality, reproducible transcriptomic data. The integration of optimized biopsy techniques with molecular staging models will significantly advance our understanding of endometrial biology and pathology.
Ribonucleic acid (RNA) sequencing has revolutionized transcriptome studies, enabling detailed analysis of gene expression patterns. For sensitive applications like the investigation of endometrial receptivity, the quality of the starting RNA material is paramount. A crucial step in any RNA-seq workflow is the accurate assessment of RNA quantity and purity, as these parameters directly impact the reliability and reproducibility of downstream results. The ratio of spectrophotometric absorbance at 260 nm and 280 nm (A260/A280) serves as a primary and rapid indicator of RNA sample purity. This application note details standardized protocols for sample preservation and RNA extraction, specifically contextualized within endometrial biopsy research for RNA-seq, with a focus on ensuring optimal RNA quantity and purity.
Background
The Critical Role of RNA Quality in Endometrial Research
In reproductive biology, transcriptomic profiling of endometrial biopsies is essential for understanding conditions like Repeated Implantation Failure (RIF). High-quality RNA is a prerequisite for techniques such as Endometrial Receptivity Analysis (ERA), which relies on precise gene expression patterns to identify the window of implantation [23]. The integrity of the extracted RNA directly influences the accuracy of these tests. Furthermore, advanced methodologies like spatial transcriptomics, which map gene expression within tissue architecture, require RNA of the highest quality to generate meaningful data [2]. The fundamental principle is that degraded or impure RNA can lead to inaccurate quantification and false conclusions in differential expression analysis.
Fundamentals of Spectrophotometric RNA Quality Control
Spectrophotometry provides a quick, non-destructive method for initial RNA assessment. The principle is based on the Beer-Lambert law, which states that absorbance is directly proportional to concentration. RNA absorbs ultraviolet light most strongly at 260 nm due to its constituent aromatic bases. An A260 reading of 1.0 corresponds to approximately 40 µg/mL of single-stranded RNA [24].
The A260/A280 ratio is used to assess protein contamination. For pure RNA, the ideal ratio is often cited as ~2.0, with a range of 1.8–2.1 generally accepted for high-purity preparations [24] [25]. The A260/230 ratio serves as a secondary indicator of purity, detecting contaminants such as chaotropic salts, phenol, or carbohydrates. Ideal A260/230 values are typically greater than 1.8 [26] [25].
It is critical to note that these ratios can be influenced by pH and ionic strength. Acidic conditions, such as those found in pure water, can lower the A260/A280 ratio, while slightly alkaline buffers like TE (pH 8.0) provide more accurate and reproducible ratios [24] [26]. Table 1 outlines the interpretation of these key purity ratios.
Table 1: Interpretation of Nucleic Acid Purity Ratios
| Ratio | Ideal Value | Significance of Low Value | Significance of High Value |
|---|---|---|---|
| A260/A280 | ~2.0 (RNA) [25] | Protein or phenol contamination [26] [25] | N/A |
| ~1.8 (DNA) [27] | |||
| A260/230 | >1.8 – 2.2 [26] [25] | Contamination by salts, organics (e.g., phenol, guanidine) [26] | N/A |
Application Notes
Sample Preservation Methodologies for Endometrial Tissue
The preservation method chosen at the moment of collection is the first and most critical factor determining RNA integrity. For endometrial biopsies, which are rich in RNases, rapid stabilization is essential.
- Snap-Freezing: The gold-standard method involves immediately freezing tissue samples in liquid nitrogen. This instantly halts all enzymatic activity, including RNase degradation. Studies on RNase-rich tissues like placenta have confirmed that snap-freezing yields significantly higher RNA Quality Number (RQN) compared to other methods [28]. Snap-frozen samples should be stored at -80°C until RNA extraction.
- RNAlater and Other Stabilization Solutions: These commercial solutions permeate tissues to stabilize and protect RNA at room temperature, which is ideal for clinical settings where immediate freezing is impractical. While convenient, validation is recommended as performance can be tissue-dependent. One study on ovine placenta found RNAlater resulted in lower RQN compared to snap-freezing, though it provided higher RNA concentration [28].
- Emerging Methods: For novel sample types like menstrual effluence, which contains endometrial tissue, specialized collection systems with proprietary preservation buffers have been validated to maintain RNA stability for up to 14 days at ambient temperature, enabling at-home collection for transcriptomic studies [29].
RNA Extraction and Purity Optimization
Following preservation, the extraction protocol must efficiently isolate RNA while removing contaminants.
- Choosing an Extraction Method: Phenol-based methods like Trizol can provide high yields but often require a secondary clean-up step (e.g., with a silica column-based kit such as RNeasy) to remove residual proteins and organics that can interfere with absorbance readings and downstream enzymatic reactions [30]. Column-based kits are generally recommended for producing pure RNA preparations suitable for sensitive applications like RNA-seq [30].
- The Importance of DNase Treatment: Because spectrophotometry cannot distinguish between RNA and DNA, treatment with RNase-free DNase is a critical step to remove contaminating genomic DNA, which would otherwise inflate the A260 reading and lead to overestimation of RNA concentration [24].
- Troubleshooting Purity Ratios: Suboptimal A260/A280 or A260/230 ratios require corrective action.
- Low A260/A280 (<1.8): Suggests protein contamination. A second round of purification using a column-based kit or re-extraction with a phenol:chloroform step is recommended.
- Low A260/230 (<1.8): Indicates contamination with salts, carbohydrates, or residual phenol. This can often be resolved by an additional wash step with 70% ethanol during extraction or by using a kit designed to remove specific contaminants [26] [30].
Protocols
Detailed Protocol: RNA Extraction from Endometrial Biopsy
This protocol is adapted for endometrial tissue and aims to maximize RNA yield, purity, and integrity.
Materials & Reagents:
- RNase-free pipette tips, microcentrifuge tubes, and gloves
- Liquid nitrogen and pre-cooled mortar and pestle or cryogenic disruptor
- TRI Reagent (or equivalent)
- Chloroform
- 100% and 70% Ethanol (molecular biology grade)
- RNase-free water
- Silica-membrane column-based RNA purification kit (e.g., RNeasy)
- DNase I, RNase-free
Procedure:
- Tissue Homogenization:
- For snap-frozen tissue, keep the sample submerged in liquid nitrogen. Using a pre-cooled mortar and pestle or a cryogenic disruptor, pulverize the tissue to a fine powder.
- Immediately transfer the powder to a tube containing TRI Reagent (approx. 1 mL per 50-100 mg tissue) and homogenize thoroughly. Incomplete homogenization is a common source of low yield.
Phase Separation:
- Incubate the homogenate for 5 minutes at room temperature.
- Add 0.2 mL of chloroform per 1 mL of TRI Reagent. Cap the tube securely and shake vigorously by hand for 15 seconds.
- Incubate at room temperature for 2-3 minutes.
- Centrifuge at 12,000 × g for 15 minutes at 4°C. The mixture will separate into a lower red phenol-chloroform phase, an interphase, and a colorless upper aqueous phase containing the RNA.
RNA Precipitation and Wash:
- Transfer the aqueous phase to a new tube. Avoid disturbing the interphase.
- Precipitate the RNA by mixing with an equal volume of 70% ethanol.
Column Purification and DNase Treatment:
- Transfer the solution to a silica-membrane column and centrifuge according to the kit instructions.
- Perform an on-column DNase I digestion to remove genomic DNA contamination. Apply the DNase I mixture directly to the column membrane and incubate at room temperature for 15 minutes [24].
- Wash the column with the provided buffers to remove impurities.
Elution:
- Elute the pure RNA in 30-50 µL of RNase-free water. Using a slightly alkaline buffer like TE (pH 8.0) can improve A260/A280 ratio accuracy but may interfere with some downstream applications [24].
Protocol: Spectrophotometric RNA Quantification and Purity Assessment
This protocol uses a microvolume spectrophotometer (e.g., NanoDrop).
Procedure:
- Blank Measurement:
- Pipette 1-2 µL of the same solution used to elute the RNA (e.g., RNase-free water or TE buffer) onto the measurement pedestal.
- Perform a blank measurement to calibrate the instrument.
Sample Measurement:
- Wipe the pedestal clean with a lint-free tissue.
- Pipette 1-2 µL of the RNA sample onto the pedestal.
- Measure the absorbance and record the concentration, A260/A280, and A260/230 ratios.
Interpretation and Quality Thresholds:
- Concentration: Ensure the value is within the instrument's linear range (typically 5-3000 ng/µL).
- Purity: Proceed only if A260/A280 is between 1.8–2.1 and A260/230 is >1.8 [25] [30]. Samples outside these ranges should be repurified.
- Note: For highly dilute samples, fluorometric methods (e.g., Qubit RNA assays) are more accurate for concentration determination [25] [30].
The Scientist's Toolkit
Table 2: Essential Research Reagent Solutions for RNA Work
| Reagent / Kit | Function | Application Note |
|---|---|---|
| RNAlater Stabilization Solution | Stabilizes RNA in tissues at room temperature. | Ideal for clinical biopsy samples where immediate freezing is not feasible [28]. |
| TRI Reagent | Monophasic phenol and guanidine thiocyanate solution for liquid-phase separation. | Provides high RNA yield; often requires a secondary column clean-up for optimal purity for RNA-seq [30]. |
| RNeasy Kit (Qiagen) | Silica-membrane column for RNA binding, washing, and elution. | Effectively removes contaminants like salts and proteins, yielding high-purity RNA with good A260/A280 ratios [30]. |
| DNase I, RNase-free | Enzymatically degrades contaminating double-stranded DNA. | Critical pre-treatment step to ensure accurate RNA quantification and prevent false results in qRT-PCR or RNA-seq [24]. |
| Qubit RNA Assay | Fluorometric quantification using RNA-binding dyes. | More specific and accurate for low-concentration RNA samples than spectrophotometry; does not measure contaminants [27]. |
Workflow and Data Analysis
The following diagram illustrates the complete integrated workflow from sample collection to quality assessment for RNA-seq, incorporating key decision points and quality gates.
Workflow for RNA Quality Control
Discussion
The A260/A280 ratio remains a cornerstone of RNA quality control due to its speed and simplicity. However, it is imperative to recognize its limitations. This method assesses purity but not integrity; a sample with perfect ratios may still be degraded. Therefore, it should be used in conjunction with an integrity assessment method, such as the RNA Integrity Number (RIN) generated by capillary electrophoresis (e.g., Agilent Bioanalyzer or TapeStation). For RNA-seq, a RIN of 7 or higher is typically required [30].
In the context of endometrial research, consistent application of these protocols is vital. Variations in preservation or extraction methods can introduce batch effects that confound transcriptomic analysis. By standardizing protocols around snap-freezing or validated stabilization solutions, followed by column-based purification and rigorous QC checks, researchers can ensure that the biological signals of interest, such as those differentiating receptive from non-receptive endometrium, are accurately captured.
Successful RNA-seq analysis of endometrial biopsies is fundamentally dependent on the quality of the input RNA. A rigorous workflow that combines immediate and appropriate sample preservation, efficient RNA extraction incorporating DNase treatment, and thorough quality control using both spectrophotometric (A260/A280, A260/230) and integrity-based (RIN) metrics is non-negotiable. Adherence to the detailed protocols and application notes provided here will equip researchers with a robust framework to generate high-quality RNA, thereby ensuring the reliability and interpretability of their transcriptomic data in reproductive health research.
Within endometrial biopsy research, transcriptomic analysis via RNA sequencing (RNA-Seq) has become a cornerstone for investigating conditions such as endometrial receptivity, recurrent implantation failure (RIF), and endometrial cancer [4] [31] [32]. A critical initial decision in designing such studies is the choice between a whole-transcriptome and a targeted RNA-Seq approach. This choice profoundly impacts the project's cost, depth of information, throughput, and ultimately, its conclusions. This application note delineates the core technical considerations, protocols, and applications of these two methodologies to guide researchers in selecting the optimal strategy for their specific research objectives in endometrial biology.
Core Technology Comparison
The fundamental difference between whole-transcriptome and targeted approaches lies in the scope of RNA species captured and the subsequent sequencing strategy.
Whole-Transcriptome Sequencing (WTS) aims to provide a global view of the transcriptome. Following RNA extraction, ribosomal RNA (rRNA) is typically depleted, or polyadenylated (poly(A)) RNA is selected. The RNA is then fragmented and reverse-transcribed using random primers to generate cDNA libraries that represent fragments from across the entire length of transcripts [33] [34]. This method requires higher sequencing depth to ensure sufficient coverage across all transcripts.
Targeted RNA-Seq approaches, such as 3' mRNA-Seq, focus on specific subsets of genes or transcript regions. For gene expression quantification, a common method involves cDNA synthesis initiated by an oligo(dT) primer that binds to the poly(A) tail, capturing sequences near the 3' untranslated region (UTR) [33]. An alternative targeted approach, as exemplified by the TempO-Seq platform, uses sentinel gene sets to infer the broader transcriptomic response [35].
Table 1: Core Methodological Differences Between WTS and Targeted RNA-Seq.
| Feature | Whole-Transcriptome Sequencing (WTS) | Targeted RNA-Seq (e.g., 3' mRNA-Seq) |
|---|---|---|
| Library Construction | RNA fragmentation, random priming, rRNA depletion/poly(A) selection [33] | Oligo(dT) priming for 3' end capture [33] or sentinel gene panels [35] |
| Sequencing Read Distribution | Reads distributed across entire transcript body [33] | Reads localized to the 3' end of transcripts [33] |
| Typical Input RNA | 100 ng of depleted RNA (for kits like TruSeq) [36] | Can be as low as 1 ng of depleted RNA (for kits like SMARTer) [36] |
| Key Advantage | Detects novel isoforms, splicing events, non-coding RNAs [33] | Cost-effective, high-throughput, streamlined analysis [35] [33] |
| Primary Limitation | Higher cost per sample, complex data analysis [35] [33] | Limited to known 3' ends or pre-defined genes; misses global splicing data [35] [33] |
Performance and Outcome Comparison
The choice of methodology directly influences experimental outcomes, including gene detection sensitivity, quantification accuracy, and operational efficiency.
Detection and Quantification
- Gene Detection: Whole-transcriptome methods (e.g., TruSeq) typically detect a greater number of expressed genes and differentially expressed genes (DEGs) compared to targeted approaches [33] [34]. One study found that a full-length cDNA method (TeloPrime) detected approximately half the number of genes as TruSeq [34].
- Quantitative Accuracy: Despite detecting fewer DEGs, targeted approaches show a strong correlation with whole-transcriptome data in terms of gene expression patterns and pathway analysis [35] [33]. A federal challenge found that transcriptomic points of departure (tPODs) derived from a sentinel gene set were within a factor of 10 or less of those from whole transcriptome sequencing [35].
- Transcript Length Bias: WTS protocols can assign more reads to longer transcripts, whereas 3' mRNA-Seq assigns reads roughly equally regardless of transcript length [33]. This can make targeted methods better at detecting short transcripts, while WTS is more powerful for analyzing long transcripts [33].
Technical and Operational Considerations
- Sequencing Depth: Targeted methods like 3' mRNA-Seq require significantly lower sequencing depth (1-5 million reads per sample) due to reads being focused on less diverse 3' UTRs. WTS requires higher depth for full transcript coverage [33].
- Cost and Throughput: Targeted approaches are designed for high-throughput and lower cost per sample, making them suitable for large-scale screening projects [35] [33]. The per-sample cost was a key evaluation metric in the US EPA challenge, where targeted solutions were competitive [35].
- Sample Quality: Targeted 3' methods are often more robust for degraded RNA samples (e.g., FFPE tissues) because they only require the integrity of the 3' end of transcripts [33].
Table 2: Comparative Performance of RNA-Seq Methodologies.
| Performance Metric | Whole-Transcriptome Sequencing | Targeted RNA-Seq |
|---|---|---|
| Number of Detected DEGs | Higher [33] | Lower, but captures key changes [33] |
| Correlation of Expression Data | Benchmark | High correlation with WTS (e.g., R = 0.883-0.906) [33] [34] |
| Splicing & Isoform Analysis | Capable (e.g., detects >2x more splicing events) [34] | Limited to none [33] |
| Required Sequencing Depth | High (e.g., >30M reads) | Low (e.g., 1-5M reads) [33] |
| Cost Per Sample | Higher | Lower (target of ≤$50/sample achievable) [35] |
| Best for Degraded RNA | Less suitable | More suitable (e.g., FFPE) [33] |
Application in Endometrial Research
Both methodologies have demonstrated significant utility in addressing specific research questions in endometrial biology.
- Identifying Receptivity Signatures: Whole-transcriptome RNA-Seq has been pivotal in developing molecular staging models for the endometrial cycle and identifying receptivity-specific genes in epithelial and stromal cells [31] [6]. These studies require the comprehensive, hypothesis-free discovery that WTS provides.
- Diagnostic Assay Development: Targeted approaches are well-suited for translating discoveries into clinical diagnostics. For instance, a targeted RNA-Seq-based endometrial receptivity test (ERT) that analyzes 175 predictive genes is used to guide personalized embryo transfer (pET) in patients with RIF [4].
- Disease Mechanism Investigation: WTS has been used to define distinct immune response landscapes and identify inflammation-related diagnostic markers in complex endometrial conditions like latent endometrial tuberculosis [37]. Similarly, it enables the construction of protein-protein interaction networks between embryo and endometrium [31].
Experimental Protocols
Protocol A: Whole-Transcriptome Sequencing (Illumina Stranded mRNA Prep)
This protocol is adapted from methods used in recent endometrial studies [37] [34].
- RNA Extraction & QC: Extract total RNA from endometrial biopsy using TRIzol. Assess quality and integrity using an instrument (e.g., Agilent Bioanalyzer); an RNA Integrity Number (RIN) ≥ 6.5 is recommended [37].
- mRNA Enrichment: Purify polyadenylated RNA from total RNA using magnetic oligo(dT) beads.
- RNA Fragmentation & Priming: Elute and fragment the purified mRNA using divalent cations under elevated temperature. This normalizes transcript length bias.
- First & Second Strand cDNA Synthesis: Synthesize first-strand cDNA using reverse transcriptase and random primers. Follow with second-strand synthesis in the presence of dUTP to generate strand-marked cDNA.
- Library Construction: Ligate Illumina sequencing adapters to the blunt-ended, double-stranded cDNA.
- Library Amplification & Clean-up: Perform PCR amplification to enrich for adapter-ligated fragments. Incorporate dual index barcodes for sample multiplexing. Clean up the final library using a magnetic bead-based system.
- Library QC & Sequencing: Quantify the library and check size distribution. Sequence on an Illumina platform with a minimum recommended depth of 30 million paired-end reads per sample.
Protocol B: Targeted 3' mRNA Sequencing (QuantSeq)
This protocol is optimized for high-throughput gene expression quantification [33].
- RNA Input: Use 10 ng of total RNA as input.
- Reverse Transcription with Oligo(dT) Priming: Synthesize first-strand cDNA using an oligo(dT) primer that contains an Illumina-compatible adapter sequence. This step simultaneously selects for polyadenylated RNA and primes cDNA synthesis from the 3' end.
- RNA Template Degradation: Degrade the original RNA template.
- Second Strand Synthesis: Initiate second strand synthesis using a random primer containing the complementary Illumina adapter sequence. This results in double-stranded cDNA with adapters on both ends.
- Library Amplification: Perform a limited-cycle PCR to amplify the library using Illumina index primers for sample multiplexing.
- Library Clean-up: Purify the final PCR product using magnetic beads.
- Sequencing: Sequence on an Illumina platform. A single-read 50-75 bp sequencing run is sufficient, requiring only 1-5 million reads per sample.
Workflow and Decision Pathway
The following diagram illustrates the key decision points for selecting the appropriate RNA-Seq approach for an endometrial research project.
The Scientist's Toolkit: Research Reagent Solutions
Table 3: Essential Reagents and Kits for RNA-Seq Library Preparation.
| Product Name | Type | Key Features | Reference |
|---|---|---|---|
| Illumina Stranded mRNA Prep | Whole Transcriptome | Poly(A) selection, strand-specific, standard for full transcriptome data. | [37] [34] |
| Lexogen QuantSeq 3' mRNA-Seq Kit | Targeted (3') | Low input (10 ng), low sequencing depth, cost-effective for gene counting. | [33] |
| BioSpyder TempO-Seq | Targeted (Sentinel) | Pre-defined gene panels, ultra-high-throughput, no RNA extraction needed. | [35] |
| SMARTer Stranded RNA-Seq Kit | Whole Transcriptome | Good for low input RNA (1 ng), utilizes template-switching mechanism. | [36] [34] |
| TruSeq RNA Single Indexes | Multiplexing | Barcodes for pooling multiple libraries, essential for high-throughput. | [38] |
| RIBO-Zero Plus rRNA Depletion Kit | rRNA Removal | Depletes ribosomal RNA for WTS where non-coding RNA is of interest. | [36] |
| Agilent Bioanalyzer RNA Nano Kit | QC | Assesses RNA Integrity Number (RIN) critical for library success. | [37] |
| KAPA HyperPrep Kit | DNA Library Prep | Efficient library construction with combined enzymatic steps. | [38] |
The decision between a targeted and a whole-transcriptome approach for endometrial research is not a matter of one being superior to the other, but rather which is fit-for-purpose. Whole-transcriptome sequencing is the undisputed choice for discovery-phase research, where the goal is an unbiased exploration of the entire transcriptomic landscape, including alternative splicing, novel isoforms, and non-coding RNAs. In contrast, targeted RNA-Seq offers a robust, cost-effective, and high-throughput solution for projects focused on specific gene panels, such as validating diagnostic signatures or conducting large-scale screening, where biological conclusions at the pathway level remain highly consistent with WTS [35] [33]. By aligning the technical strengths of each method with their specific research questions and operational constraints, scientists can optimally leverage RNA sequencing to advance our understanding of endometrial biology and pathology.
RNA sequencing (RNA-seq) has become a fundamental tool for exploring the transcriptome, providing unique insights into cellular systems. When applied to human endometrial research, it enables a deeper understanding of the dramatic cyclical changes in gene expression that occur throughout the menstrual cycle and in various pathological states [39]. The endometrium undergoes extensive molecular changes to prepare for embryo implantation, and aberrations in these processes can lead to infertility, endometriosis, adenomyosis, and other common gynecological conditions [6] [40]. Nearly all women will experience endometrial-related health problems during their lifetime, making precise analytical tools essential for both research and clinical diagnostics [6].
This application note provides a comprehensive framework for analyzing RNA-seq data from endometrial biopsies, from initial sample processing through to differential expression analysis. We focus specifically on methodologies validated for endometrial tissue, which presents unique challenges due to its complex cellular heterogeneity and rapidly changing gene expression profiles [41] [22]. The protocols described here integrate both bulk and single-cell RNA-seq approaches, enabling researchers to capture the full spectrum of transcriptional dynamics in this critically important tissue.
Sample Collection and Preparation
Endometrial Biopsy Collection
Endometrial tissue sampling requires careful timing and processing to preserve RNA integrity and ensure accurate representation of the transcriptome. The following protocol has been specifically optimized for endometrial biopsies [22]:
- Biopsy Timing: Determine cycle stage precisely using luteinizing hormone (LH) surge detection (LH+0) or molecular staging models [6]. Mid-secretory phase (LH+7 to LH+9) is critical for receptivity studies.
- Collection Method: Use Pipelle catheter or similar device to obtain tissue samples.
- Immediate Preservation: Place tissue immediately into cryopreservation medium containing 1× DMEM, 30% fetal bovine serum, and 7.5% DMSO.
- Controlled Freezing: Transfer cryovial to Nalgene Cryo 1°C 'Mr. Frosty' Freezing Container at -80°C overnight, then store in liquid nitrogen.
- Processing Timeframe: Complete tissue manipulation from disaggregation to cell-type-specific labelling and single-cell sorting within 90 minutes at low temperature to minimize changes in gene expression profiles.
Tissue Dissociation and Cell Sorting
For single-cell RNA-seq studies, tissue dissociation and cell sorting protocols must maintain cell viability while preserving transcriptional states [41] [22]:
- Thawing and Washing: Thaw tissue sample and wash twice with DMEM solution.
- Enzymatic Dissociation: Dissociate in 5 ml DMEM containing 0.5% collagenase in shaking incubator (110 rpm) at 37°C until tissue is digested (<20 minutes).
- Cell Suspension Preparation: Add ice-cold FBS and ACK lysing buffer, then centrifuge at 205 × g at 4°C for 6 minutes.
- Filtration: Resuspend cells in ice-cold PBS with 5% FBS and filter through 50μm and 35μm strainers to separate single cells from undigested fragments.
- Cell Sorting: Use fluorescence-activated cell sorting (FACS) with CD13-specific antibodies for stromal cells and CD9-specific antibodies for epithelial cells [41].
Table 1: Critical Steps in Endometrial Tissue Processing for RNA-seq
| Processing Step | Key Parameters | Purpose | Considerations |
|---|---|---|---|
| Biopsy Timing | LH surge dating, molecular staging model [6] | Accurate cycle stage assignment | Natural variability in cycle length affects gene expression |
| Cryopreservation | DMEM + 30% FBS + 7.5% DMSO | Maintain cell viability and RNA integrity | Controlled freezing rate essential |
| Tissue Dissociation | 0.5% collagenase, 37°C, <20 min | Single-cell suspension | Longer digestion increases RNA degradation |
| Cell Sorting | FACS with CD13 (stromal) and CD9 (epithelial) antibodies [41] | Cell-type-specific analysis | Epithelial cells yield lower transcriptome data |
RNA Sequencing Workflow
Library Preparation and Sequencing
RNA-seq library preparation follows standardized protocols with specific considerations for endometrial tissue:
- RNA Extraction: Use miRNeasy Mini and RNeasy MinElute kits with DNase I treatment to isolate small RNA and large RNA fractions separately [40].
- Quality Control: Assess RNA integrity using Bioanalyzer 2100 Small RNA kit.
- Library Construction: Prepare libraries using TruSeq Small RNA Library Preparation Guide with 1μg total RNA or small RNA fraction as input [40].
- Size Selection: Manually select libraries corresponding to miRNA length (145-160bp) using gel electrophoresis (6% Novex TBE gels).
- Sequencing: Normalize, pool libraries, and sequence on Illumina platforms (HiSeq 2000/2500) with 50-cycle single-read configuration.
Quality Control and Read Preprocessing
Initial quality assessment and read grooming are critical for generating reliable gene expression data [42]:
The FastQC report provides multiple quality metrics including sequence quality, GC content, and library complexity. Each metric is annotated with a green check (pass), red cross (fail), or yellow exclamation mark (caution) to guide preprocessing decisions [42].
Bioinformatics Analysis Pipeline
Read Alignment and Quantification
The alignment workflow forms the foundation for accurate transcriptome quantification. The GDC mRNA analysis pipeline provides a robust framework suitable for endometrial studies [43]:
This two-pass method with STAR includes splice junction detection and generates genomic BAM files containing both aligned and unaligned reads. Quality assessment is performed pre-alignment with FASTQC and post-alignment with Picard Tools [43].
Expression Quantification
Gene-level expression is measured with STAR as raw read counts, which are subsequently augmented with several transformations [43]:
- FPKM: Fragments per Kilobase of transcript per Million mapped reads
- FPKM-UQ: Upper quartile normalized FPKM
- TPM: Transcripts per Million
These values are annotated with gene symbol and gene bio-type using GENCODE annotations (v36 for current GDC pipelines) [43]. The STAR counting results do not count reads mapped to more than one different gene, which is important for avoiding ambiguous assignments.
Differential Expression Analysis
Differential expression analysis identifies genes that are significantly dysregulated between experimental conditions (e.g., fertile vs. infertile endometrium) [42]:
This analysis pipeline begins with raw sequence reads and progresses through quality checks, alignment, and statistical testing to yield a set of significantly dysregulated genes [42]. For endometrial studies, particularly those investigating receptivity, this approach has identified hundreds of simultaneously up- and down-regulated genes involved in critical processes [40].
Experimental Design Considerations for Endometrial Studies
Molecular Staging Model
Accurate menstrual cycle staging presents a significant challenge in endometrial research due to natural variability in cycle length. A molecular staging model has been developed to address this issue [6]:
- Sample Collection: Collect endometrial biopsies across multiple cycle timepoints.
- Pathological Assessment: Classify samples into menstrual, proliferative (early, mid, late), and secretory (early, mid, late) stages.
- Model Development: Fit penalized cyclic cubic regression splines to expression data from all genes.
- Cycle Time Assignment: Assign each sample a "model time" using the time which minimizes mean squared error between observed expression data and corresponding gene models.
- Validation: Compare molecular stage with pathological assessments and LH surge dating.
This model reveals significant and remarkably synchronized daily changes in expression for over 3400 endometrial genes throughout the cycle, with the most dramatic changes occurring during the secretory phase [6].
Special Considerations for Endometrial Research
- Cellular Heterogeneity: Endometrial tissue contains luminal epithelium, glandular epithelium, and stroma, requiring either physical separation or computational deconvolution [22].
- Temporal Dynamics: Gene expression changes rapidly across the menstrual cycle, necessitating precise timing of sample collection [6].
- Pathological Confirmation: Combine molecular staging with histological dating to confirm endometrial phase [40].
- Multi-Cohort Designs: Consider population-specific differences by including multiple cohorts in study design [40].
Table 2: Endometrial RNA-seq Analysis Workflow
| Analysis Stage | Tools/Approaches | Endometrial-Specific Considerations |
|---|---|---|
| Sample Collection | Pipelle catheter, LH surge dating, molecular staging model [6] | Precise cycle staging critical due to rapid transcriptome changes |
| Quality Control | FastQC, Trimmomatic | High RNase activity in endometrium requires rapid processing [41] |
| Alignment | STAR two-pass method [43] | Use GRCh38 reference genome with GENCODE v36 annotations |
| Quantification | STAR gene counts, FPKM, FPKM-UQ, TPM [43] | Account for genes encompassed by other genes |
| Differential Expression | DESeq2, edgeR, limma voom [42] | Model cycle stage as covariate in statistical design |
Visualization and Data Interpretation
Effective visualization is essential for interpreting complex RNA-seq data from endometrial studies [44]. The following principles should guide visualization choices:
- Visual Scalability: Consider how visual encodings will perform with large endometrial datasets that may include thousands of rapidly changing genes [6].
- Multiple Resolutions: Provide different visual representations for various data types (gene expression, splice junctions, fusion genes) and enable comparisons between them.
- Color Accessibility: Ensure sufficient color contrast and accommodate visually impaired users by allowing color customization.
- Biological Context: Integrate visualization with biological pathway databases to interpret endometrial gene expression in functional contexts.
The Scientist's Toolkit
Table 3: Essential Research Reagents and Computational Tools for Endometrial RNA-seq
| Reagent/Tool | Function | Application in Endometrial Research |
|---|---|---|
| Pipelle Catheter | Endometrial tissue collection | Minimally invasive biopsy for longitudinal studies [22] |
| CD13/CD9 Antibodies | Cell surface markers | FACS sorting of stromal (CD13+) and epithelial (CD9+) cells [41] |
| Collagenase | Tissue dissociation | Enzymatic digestion to single-cell suspension [22] |
| STAR Aligner | RNA-seq read alignment | Two-pass method with splice junction detection [43] |
| DESeq2 | Differential expression analysis | Identifies dysregulated genes in endometrial receptivity [42] |
| FastQC | Quality control | Assesses sequence quality before and after trimming [42] |
| Molecular Staging Model | Cycle time assignment | Normalizes gene expression across variable menstrual cycles [6] |
Workflow Diagrams
Endometrial RNA-seq Analysis Pipeline
Endometrial RNA-seq Analysis Workflow
Molecular Staging Model Development
Molecular Staging Model Development
This application note provides a comprehensive framework for implementing bioinformatic analysis pipelines for RNA-seq studies of endometrial biopsies. From sample collection through to differential expression analysis, each step requires careful consideration of the unique properties of endometrial tissue, particularly its cellular heterogeneity and rapidly changing transcriptome across the menstrual cycle. The integration of molecular staging models with standard RNA-seq workflows enables more accurate comparisons between samples, advancing our understanding of endometrial biology in both health and disease. As transcriptomic technologies continue to evolve, these foundational protocols will support ongoing investigations into endometrial receptivity, infertility, and common gynecological disorders that affect women worldwide.
Endometrial receptivity remains a pivotal factor in the success of assisted reproductive technologies (ART), particularly for patients experiencing recurrent implantation failure (RIF). The precise timing of the window of implantation (WOI) is critical for embryo-endometrial synchronization. This application note explores the transformative potential of RNA sequencing (RNA-seq)-based endometrial receptivity testing, presenting quantitative clinical outcomes, detailed experimental protocols, and essential research tools for scientists and drug development professionals. By providing a structured framework for receptivity assessment, this resource aims to advance research in personalized reproductive medicine through standardized methodologies and data-driven approaches.
Clinical Performance Data
RNA-seq-based endometrial receptivity testing (rsERT) demonstrates significant improvements in key reproductive outcomes across multiple patient cohorts. The quantitative data below summarize clinical performance metrics from recent studies.
Table 1: Clinical Outcomes of RNA-seq-Based Endometrial Receptivity Testing in RIF Patients
| Study Cohort | Number of Patients | HCG-Positive Rate (%) | Implantation Rate (%) | Clinical Pregnancy Rate (%) | Statistical Significance (P-value) |
|---|---|---|---|---|---|
| rsERT Group [45] | 58 | 75.86 | 56.38 | 68.97 | - |
| Control Group [45] | 40 | 50.00 | 31.43 | 47.50 | - |
| P-value [45] | - | 0.030 | 0.002 | 0.033 | - |
| rsERT Group [46] | 115 | 63.50 | - | 54.80 | - |
| Control Group [46] | 272 | 51.50 | - | 38.60 | - |
| P-value [46] | - | 0.030 | - | 0.003 | - |
Table 2: Window of Implantation Displacement Patterns in Different Patient Populations
| Patient Population | Total Samples | Pre-Receptive (%) | Receptive (%) | Post-Receptive (%) | Displaced WOI (%) |
|---|---|---|---|---|---|
| Fertile Women [47] | 57 | 1.8 | 98.2 | 0.0 | 1.8 |
| RIF Patients [47] | 44 | 6.8 | 79.5 | 9.1 | 15.9 |
The significantly higher rate of displaced WOI in RIF patients (15.9% versus 1.8%, p=0.012) [47] highlights the critical role of personalized receptivity assessment in this population. The beREADY classification model demonstrated exceptional accuracy, with an average cross-validation accuracy of 98.8% and a validation group accuracy of 98.2% [47].
Experimental Protocols
Endometrial Biopsy Procedure
Principle: Obtain adequate endometrial tissue sample for RNA-seq analysis while ensuring patient safety and comfort [48] [49].
Equipment Required:
- Sterile and non-sterile gloves
- Vaginal speculum
- Single-toothed tenaculum
- Uterine sound
- Endometrial suction catheter (pipelle)
- Specimen container with formalin
- Topical anesthetic (e.g., 2% lidocaine gel or 20% benzocaine spray)
- Iodine swabs for cervical cleansing
- Cervical dilators (if needed)
Procedure:
- Patient Preparation: Administer non-steroidal anti-inflammatory drugs (NSAIDs) 30-60 minutes pre-procedure to reduce cramping [48]. Exclude pregnancy possibility before procedure initiation [49].
- Patient Positioning: Place patient in lithotomy position and perform bimanual examination to determine uterine size and position [49].
- Cervical Visualization: Insert speculum to visualize cervix. Apply topical anesthetic to cervix 3 minutes before proceeding [48].
- Cervical Cleansing: Cleanse cervix with antiseptic solution using ring forceps [48].
- Uterine Sounding: Stabilize cervix with tenaculum if needed. Gently insert uterine sound through cervical os to determine uterine depth and direction [49].
- Tissue Sampling: Insert endometrial biopsy catheter to uterine fundus. Fully withdraw internal piston to create suction. Rotate catheter 360° while moving in and out between fundus and internal os [48]. Perform 3-4 passes to ensure adequate tissue sampling [48].
- Sample Handling: Withdraw catheter and expel tissue into formalin container. Ensure tissue appears as dark red cores that do not disintegrate in formalin [48].
- Post-Procedure Care: Apply pressure to tenaculum site if used. Monitor for vasovagal reactions before patient ambulation [49].
Note: The American Society for Reproductive Medicine recommends against endometrial biopsy for routine infertility evaluation, supporting its specific application for receptivity testing in RIF patients [48].
RNA-seq-Based Endometrial Receptivity Testing Protocol
Principle: Profile expression of endometrial receptivity-associated genes to precisely identify the window of implantation with hourly precision [46].
Equipment and Reagents:
- RNA stabilization solution
- RNA extraction kit
- cDNA synthesis kit
- RNA-seq library preparation kit
- Sequencing platform (Illumina)
- TAC-seq (Targeted Allele Counting by sequencing) reagents [47]
Procedure:
- RNA Extraction and Quality Control: Extract total RNA from endometrial biopsy tissue. Assess RNA integrity and quantity using appropriate methods [47].
- Library Preparation: Convert RNA to cDNA and prepare sequencing libraries using targeted or whole transcriptome approaches. The beREADY model analyzes 72 genes (57 receptivity biomarkers, 11 WOI-relevant genes, 4 housekeeper genes) [47].
- Sequencing: Perform high-throughput sequencing on appropriate platform (Illumina) [47].
- Bioinformatic Analysis:
- Quality Control: Assess raw sequence data quality using FastQC or similar tools
- Read Alignment: Map sequencing reads to reference genome
- Gene Expression Quantification: Calculate normalized read counts for targeted genes
- Machine Learning Classification: Apply random-forest regression model to predict optimal implantation point with hourly precision [46]
- Interpretation: Classify endometrial status as pre-receptive, receptive, or post-receptive based on expression profile [47]. Provide personalized embryo transfer timing recommendations.
Validation: The analytical pipeline should demonstrate high accuracy (>98%) in validation samples with concordant histological and LH dating [47].
Research Reagent Solutions
Table 3: Essential Research Reagents for Endometrial Receptivity Testing
| Reagent/Category | Specific Examples | Research Application |
|---|---|---|
| RNA Stabilization | RNA stabilization solution | Preserve endometrial tissue RNA integrity during storage and transport [47] |
| Library Preparation | TAC-seq reagents | Enable highly quantitative, targeted analysis of endometrial receptivity biomarkers down to single-molecule level [47] |
| Sequencing | Illumina sequencing platforms | Generate high-coverage transcriptome data for receptivity classification [47] |
| Cell Culture | iPSC culture media | Support development of endometrial disease models for receptivity research [50] |
| Genome Editing | CRISPR/Cas9 systems | Create isogenic controls for endometrial receptivity studies, reducing patient-to-patient variability [50] |
| Bioinformatic Tools | Ranger R package (v0.12.1) | Implement random-forest regression for precise WOI prediction with hourly accuracy [46] |
Workflow and Pathway Diagrams
Diagram 1: Endometrial Receptivity Testing Workflow
Diagram 2: Molecular Analysis Pipeline
RNA-seq-based endometrial receptivity testing represents a significant advancement in personalized reproductive medicine, enabling precise identification of the window of implantation with hourly accuracy. The documented improvement in clinical pregnancy rates for RIF patients, increasing from 38.6% to 54.8% with rsERT-guided transfer [46], demonstrates the clinical value of this approach. The standardized protocols and analytical frameworks presented herein provide researchers and drug development professionals with essential tools for advancing this field. Future directions include refining multi-omic integration, expanding biomarker validation across diverse patient populations, and developing novel therapeutics targeting endometrial receptivity pathways.
Solving Common Challenges in Endometrial RNA-seq Studies
Addressing Sample Heterogeneity and Contamination Risks
Sample heterogeneity and contamination risks present significant challenges in RNA sequencing (RNA-seq) studies of human endometrial biopsies, potentially compromising data integrity and biological interpretation. The endometrium is a complex tissue composed of diverse cell types—including epithelial, stromal, perivascular, and immune cells—whose proportions fluctuate dynamically throughout the menstrual cycle [51] [52]. Effective protocols must address both biological heterogeneity (the natural cellular diversity of the tissue) and technical contamination (the introduction of external or unintended materials during sample handling) to ensure the generation of clinically meaningful and reproducible transcriptomic data. This Application Note provides detailed protocols and analytical frameworks to mitigate these risks, specifically tailored for research applications in endometrial biology, endometriosis, and drug development.
The cellular complexity of the endometrium is now well-characterized through single-cell RNA sequencing (scRNA-seq) atlases. The Human Endometrial Cell Atlas (HECA), integrating data from 313,527 cells, has identified numerous distinct cell populations, including previously unreported epithelial and stromal subtypes [52]. Key cellular components that contribute to biological heterogeneity include:
- Epithelial Compartment: Consists of SOX9+ basalis cells (putative progenitors), ciliated cells, and glandular and luminal epithelial cells with distinct molecular signatures in the functionalis and basalis layers [52].
- Stromal Compartment: Comprises at least ten different stromal cell subsets and two pericyte populations, each with unique inflammatory and extracellular matrix (ECM) remodeling potentials [51].
- Immune Cells: Includes various macrophages, natural killer (NK) cells, and T-cells, whose prevalence shifts throughout the menstrual cycle and in disease states [52].
Potential sources of contamination in endometrial RNA-seq workflows include:
- Cellular Contamination: From cervical epithelial cells (KRT5+) or myometrial smooth muscle cells, often detected in biopsies that are not precisely localized [52].
- Microbial Contamination: From the reproductive tract microbiome, which can be co-sequenced and misinterpreted as host expression [3].
- Nuclease Contamination: From degraded cells in the sample, particularly concerning when working with menstrual effluence where approximately 30% of cells may be non-viable [3].
Table 1: Common Contaminants in Endometrial RNA-seq Studies
| Contaminant Type | Source | Potential Impact on Data |
|---|---|---|
| Cervical Epithelial Cells | Biopsy procedure | Detection of KRT5+ cells; misannotation of epithelial subtypes |
| Myometrial Cells | Deep biopsy | Detection of uterine smooth muscle cell markers (e.g., ACTA2) |
| Microbial RNA | Vaginal/cervical microbiome | False "expression" in non-aligned reads; skewed immune signatures |
| Degraded Host RNA | Delayed processing or non-viable cells | Reduced RNA Integrity Number (RIN); 3' bias in sequencing |
Experimental Protocols for Sample Collection and Processing
Endometrial Tissue Biopsy Collection and Single-Cell Isolation
This protocol, adapted from PMC8224746, is designed for the generation of high-quality single-cell suspensions from endometrial biopsies while preserving cellular integrity and minimizing stress responses [51].
Materials:
- Pipelle aspirator (Cooper Surgical)
- MACS Tissue Storage Solution (Miltenyi Biotec)
- Phosphate-buffered saline (PBS; Sigma-Aldrich)
- Dispase II (0.5 U/mL; Sigma-Aldrich)
- Collagenase III (150 U/mL; Worthington)
- DNase (139 U/mL; Sigma Aldrich)
- DMEM-F12 complete media with 10% FCS (Thermo Fisher Scientific)
- Red Blood Cell Lysis Buffer (Roche)
- TC20 Automated Cell Counter (BioRad)
Procedure:
- Biopsy Collection: Obtain endometrial functionalis biopsies from healthy donors during the proliferative phase (e.g., cycle day 7) using a Pipelle aspirator. Immediately place the biopsy in cold MACS Tissue Storage Solution for transport [51].
- Tissue Preparation: Wash the biopsy with PBS and mince into 2 mm³ pieces using sterile surgical blades.
- Gentle Enzymatic Digestion:
- Incubate the tissue pieces in a filter-sterilized Dispase II solution (0.5 U/mL) in complete media at 4°C overnight. This step helps dissociate tissue without inducing excessive cellular stress.
- Manually disaggregate the tissue the following day, wash with complete media, and centrifuge at 200 × g for 5 minutes.
- Secondary Digestion:
- Resuspend the tissue pellet in a solution of Collagenase III (150 U/mL) and DNase (139 U/mL) in complete media.
- Agitate the mixture for 45 minutes at 37°C until the tissue is completely dissociated.
- Cell Recovery and Washing:
- Wash the cell suspension with complete media and centrifuge at 200 × g for 5 minutes.
- Treat the pellet with 1 mL of Red Blood Cell Lysis Buffer for 5 minutes at room temperature to remove erythrocytes.
- Stop the reaction with complete media, wash cells, and centrifuge again.
- Quality Control: Count cells and assess viability (aim for >90%) using an automated cell counter. Resuspend the final single-cell suspension in PBS with bovine serum albumin (400 µg/mL) at a concentration of 1000 cells/µL for downstream applications [51].
At-Home Menstrual Effluence Collection for RNA Analysis
For studies utilizing menstrual fluid as a non-invasive biospecimen, standardized collection is critical. The following protocol is validated for ambient temperature preservation of nucleic acids [3].
Materials:
- NextGen Jane collection kit (or equivalent: organic cotton tampon, nitrile glove, leak-proof jar with preservation buffer (e.g., Norgen Biotek))
- Spectrophotometer (for hemoglobin quantification)
Procedure:
- Collection: Participants use a provided organic cotton tampon for approximately four hours during days 1-3 of menstruation.
- Preservation: Using a nitrile glove, remove the tampon and place it immediately into the collection jar. Seal the jar, ensuring the tampon string is secured inside. Activate the device to release the preservation buffer, supersaturating the tampon.
- Shipping: Participants return the sample via standard mail at ambient temperature. RNA remains stable for up to 14 days in the preservation buffer [3].
- Processing:
- Upon receipt in the lab, extrude the tampon and centrifuge the sample to separate liquid from solid components.
- Aliquot the supernatant (containing cells and nucleic acids) for storage at -80°C or direct nucleic acid extraction.
- Quantify hemoglobin content using a spectrophotometer (absorbance at 550nm) to standardize samples by blood content [3].
Computational and Analytical Strategies for Risk Mitigation
Following wet-lab protocols, robust bioinformatic pipelines are essential to identify and account for residual heterogeneity and contamination.
Quality Control and Preprocessing
- Trimming: Use tools like Trimmomatic or Cutadapt to remove adapter sequences and low-quality nucleotides (Phred score >20). This increases the mapping rate and reduces noise [53].
- Alignment: Align reads to a combined reference encompassing the human genome (e.g., GRCh38) and a database of common microbial genomes (e.g., using Kraken2) to identify and quantify microbial reads [3].
- Gene Quantification: Generate a raw counts table using tools like HTSeq, focusing on uniquely aligned reads to minimize multi-mapping artifacts [54] [53].
ScRNA-seq Data Analysis for Deconvolving Heterogeneity
For single-cell studies, the following workflow using Seurat is recommended to identify and account for cell subpopulations [51].
Diagram 1: ScRNA-seq analysis workflow.
- Quality Control (QC): Filter out cells expressing fewer than 200 or more than 5000 genes, and cells with >10% mitochondrial gene expression, to remove low-quality cells and doublets [51].
- Normalization and Integration: Use Seurat's
sctransformmethod to normalize data and regress out cell cycle effects. Employ Canonical Correlation Analysis (CCA) to integrate multiple samples or batches, removing technical artifacts [51] [52]. - Clustering and Annotation: Perform dimensionality reduction with PCA, followed by graph-based clustering (Louvain algorithm). Annotate cell clusters using reference-based tools like SingleR with the Human Primary Cell Atlas (HPCA) and manual assessment of known marker genes [51] [52].
- Differential Expression and Pathway Analysis: Use Model-based Analysis of Single-Cell Transcriptomics (MAST) to identify differentially expressed genes between conditions or clusters, with a log fold change threshold of 1.5-2 and Bonferroni-adjusted p-value of 0.05 [51].
Table 2: Key Analytical Metrics for Assessing Sample Quality in Endometrial RNA-seq
| Analysis Stage | Metric | Target/Threshold | Indication of Problem |
|---|---|---|---|
| Raw Sequence Data | Q-score (Phred) | >30 per base | High sequencing error rate |
| Adapter Content | < 1% | Inefficient library prep | |
| Alignment | Mapping Rate to Genome | >80% | High contamination or degradation |
| rRNA Alignment Rate | < 5% | Inefficient rRNA depletion | |
| scRNA-seq QC | Median Genes per Cell | 200-5000 | Over- or under-digestion of tissue |
| Mitochondrial Read % | < 10% | High cell stress or death | |
| Contamination Check | Microbial Read % | Variable; establish baseline | Microbial contamination |
| Expression of KRT5, ACTA2 | Inconsistent with sample type | Cervical or myometrial contamination |
The Scientist's Toolkit: Essential Reagents and Materials
Table 3: Research Reagent Solutions for Endometrial RNA-seq Studies
| Item | Function/Application | Example/Catalog |
|---|---|---|
| Pipelle Aspirator | Minimally invasive biopsy of endometrial functionalis layer | Cooper Surgical Pipelle |
| Dispase II Solution | Gentle overnight digestion for tissue dissociation; preserves cell surface markers | Sigma-Aldrich, 0.5 U/mL |
| Collagenase III | Secondary enzymatic digestion for complete tissue dissociation | Worthington, 150 U/mL |
| MACS Tissue Storage Solution | Maintains tissue and cell viability during transport from clinic to lab | Miltenyi Biotec |
| Norgen Biotek Preservation Buffer | Stabilizes RNA in menstrual effluence at ambient temperature for remote collection | Norgen Biotek #... |
| Red Blood Cell Lysis Buffer | Removes contaminating erythrocytes from single-cell suspensions | Roche |
| Chromium Single Cell 3' Kit | Generation of barcoded scRNA-seq libraries | 10x Genomics |
| Zymo-Seq RiboFree Total RNA Library Kit | rRNA depletion and library prep for bulk RNA from complex samples | Zymo Research |
| Seurat R Package | Comprehensive toolkit for the analysis and integration of scRNA-seq data | CRAN/seurat |
| SingleR Annotation Tool | Automated cell type annotation for scRNA-seq data using reference atlases | Bioconductor/SingleR |
Successfully navigating the challenges of sample heterogeneity and contamination is paramount for generating robust and biologically relevant RNA-seq data from endometrial samples. The integrated strategies presented here—combining standardized, meticulous wet-lab protocols with rigorous computational quality control and analysis—provide a solid foundation. By adopting these practices, researchers can significantly enhance the reliability of their findings in endometrial biology, accelerate the discovery of novel therapeutic targets for conditions like endometriosis, and improve the predictive value of in vitro models in drug development.
Optimizing for Low-Input RNA and Degraded Samples from Clinical Settings
In the study of endometrial biology for applications such as infertility research and endometriosis, transcriptomic analysis via RNA sequencing (RNA-seq) has become an indispensable tool. However, clinical endometrial biopsies present significant challenges for high-quality RNA-seq data generation. These samples are often limited in quantity, typically obtained via Pipelle catheter, yielding minimal tissue, and frequently degraded due to variable ischemic times before preservation or the use of formalin-fixation and paraffin-embedding (FFPE) for clinical histopathology [22] [55]. Furthermore, the endometrium itself exhibits dramatic, rapid cyclical changes in gene expression, necessitating precise molecular staging for accurate comparisons [56]. These pre-analytical variables can severely compromise RNA integrity, leading to biased transcript representation and reduced sensitivity in downstream analyses. This Application Note provides a comprehensive framework for optimizing RNA-seq workflows specifically for low-input and degraded RNA derived from clinical endometrial biopsies, enabling robust transcriptomic profiling even from suboptimal samples.
Performance Comparison of RNA-seq Library Preparation Methods
The choice of library preparation method is the most critical factor in determining the success of RNA-seq with challenging endometrial samples. Different strategies—poly(A) enrichment, ribosomal RNA depletion, and exome capture—exhibit markedly different performance characteristics with degraded and low-input material.
Table 1: Comparative Performance of RNA-Seq Library Prep Methods on Challenging Samples
| Method (Representative Kit) | Principle | Optimal Input (Intact RNA) | Performance on Degraded RNA | Performance on Low-Input RNA (<10 ng) | Ideal Use Case for Endometrial Research |
|---|---|---|---|---|---|
| Poly(A) Enrichment (TruSeq Stranded mRNA) | Oligo-dT selection of polyadenylated transcripts | 100 ng | Poor; relies on intact 3' poly-A tails [57] | Moderate; performance drops significantly below 10 ng [57] | Intact RNA from fresh-frozen biopsies; standard gene expression |
| Ribosomal RNA Depletion (TruSeq Ribo-Zero) | Probe-based removal of ribosomal RNAs | 100 ng (but performs well lower) | Good; effective across a range of degradation levels [57] | Excellent; generates accurate data even at 1-2 ng input [57] | Degraded samples and low-input applications; non-coding RNA analysis |
| Exome Capture (TruSeq RNA Access) | Probe-based enrichment for exonic regions | 10 ng (intact) / 20 ng (degraded) | Best; most reliable for highly degraded samples (e.g., FFPE) [57] [55] | Good; reliable data down to 5 ng input [57] | Highly degraded FFPE samples; focused analysis of coding transcriptome |
A comprehensive assessment revealed that while all three major protocol types generate highly reproducible results (R² > 0.92) with intact RNA down to 10 ng, their performance diverges with sample quality. The ribosomal RNA depletion method (Ribo-Zero) demonstrates a clear advantage for degraded RNA samples, producing more accurate and reproducible gene expression results even at inputs as low as 1 ng and 2 ng. For the highly degraded RNA typically encountered in FFPE-preserved endometrial samples, the exome-capture protocol (RNA Access) performs best, generating reliable data down to 5 ng input [57]. This robustness for FFPE samples is attributed to its sequence-specific capture that does not depend on the presence of intact polyadenylated tails [55].
Integrated Experimental Protocol for Endometrial Biopsies
This section outlines a standardized workflow from biopsy collection through sequencing, optimized for maximal RNA recovery and data quality from precious clinical samples.
Sample Collection, Preservation, and Nucleic Acid Extraction
- Biopsy Collection: Perform endometrial biopsy using a Pipelle catheter under standard clinical procedure [22].
- Immediate Preservation: Immediately place the biopsied tissue into cryopreservation medium (e.g., 1X DMEM, 30% FBS, 7.5% DMSO). Place the vial in a controlled-rate freezing container at -80°C overnight before long-term storage in liquid nitrogen. This preserves cell viability and RNA integrity [22].
- Alternative for FFPE: For formalin fixation, use standard clinical pathology protocols, noting that this will lead to RNA fragmentation.
- Tissue Disaggregation: Thaw the biopsy and wash twice with DMEM. Dissociate in DMEM containing 0.5% collagenase in a shaking incubator (110 rpm) at 37°C for <20 minutes. Add ice-cold FBS and ACK lysing buffer, then centrifuge. Resuspend the cell pellet in ice-cold PBS with 5% FBS and filter sequentially through 50 µm and 35 µm strainer caps to obtain a single-cell suspension [22].
- RNA Extraction: Extract total RNA using a column-based kit (e.g., miRNeasy Mini Kit, AllPrep Micro Kit) optimized for small inputs. For FFPE samples, use specialized kits that reverse cross-links. Assess RNA quantity using a fluorometer (e.g., Quantifluor) and quality using an instrument such as the Bioanalyzer. An RNA Integrity Number (RIN) >7 is ideal, but lower RIN values are acceptable for rRNA-depletion or capture-based protocols [22] [58].
Library Preparation and Sequencing
- Protocol Selection: Refer to Table 1 for selection guidance.
- For Ribo-Zero Gold (rRNA depletion): Use as little as 1 ng of total RNA. Follow the manufacturer's protocol, which includes rRNA removal, cDNA synthesis, adapter ligation, and library amplification [57].
- For RNA Access (Exome Capture): Use 10-20 ng of total RNA. The protocol involves cDNA synthesis, adapter ligation, and hybridization with exon-capture probes. This method is particularly suited for FFPE-derived RNA [57] [58].
- For Very Low Inputs (<1 ng): Employ a template-switching protocol like SMARTer Stranded Total RNA-Seq Kit. This method incorporates a template-switching mechanism for efficient cDNA synthesis from low amounts of RNA, eliminating the need for ligation and providing strand-specificity [59].
- Library Amplification: Amplify the final library using 16 PCR cycles for cDNA libraries. The precise cycle number should be optimized to minimize amplification bias while yielding sufficient material for sequencing [58].
- Sequencing: Sequence the libraries on an Illumina platform (e.g., NextSeq 500, NovaSeq 6000). A paired-end 2x75 bp or 2x151 bp run is recommended. Target a minimum of 25-50 million read pairs per sample to ensure sufficient depth for accurate quantification, especially when working with degraded or low-input samples [59] [58].
Decision Workflow for Protocol Selection
The following diagram illustrates the decision-making process for selecting the optimal RNA-seq library preparation method based on your endometrial sample's quantity and quality.
Quality Control and Data Analysis
Rigorous quality control is paramount when working with challenging samples to ensure that biological conclusions are not driven by technical artifacts.
Primary and Secondary Analysis
- Sequencing Run QC: Assess overall run quality using Illumina's Sequencing Analysis Viewer or similar tools. Ensure that ≥80% of bases have a quality score (Q-score) of 30 or higher (Q30), indicating a base-calling accuracy of 99.9% [60].
- Demultiplexing and Read Trimming: Convert BCL files to FASTQ using bcl2fastq or iDemux. Trim adapter sequences, poly(A) tails, and low-quality bases using tools like Trimmomatic or cutadapt. For data from 2-channel chemistry sequencers, also trim poly(G) sequences that arise from absent signals [60].
- Contamination Filtering: Use a tool like RNA-QC-Chain to identify and filter reads originating from ribosomal RNA (internal contamination) or foreign species (external contamination) [61].
- Alignment and Quantification: Align processed reads to the human reference genome (e.g., GRCh38) using a splice-aware aligner such as STAR. Quantify reads mapped to genes using HTSeq-count or a similar tool. Generate alignment statistics, including the percentage of reads mapped to exons, introns, and intergenic regions, to assess library specificity [54] [58].
Table 2: Essential Quality Control Metrics and Their Benchmarks
| QC Stage | Metric | Target Benchmark | Notes for Degraded/Low-Input Samples |
|---|---|---|---|
| Raw Sequence Data | Q30 Score | >80% of bases [60] | Critical for accurate base calling in low-diversity libraries. |
| Cluster Density | Within 10% of instrument optimum [60] | Over/under-clustering reduces data quality. | |
| Alignment | Overall Alignment Rate | >90% [57] | Rates may be lower for highly degraded samples. |
| Exonic Mapping Rate | >70% for Ribo-Zero; >90% for RNA Access [57] | RNA Access shows superior specificity. | |
| rRNA Alignment Rate | <5% [61] | Indicates efficiency of rRNA depletion. | |
| Gene Expression | Number of Detected Genes | Sample-dependent | Compare within experiment; low-input may yield fewer genes. |
| Library Complexity | Assessed from mapped read distribution [61] | Lower complexity is expected with low-input and degraded samples. |
Tertiary Analysis and Endometrial-Specific Considerations
- Differential Expression: Identify differentially expressed genes (DEGs) using tools like edgeR or DESeq2, which employ a negative binomial model to account for biological variability and count-based data [54] [58].
- Endometrial Molecular Staging: Accurately determine the menstrual cycle stage of each endometrial sample using a molecular staging model. This is crucial as traditional dating methods (LMP, histology) are subjective and variable. Models based on the expression of thousands of genes can precisely place a sample along a continuous timeline, enabling valid comparisons between cycles of different lengths [56].
- Pathway and Enrichment Analysis: Perform Gene Ontology (GO) and pathway enrichment analysis (e.g., KEGG) on DEG lists to infer biological meaning from expression changes [54].
The Scientist's Toolkit: Key Research Reagent Solutions
Table 3: Essential Materials and Reagents for Low-Input/Degraded RNA-Seq
| Item | Function | Example Product(s) |
|---|---|---|
| Cryopreservation Medium | Preserves tissue viability and RNA integrity during sample freezing and storage. | DMEM + 30% FBS + 7.5% DMSO [22] |
| RNA Stabilization Buffer | Prevents RNA degradation during sample shipping and storage. | RNAprotect (Qiagen) [58] |
| Low-Input/FPPE RNA Extraction Kit | Isulates high-quality total RNA from minute or cross-linked tissue samples. | AllPrep Micro Kit (Qiagen), miRNeasy Mini Kit (Qiagen) [58] |
| rRNA Depletion Kit | Removes abundant ribosomal RNA, enriching for coding and non-coding RNA. Ideal for degraded samples. | TruSeq Ribo-Zero Gold (Illumina) [57] |
| RNA Exome Capture Kit | Enriches for exonic regions via probe-hybridization; optimal for FFPE and highly degraded RNA. | TruSeq RNA Access (Illumina) [57] [58] |
| Whole Transcriptome Amplification Kit | Enables library prep from ultra-low input (<1 ng) and single cells via template-switching. | SMARTer Stranded Total RNA-Seq Kit (Takara Bio) [59] |
| Automated Liquid Handling System | Standardizes and miniaturizes library prep reactions, improving reproducibility for low-volume reagents. | Hamilton STAR Platform [58] |
Successful transcriptomic profiling of clinical endometrial biopsies hinges on selecting a library preparation method that is robust to the challenges of low input and RNA degradation. As demonstrated, ribosomal RNA depletion excels with moderately degraded samples and very low inputs, while exome capture is the most reliable method for highly degraded FFPE material. By integrating the optimized wet-lab protocols, rigorous bioinformatic QC, and endometrial-specific analytical frameworks outlined in this Application Note, researchers can unlock high-quality genomic data from even the most challenging clinical samples, thereby advancing our understanding of endometrial biology and associated pathologies.
Managing Batch Effects and Technical Variability in Multi-Cohort Studies
Batch effects are notoriously common technical variations in omics data that are unrelated to study objectives. These systematic non-biological differences can arise from variations in experimental conditions over time, using data from different labs or machines, or employing different analysis pipelines [62]. In the specific context of RNA-seq studies on endometrial biopsies, where detecting subtle transcriptomic signatures is critical for assessing endometrial receptivity, batch effects can introduce noise that dilutes biological signals, reduces statistical power, or even results in misleading, biased, or non-reproducible results [62]. The challenges are magnified in multi-cohort studies that combine data from different clinical centers or sequencing batches, where batch effects can be on a similar scale or even larger than the biological differences of interest, such as those between receptive and non-receptive endometrium [63].
Profound Negative Impact
Batch effects can have profound negative impacts on research outcomes. In benign cases, they increase variability and decrease power to detect real biological signals. When batch effects correlate with biological outcomes, they can lead to incorrect conclusions [62]. For instance, in clinical research, a change in RNA-extraction solution resulted in a shift in gene-based risk calculations, leading to incorrect classification outcomes for 162 patients, 28 of whom received incorrect or unnecessary chemotherapy regimens [62]. Batch effects are also a paramount factor contributing to the reproducibility crisis in science, potentially resulting in retracted articles, discredited research findings, and financial losses [62].
The occurrence of batch effects can be traced back to diverse origins emerging at every step of a high-throughput study:
- Study Design: Flawed or confounded study design is a critical source of cross-study irreproducibility [62]. This occurs if endometrial biopsy samples are not collected in a randomized manner or if they are selected based on specific characteristics like patient age, infertility diagnosis, or hormonal status, leading to systematic differences between batches.
- Sample Preparation and Storage: Variables in sample collection, preparation, and storage may introduce technical variations [62]. For endometrial biopsies, factors including biopsy collection technique, time from collection to preservation, storage duration, and RNA stabilization methods can significantly impact transcriptomic profiles.
- Technical Variations: In RNA-seq data, batch effects can arise from differences in RNA extraction kits, library preparation protocols, sequencing platforms, sequencing depth, and personnel performing the experiments [63]. Single-cell RNA-seq methods, which have lower RNA input and higher dropout rates than bulk RNA-seq, suffer from even higher technical variations [62].
Batch Effect Correction Strategies
Various computational strategies have been developed to mitigate batch effects in RNA-seq data. These include:
- Empirical Bayes Methods: ComBat employs an empirical Bayes framework to correct for both additive and multiplicative batch effects [63].
- Covariate Adjustment: Popular differential expression analysis packages such as edgeR and DESeq2 allow the inclusion of batch as a covariate in linear models to account for these effects [63].
- Negative Binomial Models: ComBat-seq extends ComBat by using a generalized linear model (GLM) with a negative binomial distribution, retaining the integer count data and demonstrating better statistical power than its predecessors [63].
- Machine Learning Methods: Recent approaches use machine learning to address batch effects by modeling discrepancies among batches [63].
- Reference-Based Correction: ComBat-ref employs a negative binomial model for count data adjustment but innovates by selecting a reference batch with the smallest dispersion, preserving count data for the reference batch, and adjusting other batches towards the reference batch [63].
Performance Comparison of Batch Effect Correction Methods
Table 1: Performance characteristics of different batch effect correction methods for RNA-seq data
| Method | Underlying Model | Key Features | Preserves Count Data | Best Use Cases |
|---|---|---|---|---|
| ComBat | Empirical Bayes | Adjusts for additive and multiplicative batch effects | No | Microarray data, normalized RNA-seq data |
| ComBat-seq | Negative Binomial GLM | Uses integer count data; good for downstream DE analysis | Yes | Standard multi-batch RNA-seq studies |
| ComBat-ref | Negative Binomial GLM | Selects reference batch with minimum dispersion; high sensitivity | Yes | Studies with batches of different dispersions |
| RUVSeq | Factor analysis | Removes unwanted variation from unknown sources | Yes | When control genes are available |
| NPMatch | Nearest-neighbor matching | Non-parametric approach | No | When distributional assumptions are violated |
Experimental Protocol: Implementing ComBat-ref for Endometrial RNA-seq Data
Preprocessing and Quality Control
- Raw Read Processing: Process raw RNA-seq reads through a standardized pipeline including adapter trimming, quality filtering, and read alignment to a reference genome.
- Feature Counting: Generate count matrices using aligned reads and gene annotation files.
- Initial QC Metrics: Calculate quality control metrics including total reads, mapping rates, gene detection rates, and sample-level clustering to identify potential batch effects.
- Data Filtering: Filter out low-expression genes (e.g., those with less than 1 count per million in at least 37 samples, following approaches used in endometrial receptivity studies [5]).
Batch Effect Diagnostics
- Exploratory Data Analysis: Perform Principal Component Analysis (PCA) and visualize the first two principal components, coloring samples by batch and biological condition.
- Hierarchical Clustering: Conduct hierarchical clustering of samples using correlation distance to identify batch-driven clustering patterns.
- Statistical Tests: Use statistical tests such as PERMANOVA to quantify the variance explained by batch versus biological factors.
ComBat-ref Implementation
- Dispersion Estimation: For each batch, estimate batch-specific dispersion parameters using the GLM fit method implemented in edgeR [63].
- Reference Batch Selection: Select the batch with the smallest dispersion as the reference batch [63].
- Parameter Estimation: Estimate model parameters using the generalized linear model:
log(μ_ijg) = α_g + γ_ig + β_cjg + log(N_j)whereα_gis the global expression of gene g,γ_igis the effect of batch i,β_cjgis the effect of biological condition c, andN_jis the library size of sample j [63]. - Data Adjustment: Adjust count data from non-reference batches to align with the reference batch using cumulative distribution function matching [63].
- Validation: Validate correction effectiveness through PCA and visualization of batch effect mitigation.
Experimental Workflow for Batch Effect Management
Application to Endometrial Receptivity Research
Case Study: Transcriptomic Analysis of Endometrial Receptivity
In a recent study on endometrial receptivity through transcriptomic analysis of uterine fluid extracellular vesicles, researchers analyzed RNA-seq data from 82 women undergoing assisted reproductive technology with single euploid blastocyst transfer [5]. The study identified 966 differentially expressed genes between women who achieved pregnancy and those who did not. To ensure these findings reflected true biological differences rather than technical variations, careful management of batch effects was essential [5]. The researchers employed Weighted Gene Co-expression Network Analysis (WGCNA) which clustered the differentially expressed genes into four functionally relevant modules, and notably, among the analyzed traits, only pregnancy outcome exhibited significant module-trait associations, while no strong or statistically significant correlations were detected for batch, demonstrating successful management of technical variability [5].
Integration with Multi-Omics Approaches
With the advancement of multi-omics profiling, which integrates transcriptomics, proteomics, and metabolomics data, batch effects become more complex because they involve multiple data types measured on different platforms with different distributions and scales [62]. For comprehensive endometrial receptivity assessment, integrating transcriptomic data from RNA-seq with proteomic profiles from endometrial fluid adds valuable layers of information but introduces additional batch effect challenges that require specialized correction approaches [62].
Quantitative Assessment of Batch Effect Impact
Table 2: Statistical power and false positive rates (FPR) of different batch effect correction methods under varying batch effect strengths
| Method | No Batch Effects (TPR/FPR) | Moderate Batch Effects (TPR/FPR) | Strong Batch Effects (TPR/FPR) |
|---|---|---|---|
| No Correction | 92%/5% | 45%/22% | 18%/35% |
| ComBat-seq | 90%/5% | 78%/8% | 52%/12% |
| ComBat-ref | 91%/5% | 85%/6% | 79%/7% |
| NPMatch | 88%/6% | 72%/23% | 45%/28% |
Data adapted from performance comparisons in [63]. TPR: True Positive Rate; FPR: False Positive Rate.
The Scientist's Toolkit: Essential Research Reagents and Materials
Key Research Reagent Solutions
Table 3: Essential materials and reagents for endometrial biopsy RNA-seq studies with batch effect management
| Reagent/Material | Function | Batch Effect Considerations |
|---|---|---|
| RNA Stabilization Reagents | Preserve RNA integrity immediately post-biopsy | Use same manufacturer and lot across study; avoid lot-to-lot variability |
| RNA Extraction Kits | Isolate high-quality RNA from endometrial tissue | Standardize kit lot and protocol across all samples; document any lot changes |
| Library Prep Kits | Prepare sequencing libraries from RNA | Use same kit version and lot for all samples; record lot numbers |
| Quality Control Assays | Assess RNA quality (RIN) and quantity | Perform all QC assays using same instruments and reagent lots |
| Sequencing Platforms | Generate transcriptome data | Balance biological groups across sequencing lanes and flow cells |
| Reference RNA Samples | Quality control and normalization | Use identical reference materials across batches for calibration |
Validation and Quality Assurance Protocol
Post-Correction Validation Steps
- Visual Inspection: Generate PCA plots post-correction to confirm batch mixing.
- Statistical Validation: Use statistical tests to confirm reduction in batch-associated variance.
- Biological Preservation: Verify that known biological signals (e.g., endometrial receptivity markers) remain strong after correction.
- Negative Controls: Confirm that negative control samples cluster appropriately after correction.
Quality Assessment Framework
Adapting quality assessment frameworks from established guidelines, such as those used for cohort studies [64], ensures rigorous evaluation of batch effect correction success. Key assessment criteria include:
- Representativeness of Samples: Ensure samples across batches are representative of the study population.
- Ascertainment of Exposure: Precisely document technical variables and batch metadata.
- Adjustment for Confounding: Account for potential confounders in the study design and analysis.
- Assessment of Outcome: Implement blinded outcome assessment where feasible.
Effective management of batch effects and technical variability is crucial for generating reliable, reproducible results in multi-cohort RNA-seq studies of endometrial biopsies. By implementing robust experimental designs, careful documentation of batch metadata, and appropriate computational corrections such as ComBat-ref, researchers can mitigate the risks posed by technical variability while preserving biological signals of interest. This approach is particularly important in endometrial receptivity research, where detecting subtle transcriptomic changes can significantly impact clinical outcomes in assisted reproductive technology.
Data Normalization Strategies for Highly Variable Cyclic Gene Expression
Within the context of developing an RNA-seq protocol for endometrial biopsy analysis, addressing highly variable cyclic gene expression presents a unique challenge. In endometrial receptivity research, transcriptomic profiling of uterine fluid extracellular vesicles (UF-EVs) has revealed significant gene expression differences between patients who achieve pregnancy and those who do not, underscoring the critical need for precise normalization to distinguish true biological signal from technical artifacts [5]. Single-cell RNA sequencing (scRNA-seq) data are characterized by high technical variability, sparsity, and an abundance of zero counts, features that complicate the analysis of cyclic expression patterns [65] [66]. Normalization, a critical step in the analysis pipeline, adjusts for unwanted technical effects, enabling accurate comparison of gene expression within and between cells [65]. When analyzing cyclic processes such as the endometrial cycle, where timing is crucial for identifying the Window of Implantation (WOI), appropriate normalization strategies become paramount for reliable biological interpretation [5].
Challenges in Normalizing Cyclic Expression Data
The analysis of scRNA-seq datasets involves addressing several sources of variability. Biological variability in cyclic processes is compounded by technical noise introduced during library preparation, including stochastic sampling during sequencing, differences in sequencing depth, reverse transcription efficiency, and amplification biases [65] [66]. A prominent feature of scRNA-seq data is sparsity, or zero inflation, which arises from both biological reasons (e.g., genes not expressed in certain cell cycle phases) and technical reasons (e.g., "dropouts" where expressed genes go undetected) [65]. Global-scaling normalization methods, the most common approach, assume the expected read count for a gene in a cell is proportional to a gene-specific expression level and a cell-specific scaling factor (size factor) representing nuisance technical effects [65]. However, these methods can be adversely affected by the high variability and dropout rates typical of scRNA-seq, potentially leading to misleading results in downstream analyses such as highly variable gene detection and clustering [65].
Normalization Methodologies
Global-Scaling Normalization
Global-scaling methods adjust expression counts based on cell-specific size factors, aiming to make expression counts comparable across cells.
Protocol: LogNormalize in Seurat
- Principle: Normalizes gene expression for each cell by total expression, multiplies by a scale factor, and log-transforms the result.
- Procedure:
- Calculate total expression per cell: Sum counts across all genes for each cell.
- Divide counts by cell total: Each gene count is divided by its cell's total count, obtaining normalized frequencies.
- Multiply by scale factor: Multiply normalized frequencies by a scale factor (default: 10,000).
- Log-transform: Apply natural log transformation using
log1p(log(1+x)) [67].
- Code Implementation:
Generalized Linear Models (GLMs)
GLM-based methods model count data directly, using the cell-specific size factors as offsets in a regression framework to account for technical variability.
Protocol: scran Pooling-Based Size Factors
- Principle: Computes size factors by pooling cells, deconvoluting pool-based factors to cell-specific factors, improving accuracy in heterogeneous populations.
- Procedure:
- Cell Pooling: Pool cells into groups, summing expression counts for each pool.
- Size Factor Calculation: Compute a size factor for each pool against a reference pseudo-cell.
- Deconvolution: Deconvolve pool-based factors to cell-specific size factors using linear equations.
- Normalization: Use deconvolved size factors to normalize raw counts [66].
Mixed and Machine Learning-Based Methods
These advanced approaches integrate multiple normalization strategies or leverage machine learning to model complex technical effects.
Protocol: Combat for Batch Effect Correction
- Principle: Uses empirical Bayes frameworks to adjust for batch effects while preserving biological signal, crucial for multi-experiment cyclic studies.
- Procedure:
- Model Specification: Define a linear model including batch as a covariate.
- Parameter Estimation: Estimate batch-effect parameters (mean and variance) using an empirical Bayes approach.
- Data Adjustment: Adjust expression data by removing estimated batch effects.
- Integration: Apply prior to and scale data to retain biological variability [66].
Table 1: Comparison of scRNA-seq Normalization Methods
| Method Category | Example Algorithm | Mathematical Principle | Handles Cyclic Data | Key Advantage | Key Limitation |
|---|---|---|---|---|---|
| Global Scaling | LogNormalize [67] | Linear scaling by size factor + log transform | Moderate | Simple, fast, widely used | Assumes most genes not differentially expressed |
| Generalized Linear Models | scran [66] | Pooling & deconvolution for robust size factors | Good | Robust to cell heterogeneity | Computationally intensive |
| Mixed Methods | SCnorm [66] | Quantile regression for estimating scaling factors | Good | Models count-depth relationship | Requires sufficient cells per group |
| Machine Learning | DCA [66] | Autoencoder-based denoising | Potentially High | Explicitly models dropouts | Complex, "black box" interpretations |
Application to Endometrial Receptivity Analysis
In endometrial receptivity research, transcriptomic analysis of UF-EVs during the Window of Implantation (WOI) has identified 966 differentially expressed genes between pregnant and non-pregnant patients after single euploid blastocyst transfer [5]. Weighted Gene Co-expression Network Analysis (WGCNA) of these genes revealed four functionally relevant modules correlated with pregnancy outcome, implicating key biological processes such as adaptive immune response, ion homeostasis, and transmembrane signaling receptor activity [5]. Normalization is critical in such studies to ensure that technical variations in mRNA capture efficiency, amplification, and sequencing depth do not obscure these biologically significant expression patterns. For cyclic processes like the endometrial cycle, where transcriptional repression is relaxed during the WOI to facilitate receptivity, normalization must carefully separate these meaningful temporal fluctuations from technical noise [5].
Research Reagent Solutions
Table 2: Essential Research Reagents and Materials
| Reagent/Material | Function in scRNA-seq Normalization | Application Context |
|---|---|---|
| Unique Molecular Identifiers (UMIs) | Corrects for PCR amplification biases by tagging individual mRNA molecules [66] | Molecular counting in droplet-based protocols (10X Genomics, Drop-Seq) |
| Spike-in RNAs (e.g., ERCC) | Creates standard baseline for counting and normalization by adding known quantities of exogenous transcripts [66] | Controls for technical variability in full-length protocols; requires platform compatibility |
| Cell Barcodes | Enables multiplexing of samples and cell-specific identification during sequencing [66] | Tracking individual cells across experimental conditions and cycles |
| Poly(T) Oligonucleotides | Captures poly(A)-tailed mRNA for reverse transcription into cDNA [66] | Standard mRNA enrichment in most scRNA-seq protocols |
Experimental Workflow and Signaling Pathways
The following diagram illustrates the comprehensive experimental and computational workflow for normalizing cyclic gene expression data, from sample preparation through biological interpretation:
Normalization Workflow for Cyclic Gene Expression Analysis
The normalization process addresses multiple technical factors that impact data quality. The following diagram details the specific technical variability sources that normalization methods must account for:
Technical Variability Sources and Normalization Approaches
Performance Evaluation Metrics
After normalization, evaluating performance ensures the method effectively reduces technical noise while preserving biological signal, particularly important for cyclic processes.
Protocol: Evaluating Normalization Performance
- Silhouette Width: Measures cluster separation and cohesion after normalization. Higher values indicate better preservation of biological heterogeneity [66].
- K-Nearest Neighbor Batch-Effect Test (kBET): Quantifies batch effect removal by testing whether local cell neighborhoods match the global batch distribution [66].
- Highly Variable Genes (HVG) Detection: Assesses biological signal preservation by identifying genes with higher variability than expected by technical noise [67].
- Differential Expression Analysis: Evaluates normalization impact on identifying biologically relevant DE genes, such as those distinguishing receptive vs. non-receptive endometrium [5].
Normalization of highly variable cyclic gene expression data requires careful consideration of both technical artifacts and biological characteristics. In endometrial receptivity research, where precise timing of the Window of Implantation is crucial, appropriate normalization enables accurate identification of differentially expressed genes and co-expression networks predictive of pregnancy outcomes [5]. While global-scaling methods like LogNormalize provide a straightforward approach for standard workflows, more sophisticated GLM or mixed methods may be necessary for heterogeneous cyclic data. The selection of normalization strategy should be guided by performance metrics evaluating both technical noise reduction and biological signal preservation, ultimately ensuring that cyclic expression patterns driving endometrial receptivity can be reliably distinguished from technical variability.
Navigating Ethical and Practical Constraints in Human Endometrial Research
Human endometrial research is fundamental to understanding a range of physiological processes and pathological conditions, from uterine receptivity and pregnancy to endometriosis, adenomyosis, and heavy menstrual bleeding. These disorders affect nearly all women at some stage in their lives, placing a significant burden on healthcare systems [56]. However, research into the endometrium faces unique and profound methodological challenges that complicate sample analysis and data interpretation. The core constraints can be categorized into biological variability and ethical considerations, both of which must be navigated to produce valid, reproducible scientific results. This document outlines these constraints within the context of a broader RNA-sequencing (RNA-seq) protocol, providing frameworks and practical solutions for researchers.
Practical Constraints: Biological Variability and Staging
The Problem of Menstrual Cycle Variability
The most significant practical challenge in endometrial research is the tissue's inherent biological variability. Unlike most somatic tissues, the endometrium undergoes dramatic, cyclical changes in gene expression driven by fluctuating levels of estrogen and progesterone [56].
Key Aspects of Variability:
- Cycle Length: In a study of over 30,000 women, only 12.4% had a classic 28-day cycle. Most cycle lengths varied between 23 and 35 days, with over half of women experiencing variations of 5 days or more between cycles [56].
- Ovulation Timing: There is a 10-day spread in ovulation days even for cycles of the same length, with the most common day of ovulation being day 15 [56].
- Phase Length: A large study of 612,613 ovulatory cycles reported a mean follicular phase length of 16.9 days (95% CI: 10–30) and a mean luteal phase length of 12.4 days (95% CI: 7–17) [56].
- Age Effects: Age consistently shortens the average cycle length by about 3 days between the ages of 25 and 45 [56].
Table 1: Summary of Menstrual Cycle Variability Factors
| Variability Factor | Key Statistic | Impact on Research |
|---|---|---|
| Cycle Length | Only 12.4% of women have a 28-day cycle [56] | Difficult to align sample collection days across a cohort |
| Ovulation Day | 10-day spread for a 28-day cycle [56] | Adds noise to presumed post-ovulatory timing |
| Luteal Phase Length | Mean 12.4 days (95% CI: 7-17) [56] | High variability in the window of receptivity |
| Age Effect | Cycle shortens by ~3 days from age 25 to 45 [56] | Confounding factor in study design |
Limitations of Current Staging Methods
Accurately determining the endometrial cycle stage is critical for comparing samples, yet all current methods have limitations [56]:
- Last Menstrual Period (LMP): Provides a single fixed point but is of limited use for comparing cycles of variable length.
- Endocrine Methods: Measuring LH surge or serum estrogen/progesterone is indirect and does not account for variability in endometrial tissue response.
- Ultrasound: Detecting follicle size or ovulation does not obligatorily correlate with endometrial development.
- Histopathology: While direct, this method is subjective and exhibits significant inter-observer variability, even among expert pathologists [56].
The rapidly changing gene expression profile within a highly variable menstrual cycle has made accurate comparisons between matched samples difficult, contributing to the frequent failure of studies attempting to link endometrial gene expression to pathologies like endometriosis to replicate findings [56].
Molecular Staging Model: A Solution to Biological Variability
Model Development and Validation
A transformative solution to the problem of cycle variability is the development of a 'molecular staging model' that precisely determines endometrial cycle stage based on global gene expression patterns [56]. This approach reveals significant and remarkably synchronized daily changes in expression for over 3,400 endometrial genes throughout the cycle, with the most dramatic changes occurring during the secretory phase [56].
Protocol: Molecular Staging of Endometrial Samples
Prerequisite: RNA-seq data from endometrial biopsy samples.
Workflow Description: This protocol uses a global gene expression pattern to accurately date endometrial biopsies, overcoming the limitations of histological dating and variable cycle lengths.
Methodology Details:
- Spline Fitting: Fit penalized cubic regression splines to RNA-seq expression data for each gene across a training set of samples with reliable cycle stage (e.g., where multiple pathology reports agree within 2 post-ovulatory days) [56].
- Cycle Time Estimation: For each new endometrial sample, estimate the post-ovulatory day by identifying the day that minimizes the Mean Squared Error (MSE) between the observed expression and the expected expression across all genes [56].
- Model Application: The model can utilize either precise pathology estimates (e.g., 14 post-ovulatory days) or broader pathology-assigned stages (early-, mid-, late-secretory) with high correlation between approaches (r = 0.9807) [56].
- Whole-Cycle Modeling: For proliferative phase samples, which are often not well-subclassified, gene expression data can be used to re-assign samples into early, mid, and late proliferative stages by fitting a penalized cubic regression spline [56].
- Time Transformation: Under the assumption that women are uniformly distributed across the menstrual cycle, samples can be ranked in order from start to end, transforming the x-axis to represent the percentage of the way through the menstrual cycle, thereby removing the need for an idealised 28-day cycle [56].
Utility of the Molecular Staging Model
This molecular staging approach significantly extends existing data on the endometrial transcriptome and enables several advanced applications [56]:
- Identification of differentially expressed endometrial genes associated with increasing age and different ethnicities.
- Reinterpretation of all previously published endometrial RNA-seq and microarray data with a standardized timeline.
- Advancement of understanding of endometrial-related disorders by providing a precise method for normalizing gene expression across the menstrual cycle.
Ethical and Protocol Considerations for Tissue Acquisition
Ethical conduct in human tissue research is paramount. The following guidelines and protocols are based on established ethical frameworks and current research practices.
Ethical Framework and Informed Consent
The National Statement on Ethical Conduct in Human Research (2025) provides the foundational guidelines for research involving human participants in Australia, with an effective date in early 2026 [68]. While specific jurisdictional regulations may vary, the core principles are universally applicable.
Protocol: Ethical Tissue Collection and Participant Consent
Workflow Description: This protocol ensures the ethical procurement of human endometrial tissue for research, prioritizing participant welfare, autonomy, and privacy throughout the process.
Key Ethical and Practical Steps:
- Eligibility and Recruitment: Participants are typically identified from women scheduled for diagnostic laparoscopy for suspected endometriosis, with the primary symptom being pelvic pain [56] [69]. The study's purpose and design must be discussed directly with the patient by a research nurse or treating physician at the initial consultation [69].
- Informed Consent: Participants must be provided with a detailed Participant Information Sheet and Consent Form outlining the study procedures. Consent must be given voluntarily and without coercion after ample opportunity for questions [69].
- Data Collection: Comprehensive patient information should be collected via secure online questionnaires prior to surgery and at follow-up intervals (e.g., 6 and 12 months post-surgery) [69]. Treating physicians should document detailed surgical findings.
- Tight Coupling: Ensure that patient questionnaire responses are carefully worded to correspond to specific episodes of endometriosis and that the tissue collected is directly linked to this clinical data [69].
- Tissue Collection: During surgery, collect multiple sample types, typically including blood, peritoneal fluid, eutopic endometrium, and endometriotic tissue [69]. Adherence to harmonized World Endometriosis Research Foundation protocols is recommended for standardization [69].
- Data and Sample Security: Collected tissues and data must be processed and stored in secure, access-controlled facilities [69]. Data should be anonymized to protect participant privacy.
Integration with Single-Cell Atlas Projects
Large-scale projects like the Human Endometrial Cell Atlas (HECA) provide a valuable ethical and practical resource. HECA is a high-resolution single-cell reference atlas integrating data from 313,527 cells from 63 women, with and without endometriosis [52]. Utilizing such shared public resources can:
- Reduce the need for duplicate tissue collection.
- Provide a robust consensus for cell type identification and annotation.
- Allow researchers to map and contextualize new data against a established reference, increasing the utility of each newly collected sample [52].
Essential Research Reagents and Materials
Table 2: Key Research Reagent Solutions for Endometrial RNA-seq Studies
| Reagent / Material | Function / Application | Specifications / Notes |
|---|---|---|
| Endometrial Biopsy | Source of RNA and primary cells. | Superficial biopsy samples functionalis; full-thickness needed for basalis [52]. |
| RNA Stabilization Solution | Preserves RNA integrity post-collection. | Critical for accurate transcriptomic representation. |
| Single-Cell Dissociation Kit | Tissue digestion for scRNA-seq. | Protocol choice significantly impacts cell type recovery [52]. |
| scRNA-seq Platform | High-resolution transcriptomic profiling. | e.g., 10x Genomics; enables HECA construction [52]. |
| Spatial Transcriptomics | Mapping gene expression in situ. | Validates cell type location (e.g., basalis vs. functionalis) [52]. |
| Cell Culture Reagents | Propagating in vitro models. | For isolation of epithelial/stromal cells; underpinned by genetic data [69]. |
| HECA Reference Atlas | Consensus cell state annotation. | Integrated atlas of 313,527 cells for data mapping and validation [52]. |
| Molecular Staging Model | Normalizes samples by cycle stage. | Uses >3,400 genes; overcomes histological dating limitations [56]. |
Navigating the ethical and practical constraints in human endometrial research requires a meticulous and standardized approach. The inherent variability of the menstrual cycle can be effectively managed through molecular staging models based on global gene expression patterns, which provide a more objective and precise metric for sample comparison than traditional methods. Ethically robust protocols for tissue acquisition, coupled with the use of shared resources like the Human Endometrial Cell Atlas, ensure that research is conducted responsibly and efficiently. By integrating these solutions into RNA-seq protocols for endometrial biopsy analysis, researchers can enhance the reproducibility, validity, and impact of their work, ultimately advancing our understanding of endometrial biology and pathology.
Validating Findings and Comparing Transcriptomic Tools
Benchmarking RNA-seq Against Histology, Pinopode Assessment, and Molecular Staging
Embryo implantation remains a significant hurdle in assisted reproductive technology (ART), with unsuccessful implantation accounting for over 50% of in vitro fertilization (IVF) cycle failures [4]. Successful implantation requires a synchronized dialog between a competent embryo and a receptive endometrium during a brief period known as the window of implantation (WOI) [70]. Displaced WOI is recognized as a leading endometrial cause of implantation failure, particularly in patients with recurrent implantation failure (RIF), with studies reporting prevalence rates of 25-50% in this population [4].
Accurate assessment of endometrial receptivity is therefore crucial for optimizing implantation success. Traditional evaluation methods have relied on histopathological dating and the assessment of morphological markers such as pinopodes [70] [71]. However, the emergence of transcriptomic technologies, particularly RNA sequencing (RNA-seq), has revolutionized endometrial receptivity assessment by enabling molecular staging of the endometrium [70] [4].
This application note provides a comprehensive benchmarking analysis comparing RNA-seq-based endometrial receptivity testing against traditional histology and pinopode assessment, with detailed protocols for implementation in reproductive research and clinical diagnostics.
Comparative Performance of Endometrial Receptivity Assessment Methods
Diagnostic Concordance and Clinical Outcomes
Recent comparative studies reveal significant discrepancies between RNA-seq-based endometrial receptivity tests (rsERT) and pinopode assessment in diagnosing WOI displacement. The table below summarizes key findings from direct comparison studies.
Table 1: Diagnostic concordance between RNA-seq and pinopode assessment for WOI detection
| Assessment Method | Patients with Normal WOI | Most Common Displacement | Clinical Pregnancy Rate Post-pET | Reference |
|---|---|---|---|---|
| RNA-seq (rsERT) | 65.31% (32/49 patients) | Advancement (30.61%) | 50.00% | [70] |
| Pinopode Assessment | 28.57% (14/49 patients) | Delay (63.27%) | 16.67% | [70] |
A 2025 comparative analysis of endometrial gland imaging and pinopode detection further demonstrated that both methods can effectively predict pregnancy outcomes, with significantly higher endometrial gland density and pinopode maturity observed in pregnancy versus non-pregnancy groups [72].
Technical Comparison of Assessment Methodologies
The fundamental differences in what each method measures account for the observed discrepancies in diagnostic outcomes.
Table 2: Technical comparison of endometrial receptivity assessment methodologies
| Parameter | RNA-seq Testing | Pinopode Assessment | Histological Dating |
|---|---|---|---|
| Basis of Assessment | Transcriptomic profiling of 175+ receptivity genes [4] | Scanning electron microscopy of surface structures [70] | Cellular morphology and tissue organization [4] |
| Primary Output | Molecular signature and receptivity status [70] | Pinopode development stage and coverage rate [72] | Chronological dating based on standardized criteria [4] |
| Temporal Resolution | Precise identification of WOI based on gene expression patterns [70] | 24-48 hour window during mid-secretory phase [71] | Limited to specific days of menstrual cycle [4] |
| Quantification Approach | Machine learning algorithm analysis of gene expression [4] | Visual counting and morphological staging [72] | Microscopic evaluation of tissue characteristics [4] |
| Key Limitations | Higher cost, requires specialized bioinformatics [4] | Subjective interpretation, sampling variability [70] | Poor reproducibility, questioned accuracy [4] |
Experimental Protocols
RNA-seq Based Endometrial Receptivity Testing (rsERT)
Endometrial Tissue Collection and Preparation
- Patient Preparation: For ovulatory patients, initiate ultrasound monitoring from day 10 of the menstrual cycle. Administer 5000U HCG when dominant follicle reaches 20mm diameter. Schedule biopsy 5, 7, and 9 days after LH surge (LH+5/+7/+9) [70] [72].
- Anovulatory Patients Protocol: Use hormone replacement treatment (HRT) starting with estradiol on day 3 of menstrual cycle. Add progesterone after at least 12 days if endometrium >7mm. Perform biopsies 3, 5, and 7 days after progesterone supplementation (P+3/+5/+7) [70].
- Biopsy Procedure: Obtain endometrial biopsies using endometrial sampler (AiMu Medical Science & Technology Co.). Rinse specimens in saline and divide evenly [70].
- RNA Preservation: Store tissue samples in RNA-later buffer (AM7020; Thermo Fisher Scientific) at -80°C until processing [70].
RNA Extraction and Library Preparation
- RNA Extraction: Extract total RNA using TRIzol Reagent following manufacturer's instructions. Assess RNA quality using 4200 TapeStation (Agilent Technologies) or similar system. Include only high-quality RNA samples (OD260/280 = 1.8-2.2, OD260/230 ≥ 2.0, RIN ≥ 6.5, 28S:18S ≥ 1.0, >1 µg) for library construction [37] [54].
- Library Preparation: Isolate mRNA from total RNA using NEBNext Poly(A) mRNA magnetic isolation kits (New England BioLabs). Prepare cDNA libraries using NEBNext Ultra DNA Library Prep Kit for Illumina. Sequence libraries on Illumina platform (e.g., NextSeq 500) using 75-cycle single-end high-output sequencing kit [54].
Bioinformatics and Data Analysis
- Read Processing: Demultiplex reads (bcl2fastq) and align fastq files to reference genome (TopHat2) [54].
- Gene Mapping: Map aligned reads to genes using HTSeq with Ensembl gene annotation [54].
- Normalization Considerations: For heterogeneous tissue data, implement tissue-aware normalization approaches such as YARN (Yet Another RNA Normalization) to account for sparse data and batch effects [73].
- Receptivity Classification: Apply machine learning algorithm analyzing expression of 175 predictive genes to determine endometrial receptivity status and WOI timing [4].
Pinopode Assessment Protocol
Tissue Collection and Processing
- Sample Collection: Obtain endometrial biopsies during the mid-secretory phase (3-5 days post-ovulation) using same timing protocol as RNA-seq biopsy [72].
- Tissue Fixation: Immediately fix specimens in 2.5% glutaraldehyde solution in PBS (pH 7.2-7.4) at 4°C for minimum 48 hours. Use fixative volume at least 10 times the tissue volume [70] [72].
- Sample Processing: Rinse fixed tissues twice with PBS buffer. Dehydrate through series of ethanol concentrations (50%, 70%, 80%, 95%, 100%) [70].
- Critical Point Drying: Dry samples in critical point drier using carbon dioxide. Coat with palladium gold before SEM examination [70].
Scanning Electron Microscopy and Evaluation
- SEM Imaging: Use scanning electron microscope (e.g., HITACHI SU8010) at 2,000-3,000x magnification [70] [72].
- Image Acquisition: Randomly select 8-10 fields at 2,000x magnification for each sample [70] [72].
- Pinopode Staging: Classify pinopodes according to developmental stages:
- Quantitative Assessment: Calculate pinopode coverage rate as percentage of area covered by pinopodes relative to total endometrial area. Score coverage: 0 (0%), 1 (≤20%), 2 (21-50%), 3 (>50%) [72].
Integrated Protocol for Comparative Studies
For research benchmarking RNA-seq against traditional methods, an integrated sampling protocol maximizes comparability:
- Simultaneous Biopsy Collection: Obtain three consecutive endometrial biopsies during same menstrual cycle from same patient, avoiding repeated sampling from same uterine wall [70].
- Sample Division: Divide each biopsy specimen evenly - one portion for RNA-seq analysis (preserved in RNA-later) and one for pinopode assessment (fixed in glutaraldehyde) [70].
- Synchronized Timing: Perform all biopsies during estimated implantation window (LH+5/+7/+9 for natural cycles; P+3/+5/+7 for HRT cycles) [70].
- Blinded Analysis: Process and evaluate RNA-seq and pinopode samples independently by different investigators blinded to the other method's results [70].
Visualization and Data Analysis
Analytical Pipeline for RNA-seq Data
RNA-seq data analysis requires specialized bioinformatics approaches to ensure accurate interpretation:
Spatially Resolved Transcriptomics Integration
Advanced applications can incorporate spatially resolved transcriptomics (SRT) to correlate gene expression with histological context:
- Spatial Clustering: Identify transcriptionally distinct regions within endometrial tissue sections [74].
- Cell-Type Deconvolution: Estimate proportions of different cell types from bulk RNA-seq data [74].
- Spatially Variable Genes: Detect genes with expression patterns that correlate with spatial location [74].
- Histology Integration: Combine gene expression data with high-resolution histology images from adjacent sections [74].
Research Reagent Solutions
Table 3: Essential research reagents and materials for endometrial receptivity studies
| Category | Specific Product/Kit | Manufacturer | Application Note |
|---|---|---|---|
| RNA Stabilization | RNA-later Buffer | Thermo Fisher Scientific (AM7020) | Preserves RNA integrity during tissue storage and transport [70] |
| RNA Extraction | TRIzol Reagent | Thermo Fisher Scientific | Effective for total RNA isolation from endometrial tissue [37] |
| RNA Quality Assessment | 4200 TapeStation | Agilent Technologies | Determines RNA Integrity Number (RIN) for QC [54] |
| Library Preparation | NEBNext Ultra DNA Library Prep Kit | New England BioLabs | Compatible with Illumina sequencing platforms [54] |
| Poly(A) Selection | NEBNext Poly(A) mRNA Magnetic Isolation Kit | New England BioLabs | Enriches for mRNA by selecting polyadenylated transcripts [54] |
| SEM Fixation | Glutaraldehyde 2.5% Solution | Various Suppliers | Essential for ultrastructural preservation for pinopode analysis [70] [72] |
| Immunohistochemistry | CD38, CD138 Antibodies | Abcam | Identifies inflammatory markers in endometrial tissue [37] |
| Bioinformatics | YARN Package | Bioconductor | Normalizes heterogeneous RNA-seq data accounting for tissue effects [73] |
RNA-seq-based endometrial receptivity testing demonstrates superior performance compared to traditional pinopode assessment and histological dating for identifying the window of implantation in patients with recurrent implantation failure. The 65.31% concordance with normal WOI diagnosis using rsERT versus 28.57% with pinopode assessment, coupled with significantly higher pregnancy rates following personalized embryo transfer (50.00% vs. 16.67%), supports the integration of molecular staging into clinical practice [70].
The comprehensive protocols provided herein enable researchers to implement these technologies in both basic research and clinical translation settings. Future directions should focus on standardizing analytical pipelines, reducing costs through streamlined targeted sequencing approaches, and integrating multi-omics data for even more precise endometrial receptivity assessment.
Application Note: Validation of Housekeeping Genes for RT-qPCR in Endometrial Cancer Research
Accurate normalization is critical for reliable gene expression analysis using RT-qPCR. This application note provides guidelines for selecting and validating housekeeping genes (HKGs) in endometrial biopsy analyses, particularly within the context of RNA-seq protocol validation.
The Challenge of HKG Selection
Housekeeping genes are constitutively expressed internal controls used to normalize mRNA levels between samples, correcting for variations in cellular input, RNA quality, and reverse transcription efficiency [75]. The fundamental assumption is that HKGs demonstrate inherent stability across all sample conditions. However, it is now widely recognized that commonly used HKGs can exhibit significant expression variability, particularly in disease states such as cancer [75].
Critique of Commonly Misused HKGs
Traditional HKGs like Glyceraldehyde-3-phosphate dehydrogenase (GAPDH), β-actin (ACTB), and 18S ribosomal RNA (18S rRNA) are often unsuitable for endometrial cancer research [75]. The table below summarizes key limitations:
Table 1: Limitations of Traditional Housekeeping Genes in Endometrial Studies
| Gene | Primary Function | Documented Limitations in Endometrial/ Cancer Research |
|---|---|---|
| GAPDH | Glycolytic enzyme | A pan-cancer marker; expression is induced by insulin, growth hormone, oxidative stress, and apoptosis; overexpressed in EC [75]. |
| ACTB | Cytoskeletal protein | Transcription levels vary widely in response to experimental manipulation; primers may amplify genomic DNA [75]. |
| 18S rRNA | Ribosomal component | An excessively abundant transcript, making it unreliable for quantitative or semi-quantitative PCR normalization [75]. |
Evidence strongly discourages the use of GAPDH for normalizing RNA levels in endometrial studies, as its expression is not stable and it may play direct oncogenic roles [75].
Recommended HKG Validation Protocol
To ensure robust RT-qPCR data, the following workflow and protocol for HKG validation are recommended.
Protocol 1: Validation of Housekeeping Genes for RT-qPCR
Objective: To identify the most stable housekeeping genes for RT-qPCR normalization in endometrial biopsy samples.
Materials:
- Total RNA from endometrial biopsies (normal and neoplastic)
- Reverse transcription kit
- qPCR reagents (SYBR Green or TaqMan)
- Primers for candidate HKGs (e.g., B2M, TBP, RPLPO)
Method:
- Candidate HKG Selection: Select at least 3-5 candidate HKGs from literature or RNA-seq data. Do not rely solely on GAPDH, ACTB, or 18S rRNA [75].
- RNA Extraction and Quality Control: Extract total RNA using a silica-membrane kit. Assess RNA integrity and purity.
- cDNA Synthesis: Synthesize cDNA from a fixed amount of RNA (e.g., 1 µg) using a reverse transcription kit.
- RT-qPCR Amplification: Perform qPCR reactions for all candidate HKGs across all sample types and biological replicates.
- Data Analysis: Calculate the mean quantification cycle (Cq) for each gene.
- Stability Assessment: Analyze Cq values using specialized algorithms (e.g., NormFinder, geNorm) to rank genes by stability. The most stable genes should be selected for normalization [75].
Key Consideration: A combination of at least two validated HKGs is strongly recommended for accurate normalization of target gene expression in endometrial cancer studies [75].
Application Note: RNA-seq and IHC Correlation for Biomarker Assessment
Bridging transcriptomic data from RNA-seq with protein expression data from IHC is a critical step in the analytical validation of biomarkers. This note outlines a protocol for establishing correlative thresholds.
Joint Analytical Workflow
The following workflow integrates RNA-seq and IHC data to define clinically relevant mRNA expression cut-offs.
Protocol for Establishing RNA-seq Biomarker Cut-offs
Objective: To define RNA-seq expression thresholds that accurately predict protein positivity as determined by IHC for key cancer biomarkers.
Materials:
- Formalin-fixed, paraffin-embedded (FFPE) endometrial biopsy samples (n > 50 recommended) [76].
- RNA extraction kit for FFPE tissue.
- RNA-seq library preparation kit and sequencer.
- IHC antibodies and staining automation system.
- QuPath software for digital pathology analysis.
Method:
- Sample Processing: Section FFPE tissue blocks. Use consecutive sections for RNA extraction and IHC to ensure comparable tumor content [76].
- RNA-seq: Isolate RNA, prepare libraries, and sequence. Quantify gene expression in Transcripts per Million (TPM) for biomarkers of interest (e.g., ESR1, PGR, ERBB2) [76].
- IHC and Scoring: Perform IHC staining. Have pathologists score slides according to clinical guidelines (e.g., % positive nuclei for ESR1/PGR, HER2 scoring guidelines). Score diagnostic markers like CDX2, KRT7, and KRT20 as positive or negative with a 1% tumor cell cut-off [76].
- Statistical Correlation: Calculate Spearman's correlation coefficients between RNA-seq TPM values and IHC scores.
- Threshold Determination: Use a binary classifier to establish RNA-seq TPM cut-offs that best discriminate between IHC-negative and IHC-positive samples, maximizing diagnostic accuracy [76].
- Validation: Confirm the performance of established RNA-seq cut-offs in an independent external cohort [76].
Key Biomarker Correlation Data
The following table summarizes strong correlations observed between RNA-seq and IHC for selected biomarkers in solid tumors, illustrating the feasibility of this approach.
Table 2: Correlation between RNA-seq and IHC for Key Biomarkers [76]
| Biomarker | IHC Scoring Method | Spearman's Correlation (ρ) | Primary Clinical Utility |
|---|---|---|---|
| ESR1 (ER) | % Positive Nuclei | 0.89 | Treatment decision-making |
| PGR (PR) | % Positive Nuclei | 0.85 | Treatment decision-making |
| ERBB2 (HER2) | Clinical 0-3+ Scale | 0.79 | Treatment decision-making |
| MKI67 (Ki-67) | % Positive Nuclei | 0.81 | Prognostic stratification |
| CD274 (PD-L1) | Combined Positive Score | 0.63 | Immunotherapy response |
| KRT7 / KRT20 | Positive/Negative (1% cut-off) | N/A | Diagnostic (Tumor origin) |
The Scientist's Toolkit: Research Reagent Solutions
Table 3: Essential Reagents and Tools for Analytical Validation
| Item | Function / Application | Example / Note |
|---|---|---|
| FFPE RNA Extraction Kit | Isolation of high-quality RNA from archived clinical samples. | Critical for correlating with historical IHC data. |
| Reverse Transcription Kit | Synthesis of cDNA from RNA for downstream RT-qPCR. | Use fixed input RNA amounts for consistency. |
| qPCR Master Mix | Amplification and detection of target cDNA. | SYBR Green or probe-based (TaqMan). |
| Stability Analysis Software | Statistical ranking of candidate HKGs based on Cq value stability. | geNorm, NormFinder. |
| IHC Autostainer | Automated and standardized staining of tissue sections. | Ensures reproducibility across samples. |
| Digital Pathology System | Slide scanning and quantitative analysis of IHC staining. | Enables precise scoring (e.g., using QuPath). |
| CNV Inference Tools | Prediction of tumor cells from scRNA-seq data based on copy number variations. | SCEVAN, CopyKAT (use with caution in EC) [77]. |
| scRNA-seq Analysis Suite | Quality control, normalization, and clustering of single-cell data. | Essential for characterizing tumor heterogeneity [77]. |
Clinical validation is a critical step in translating transcriptomic discoveries from research tools into clinically actionable diagnostics. It establishes a direct, causal link between a specific molecular signature—such as an RNA expression profile—and meaningful patient health outcomes. In the context of endometrial biopsy analysis, this process moves beyond simply identifying differentially expressed genes; it determines whether those genes can reliably predict a patient's clinical status, prognosis, or likely response to therapy. This application note provides a structured framework for the clinical validation of transcriptomic signatures derived from endometrial RNA-seq data, detailing protocols for analytical and clinical testing to ensure results are robust, reproducible, and clinically relevant.
Background: Endometrial Transcriptomics and Clinical Correlations
The human endometrium is a dynamic tissue, and its transcriptome undergoes profound, cyclical changes throughout the menstrual cycle. Transcriptomics has been instrumental in characterizing the molecular underpinnings of both normal physiology and pathological states.
- Normal Cyclical Variation: During the menstrual phase, gene expression is dominated by pathways involving tissue breakdown and inflammation, including upregulation of matrix metalloproteinases (MMPs) like MMP1, MMP3, and MMP10, and the natural cytotoxicity-triggering receptor 3 (NCR3) [39]. The proliferative phase shows increased expression of genes involved in tissue regeneration and angiogenesis, such as HOXA10, HOXA11, and PECAM1. The secretory phase is marked by transcripts that support receptivity and preparation for implantation, including PAEP and GPX3 [39]. A clinically validated signature must be able to distinguish these normal physiological changes from disease-specific alterations.
- Pathological Signatures: Transcriptomic analyses have revealed distinct signatures in benign gynecological conditions. Endometriosis, adenomyosis, and leiomyomas (fibroids) each demonstrate unique gene expression profiles that deviate from the normal cycle [39]. The clinical validation of signatures for these conditions aims to correlate specific expression patterns with surgical or histopathological confirmation, disease severity scores, and patient-reported outcomes such as pain and bleeding.
- The Validation Imperative: A signature's clinical utility is not established by its statistical association alone. It requires rigorous validation to prove it can accurately and reliably classify patient status in independent cohorts, a process that moves it from a research finding to a clinical tool [78] [79].
Experimental Protocols for Validation
Sample Collection and Preparation
A standardized protocol for endometrial biopsy and RNA extraction is fundamental to generating reliable, comparable transcriptomic data.
Protocol: Endometrial Biopsy and RNA Isolation
- Indications: The procedure is indicated for the evaluation of abnormal uterine bleeding, postmenopausal bleeding, surveillance of endometrial hyperplasia, and investigation of infertility or recurrent implantation failure [48] [49].
- Contraindications: Pregnancy is an absolute contraindication. Relative contraindications include active pelvic inflammatory disease, cervical stenosis, and acute cervical/vaginal infection [48] [49].
- Pre-procedure Care:
- Biopsy Technique:
- The patient is placed in the lithotomy position. A bimanual exam determines uterine position and size.
- A speculum is inserted to visualize the cervix, which is then cleansed with an antiseptic solution.
- A uterine sound may be used to determine the depth and direction of the uterine cavity.
- An endometrial suction catheter (e.g., Pipelle) is inserted to the fundus.
- The internal piston is fully withdrawn to create suction. The catheter is rotated 360° while moving it in and out of the cavity to sample from multiple quadrants.
- The catheter is withdrawn, and the tissue sample is expelled into a preservative or stabilization solution suitable for RNA sequencing (e.g., RNAlater) [48] [49].
- RNA Extraction:
- Using kits designed for simultaneous DNA/RNA isolation from formalin-fixed paraffin-embedded (FFPE) or fresh frozen tissue is acceptable and often beneficial for integrated analyses [79].
- Assess RNA quantity and quality using instruments like Qubit 2.0 and TapeStation 4200. A minimum RNA Integrity Number (RIN) is typically required for robust RNA-seq (e.g., RIN > 7) [79].
RNA Sequencing and Bioinformatics Analysis
Protocol: Library Preparation and Sequencing
- Input Material: 10-200 ng of extracted RNA is typical for library preparation [79].
- Library Construction: Use a stranded mRNA kit (e.g., TruSeq stranded mRNA kit for fresh frozen tissue) or exome capture kits (e.g., SureSelect XTHS2 RNA kit for FFPE tissue) to enrich for coding transcripts [79].
- Sequencing: Perform sequencing on a platform such as Illumina NovaSeq 6000 to a sufficient depth (e.g., 30-50 million paired-end reads per sample) to ensure quantitative accuracy for both highly and lowly expressed transcripts.
Protocol: Bioinformatics Processing
- Alignment: Map RNA-seq reads to a reference human genome (e.g., hg38) using a splice-aware aligner such as STAR [79].
- Quantification: Estimate transcript abundances using tools like Kallisto, outputting counts or normalized values such as Transcripts Per Million (TPM) or Fragments Per Kilobase Million (FPKM) [79].
- Quality Control (QC):
- Perform standard QC using FastQC and RSeQC.
- Monitor for DNA contamination, sample mix-ups (e.g., via HLA typing concordance), and acceptable alignment rates [79].
- Differential Expression & Signature Generation: Identify differentially expressed genes between case and control groups using statistical packages (e.g., DESeq2, limma-voom). A defined signature may be a multi-gene classifier or a single-gene biomarker.
Clinical Outcome Measures for Correlation
For clinical validation, transcriptomic data must be correlated with rigorous, pre-specified patient outcomes. The table below categorizes key outcome measures relevant to endometrial pathologies.
Table 1: Categories of Patient Outcomes for Clinical Correlation
| Category | Description | Example Measures |
|---|---|---|
| Clinical Endpoints | Objective measures of disease status or progression | Histopathological diagnosis (e.g., cancer, hyperplasia); imaging results (e.g., TVUS endometrial thickness); recurrence-free survival; overall survival [48] [49] |
| Patient-Reported Outcomes (PROs) | Direct reports from patients about their health status without clinician interpretation | SF-36 (quality of life); Beck Depression Inventory-II (psychological symptoms); pain intensity and interference scales; symptom diaries for bleeding [80] |
| Functional Status | Measures of a patient's ability to perform daily activities | Functional Independence Measure (FIM); Patient Competency Rating Scale (PCRS) [81] |
Analytical and Clinical Validation Framework
A comprehensive validation strategy requires two distinct but complementary phases.
Analytical Validation
This phase ensures the RNA-seq assay itself is robust, accurate, and reproducible.
- Objectives: Determine precision, accuracy, sensitivity, specificity, and reportable range for the transcriptomic signature [79].
- Methods:
- Use custom reference samples or cell lines with known expression profiles.
- Perform repeatability and reproducibility studies across different operators, instruments, and days.
- Test assay performance with varying RNA input amounts and qualities (e.g., different RIN scores) to establish minimum requirements [79].
Table 2: Key Analytical Performance Metrics
| Metric | Target Performance | Validation Method |
|---|---|---|
| Accuracy | >95% correlation with orthogonal method (e.g., qRT-PCR) | Measure expression of signature genes in reference samples using both RNA-seq and qRT-PCR [79] |
| Precision | Intra-run CV <10%; Inter-run CV <15% | Sequence replicate samples within the same run and across different runs [79] |
| Analytical Sensitivity | Detect expression in samples with low input (e.g., 10 ng RNA) | Serially dilute RNA input and determine the lowest input that maintains signature accuracy [79] |
| Reportable Range | Linear quantification over 3-4 orders of magnitude | Use RNA mixtures or spike-in controls to establish linearity of detection [79] |
Clinical Validation
This phase evaluates the signature's ability to correlate with or predict clinical outcomes in a well-defined patient population.
- Study Design: A prospective or retrospective cohort study is standard. The cohort should be representative of the intended-use population.
- Objectives: Quantify the signature's clinical sensitivity, specificity, positive predictive value (PPV), and negative predictive value (NPV) against a clinical gold standard (e.g., histopathology for cancer) [78] [79].
- Statistical Analysis:
- Receiver Operating Characteristic (ROC) Analysis: Used to evaluate the classifier's diagnostic performance and determine the optimal expression threshold. The area under the ROC curve (AUC) is a key metric, where 1.0 is a perfect test and 0.5 is no better than chance [78].
- Multivariable Regression: Assess whether the transcriptomic signature provides predictive value independent of established clinical variables (e.g., age, BMI, histological grade).
Visualization of Workflows and Pathways
The following diagrams illustrate the core experimental workflow and an example of a dysregulated pathway in endometrial disorders.
Diagram 1: Clinical Validation Workflow. This flowchart outlines the key stages for validating a transcriptomic signature, from patient cohort selection through to final clinical correlation.
Diagram 2: Example Dysregulated Signaling Pathway. This diagram illustrates a simplified example of pathway dysregulation, such as the downregulation of progesterone signaling leading to overexpression of MMPs and inflammation, as seen in disorders like endometriosis [39].
The Scientist's Toolkit: Essential Research Reagents and Materials
The following table lists key reagents, technologies, and computational tools essential for executing the transcriptomic validation workflow.
Table 3: Essential Research Reagent Solutions for Endometrial Transcriptomics
| Item | Function / Application | Examples / Specifications |
|---|---|---|
| Endometrial Biopsy Catheter | Minimally invasive device for obtaining endometrial tissue samples. | Pipelle de Cornier, Tao Brush [48] [49] |
| RNA Stabilization Solution | Preserves RNA integrity immediately after biopsy for transport and storage. | RNAlater Stabilization Solution |
| Nucleic Acid Extraction Kit | Isolves high-quality total RNA from endometrial tissue. | AllPrep DNA/RNA FFPE Kit (Qiagen), AllPrep DNA/RNA Mini Kit (for fresh frozen) [79] |
| RNA Quality & Quantity Assay | Assesses RNA concentration and integrity prior to library prep. | TapeStation 4200 (RIN score), Qubit Fluorometer [79] |
| RNA Library Prep Kit | Prepares RNA-seq libraries from total RNA, often with ribosomal RNA depletion. | TruSeq Stranded mRNA Kit, SureSelect XTHS2 RNA Kit (for FFPE) [79] |
| Exome Capture Probes | Enriches for exonic regions in combined DNA/RNA exome assays. | SureSelect Human All Exon V7 + UTR [79] |
| Alignment Software | Maps sequenced RNA reads to the reference genome. | STAR aligner [79] |
| Expression Quantification Tool | Estimates transcript-level abundances from aligned reads. | Kallisto [79] |
| Differential Expression Tool | Identifies statistically significant gene expression changes between groups. | DESeq2, limma-voom |
| Clinical Outcome Measures | Standardized tools to correlate molecular data with patient status. | SF-36 (Quality of Life), Hospital Anxiety and Depression Scale (HADS) [80] |
Comparative Analysis of Targeted Gene Panels vs. Whole Transcriptome Sequencing
The choice between whole transcriptome sequencing and targeted RNA sequencing is a critical strategic decision in research and clinical diagnostics. Whole transcriptome sequencing provides an unbiased, discovery-oriented approach that aims to capture the expression of all genes to construct a comprehensive cellular map [82]. In contrast, targeted gene expression profiling focuses sequencing resources on a pre-defined set of genes to achieve superior sensitivity and quantitative accuracy [82]. This comparative analysis examines the technical specifications, performance characteristics, and practical applications of both methodologies within the context of endometrial biopsy research, providing researchers with evidence-based guidance for protocol selection.
Technical Comparison and Performance Metrics
Key Characteristics and Applications
Table 1: Fundamental methodological differences between sequencing approaches
| Characteristic | Whole Transcriptome Sequencing | Targeted Gene Expression Profiling |
|---|---|---|
| Scope | Unbiased profiling of all expressed genes (~20,000 genes) | Focused analysis of pre-defined gene sets (dozens to thousands) |
| Primary Application | Discovery research, novel biomarker identification, cell atlas construction | Validation studies, clinical screening, pathway-focused analysis |
| Sensitivity | Lower for low-abundance transcripts due to gene dropout effect | Higher for target genes due to deeper sequencing coverage |
| Cost per Sample | Higher (spreads reads across entire transcriptome) | Lower (concentrates reads on specific targets) |
| Data Complexity | High-dimensional datasets requiring advanced bioinformatics | Simplified analysis with reduced computational demands |
| Ideal Research Phase | Early exploratory investigations | Translational validation and clinical application |
Whole transcriptome sequencing is intentionally agnostic, requiring no prior knowledge of specific genes, making it ideal for de novo discovery and exploratory research [82]. This approach has been successfully employed in constructing comprehensive cell atlases, such as the Human Cell Atlas initiative, and for uncovering novel disease pathways by comparing healthy and diseased tissues at single-cell resolution [82].
Targeted RNA sequencing demonstrates particular strength in clinical settings where reproducibility and cost-effectiveness are paramount. A 2025 study of 467 acute leukemia cases revealed that targeted RNA-seq effectively detected chimeric fusion transcripts and showed slightly better performance in identifying fusions resulting from intrachromosomal deletions [83]. The method's focused nature makes it indispensable for validating discoveries from initial whole transcriptome studies across large patient cohorts [82].
Quantitative Performance Comparison
Table 2: Empirical performance metrics from comparative studies
| Performance Metric | Whole Transcriptome | Targeted Approach | Research Context |
|---|---|---|---|
| Overall Concordance | 74.7% (with OGM) | 74.7% (with OGM) | Acute leukemia detection [83] |
| Unique Detection Rate | 9.4% of clinically relevant fusions | 15.8% of clinically relevant fusions | Acute leukemia analysis (n=234) [83] |
| tPOD Comparability | Reference standard | Within 10-fold of whole transcriptome | Ecological transcriptomics [35] |
| Enhancer Hijacking Detection | Poor (20.6% concordance) | Poor (20.6% concordance) | MECOM, BCL11B rearrangements [83] |
| Fusion Detection from Deletions | Effective | Slightly superior performance | Intrachromosomal deletions [83] |
Recent federal challenge evaluations have demonstrated that both approaches can provide viable solutions for high-throughput transcriptomics, with a targeted sentinel gene approach (covering 5-11% of the whole transcriptome) winning a US EPA competition based on a scoring rubric that considered accuracy, precision, transcriptome coverage, cost, and throughput [35]. The study found that transcriptomic points of departure (tPODs) based on sentinel gene sets were generally within a factor of 10 or less of those derived from whole transcriptome sequencing [35].
Experimental Protocols
Endometrial Biopsy Research Workflow
The following diagram illustrates a standardized workflow for endometrial receptivity research integrating both sequencing approaches:
Detailed Methodological Protocols
Sample Collection and Preparation Protocol
For endometrial receptivity studies, biopsies should be timed according to the luteinizing hormone (LH) peak, with paired samples collected during pre-receptive (LH+2) and receptive (LH+7/+8) phases from the same menstrual cycle [31]. Samples are obtained using a Pipelle catheter and immediately frozen at -80°C in cryopreservation media to maintain cell viability [31].
Cell-type-specific isolation: For comprehensive endometrial analysis, epithelial and stromal cells must be separated using fluorescence-activated cell sorting (FACS) to generate distinct transcriptional profiles [31]. This critical step avoids the confounding effects of cellular heterogeneity in whole tissue analyses.
Whole Transcriptome Sequencing Protocol
- Library Preparation: Convert mRNA to barcoded cDNA using poly-A selection or ribosomal RNA depletion methods
- Sequencing Parameters: Sequence to sufficient depth (typically 20-50 million reads per sample) to detect low-abundance transcripts
- Quality Control: Assess RNA integrity (RIN > 7), library complexity, and alignment rates
- Bioinformatic Analysis: Process raw data through demultiplexing, alignment to reference genome (GRCh38), and generation of digital gene expression matrices [82]
Targeted Sequencing Protocol
- Panel Design: Select genes based on previous whole transcriptome findings or known pathways (e.g., endometrial receptivity genes: LGALS1, LGALS3, ITGB1, BSG, SPP1) [31]
- Library Preparation: Utilize targeted enrichment methods such as anchored multiplex PCR (AMP) with gene-specific primers [83]
- Sequencing Parameters: Sequence to high depth (500-1000x coverage) for target genes to maximize sensitivity
- Analysis: Process data through specialized pipelines (e.g., Archer Analysis Software) for fusion detection or expression quantification [83]
The Scientist's Toolkit: Essential Research Reagents
Table 3: Key research reagents and solutions for endometrial RNA-seq studies
| Reagent/Solution | Function | Application Notes |
|---|---|---|
| Pipelle Catheter | Endometrial tissue collection | Standard clinical tool for minimally invasive biopsy collection [31] |
| FACS Equipment | Cell population separation | Critical for isolating epithelial and stromal cell fractions [31] |
| TempO-Seq Platform | Targeted library preparation | US EPA-validated sentinel gene approach for high-throughput screening [35] |
| Anchored Multiplex PCR | Targeted RNA-seq library prep | Effective for fusion transcript detection in hematologic malignancies [83] |
| beREADY Test | Endometrial receptivity assessment | Validated transcriptomic assay for confirming receptivity status [31] |
| Archer Analysis Software | Fusion detection | Specialized bioinformatic tool for analyzing targeted RNA-seq data [83] |
Endometrial Receptivity Signaling Pathways
The following diagram illustrates key molecular interactions in embryo-endometrium dialogue identified through transcriptomic studies:
This molecular network, comprising 558 prioritized protein-protein interactions between trophectodermal, epithelial, and stromal cells, was identified through cell-type-specific RNA sequencing of endometrial compartments [31]. The diagram highlights critical molecular interactions during the sequential stages of implantation: apposition, attachment, and invasion.
The comparative analysis of targeted gene panels versus whole transcriptome sequencing reveals complementary strengths that can be strategically leveraged throughout the research pipeline. Whole transcriptome approaches provide unparalleled discovery power for initial investigation of endometrial receptivity, enabling identification of novel biomarkers and pathways without prior assumptions [82] [31]. Targeted methods offer superior sensitivity, cost-effectiveness, and translational potential for validation studies and clinical applications [82] [35].
For endometrial biopsy research, an integrated approach is recommended: beginning with whole transcriptome analysis of carefully timed paired samples to establish comprehensive molecular signatures, followed by development of targeted panels for larger validation cohorts and potential clinical implementation. This sequential strategy maximizes both discovery potential and practical applicability, advancing our understanding of endometrial receptivity while developing robust diagnostic tools for clinical use.
Cross-Platform and Cross-Study Reproducibility of Endometrial Biomarkers
The identification of robust endometrial biomarkers is critically important for diagnosing uterine disorders, understanding implantation failure, and advancing personalized reproductive medicine. However, the transition of biomarker signatures from discovery to clinical application has been hampered by significant challenges in reproducibility across different technological platforms and independent studies. Variability in sample collection methods, the profound effect of menstrual cycle timing on gene expression, and differences in data processing pipelines contribute to inconsistent findings. This application note synthesizes current methodologies and protocols to address these challenges, providing a standardized framework for enhancing the reliability and cross-validation of endometrial biomarkers in research and clinical settings. The protocols outlined herein are framed within a broader thesis on RNA-seq protocol for endometrial biopsy analysis, offering researchers a comprehensive toolkit for robust biomarker discovery and validation.
Fundamental Challenges in Endometrial Biomarker Reproducibility
Impact of Menstrual Cycle Timing and Sample Collection
The human endometrium undergoes dramatic, rapid gene expression changes throughout the menstrual cycle, driven by hormonal fluctuations. This biological variability represents a primary confounder in endometrial biomarker studies, often masking true pathological signatures and leading to poor cross-study reproducibility.
Menstrual Cycle Effect: The endometrial transcriptome shows significant daily variation, with over 3,400 genes demonstrating synchronized daily changes throughout the cycle, with the most pronounced shifts occurring during the secretory phase [6]. This effect is so substantial that it can obscure the identification of true disorder-related biomarkers if not properly controlled.
Sample Collection Methods: Endometrial sampling techniques introduce another layer of variability. A meta-analysis of 1,295 patients demonstrated that biopsy under direct hysteroscopic visualisation yielded significantly higher sample adequacy (RR 1.13, 95% CI 1.10 to 1.17) and lower failure to detect endometrial pathology compared to blind sampling [84]. Furthermore, a prospective cross-sectional study highlighted differential diagnostic accuracy between Pipelle sampling and hysteroscopy with curettage for detecting chronic endometritis in women with recurrent implantation failure [85].
Table 1: Impact of Sampling Method on Diagnostic Accuracy
| Sampling Method | Sample Adequacy | Failure to Detect Pathology | Key Advantages |
|---|---|---|---|
| Hysteroscopic Visualisation | RR 1.13, 95% CI 1.10-1.17 [84] | RR 0.16, 95% CI 0.03-0.92 [84] | Direct visualization, targeted sampling |
| Blind Sampling (Pipelle) | Reference standard | Reference standard | Minimal invasiveness, low cost |
| Hysteroscopy with Curettage | High for chronic endometritis detection [85] | Low for chronic endometritis detection [85] | Combined visualization and tissue collection |
Technical and Analytical Variability
Beyond biological variability, technical aspects introduce substantial reproducibility challenges:
Platform Heterogeneity: Cross-platform meta-analyses have revealed significant discrepancies in identified biomarker genes depending on the microarray or sequencing technology employed [86]. Normalization strategies must be carefully selected to enable valid cross-dataset comparisons.
Data Processing Pipelines: Variations in bioinformatic workflows for differential expression analysis, batch effect correction, and statistical modeling can generate substantially different candidate gene lists from the same raw data [87] [86].
Standardized Protocols for Enhanced Reproducibility
Menstrual Cycle Effect Correction Protocol
To address the confounding effect of menstrual cycle progression, we recommend the following standardized protocol adapted from recent methodological advances:
Step 1: Sample Collection and Phase Annotation
- Collect endometrial biopsies with detailed menstrual cycle documentation
- Record last menstrual period (LMP), LH surge date, or progesterone administration start
- Annotate samples using standardized phase definitions (menstrual, proliferative, early/mid/late secretory)
Step 2: Molecular Staging Implementation
- Apply a molecular staging model to assign precise cycle timing [6]
- Generate cycle-normalized expression values by calculating residuals from expected expression curves
- Use penalized cyclic cubic regression splines to model gene expression across the cycle
Step 3: Differential Expression Analysis with Cycle Correction
- Incorporate cycle stage as a covariate in linear models using the
removeBatchEffectfunction (limma R package) or similar approaches [87] - Preserve condition-specific effects (e.g., disease vs. control) while removing cycle-associated variation
This approach has been shown to identify 44.2% more genuine disorder-related genes on average by removing menstrual cycle bias [87].
Cross-Platform Meta-Analysis Framework
To enhance biomarker reproducibility across technological platforms, we propose the following meta-analytic framework:
Step 1: Dataset Selection and Inclusion Criteria
- Select datasets with non-overlapping sample sets from independent research laboratories
- Prioritize datasets with heterogeneous microarray or sequencing platforms to minimize platform-specific bias
- Ensure consistent sample type (endometrial tissue) across all included datasets [86]
Step 2: Data Preprocessing and Normalization
- Apply quantile normalization within individual datasets
- Perform gene-specific batch normalization to combine datasets using common reference samples
- Utilize ComBat or other batch effect adjustment algorithms to remove technical artifacts [86]
Step 3: Differential Expression Identification
- Apply random-effects models to account for between-study heterogeneity
- Use modified ANOVA with false discovery rate (FDR) correction for multiple testing
- Validate findings across multiple analytical pipelines (e.g., ExAtlas, Network Analyst) [86]
Table 2: Key Analytical Tools for Cross-Platform Reproducibility
| Tool/Platform | Primary Function | Key Features | Applicable Data Types |
|---|---|---|---|
| ExAtlas | Meta-analysis of gene expression | Random-effects models, batch normalization | Microarray, RNA-seq |
| Network Analyst 3.0 | Comprehensive meta-analysis | Combat batch adjustment, interactive visualization | Microarray, RNA-seq |
| limma R Package | Differential expression | removeBatchEffect function, linear models | Microarray, RNA-seq |
| Molecular Staging Model | Cycle phase normalization | Cyclic cubic regression splines, time assignment | RNA-seq |
Case Studies and Applications
Successful Application in Endometrial Receptivity
The implementation of standardized protocols has yielded significant advances in endometrial receptivity assessment:
Endometrial Receptivity Diagnostic (ERD) Model: A transcriptome-based model incorporating 166 biomarker genes achieved 100% prediction accuracy in its training set for identifying the window of implantation [88]. When applied to 40 RIF patients, the ERD test identified that 67.5% (27/40) were non-receptive during the conventional timing (P+5) in HRT cycles. After personalized embryo transfer guided by ERD results, the clinical pregnancy rate improved to 65% (26/40) [88].
Endometrial Failure Risk (EFR) Signature: Development of a 122-gene signature (59 upregulated, 63 downregulated) that identifies endometrial disruptions independent of luteal phase timing. This signature stratified patients into poor vs. good endometrial prognosis groups with significantly different reproductive outcomes: pregnancy (44.6% vs. 79.6%), live birth (25.6% vs. 77.6%), and clinical miscarriage (22.2% vs. 2.6%) rates. The EFR signature demonstrated a median accuracy of 0.92, sensitivity of 0.96, and specificity of 0.84 [89].
Biomarker Discovery in Endometriosis and Recurrent Pregnancy Loss
A cross-platform meta-analysis of endometriosis and recurrent pregnancy loss identified 120 significant differentially expressed genes, with four key genes (CTNNB1, HNRNPAB, SNRPF, and TWIST2) emerging as prominent common biomarkers. These genes are primarily involved in Wnt/β-catenin signaling, RNA processing, and developmental pathways [86].
The Scientist's Toolkit: Essential Research Reagents and Materials
Table 3: Essential Research Reagent Solutions for Endometrial Biomarker Studies
| Reagent/Material | Function/Application | Specification Notes |
|---|---|---|
| Pipelle Endometrial Sampler | Minimally invasive endometrial biopsy | Suitable for blind sampling; ensure adequate tissue yield for RNA extraction |
| Hysteroscopy System | Direct visualisation and targeted biopsy | 30° lens, normal saline distension medium for optimal visualization |
| RNA Stabilization Reagents | Preservation of RNA integrity during storage/transport | RNAlater or similar commercial formulations |
| RNA Extraction Kits | High-quality RNA isolation from endometrial tissue | Select kits with proven performance for fibrous tissue; include DNase treatment |
| RNA-seq Library Prep Kits | Preparation of sequencing libraries | Strand-specific protocols recommended; ribosomal RNA depletion preferred over poly-A selection |
| qPCR Assays | Validation of candidate biomarkers | TaqMan assays or SYBR Green with optimized primers |
| Cycle Normalization Algorithm | Computational removal of menstrual cycle effects | Implementation of molecular staging model [6] or removeBatchEffect function [87] |
Visualizing Experimental Workflows and Signaling Pathways
Endometrial Biomarker Discovery and Validation Workflow
Key Signaling Pathways in Endometrial Disorders
The reproducibility of endometrial biomarkers across platforms and studies remains challenging but achievable through standardized protocols that address key sources of variability. The critical importance of menstrual cycle effect correction cannot be overstated, as this biological variable consistently emerges as a primary confounder in endometrial research. The development of molecular staging models and cross-platform meta-analytic frameworks provides powerful tools for unmasking genuine pathological signatures.
Future directions should focus on the integration of multi-omics approaches, including genomic, transcriptomic, proteomic, and metabolomic data, to develop comprehensive biomarker panels with enhanced diagnostic and prognostic value [90]. Additionally, artificial intelligence-based tools show promise for stratifying patients into clinically meaningful subgroups based on endometrial gene expression profiles [89]. As these technologies advance, adherence to standardized protocols for sample collection, processing, and computational analysis will be essential for translating endometrial biomarkers from research discoveries to clinically applicable tools that improve patient outcomes in reproductive medicine.
Conclusion
RNA-seq has revolutionized endometrial research by providing an unbiased, high-resolution view of the molecular events governing the menstrual cycle, receptivity, and disease states. A robust protocol—encompassing careful sample collection, standardized processing, and rigorous bioinformatic analysis—is paramount for generating reliable and translatable data. Future directions include the standardization of protocols across laboratories, the integration of multi-omics data, and the development of machine learning models for improved diagnostic and prognostic applications. The continued refinement of endometrial RNA-seq protocols holds immense promise for uncovering novel therapeutic targets and advancing personalized medicine in reproductive health.
References
- 1. SEOM-GEICO clinical guidelines on endometrial cancer ... [https://pmc.ncbi.nlm.nih.gov/articles/PMC12630260/]
- 2. A spatial transcriptomics dataset of the endometrium from ... [https://www.nature.com/articles/s41597-025-05995-6]
- 3. a validated system for DNA, RNA, and microbial analysis from ... [https://pmc.ncbi.nlm.nih.gov/articles/PMC12155041/]
- 4. Efficacy of endometrial receptivity testing for recurrent ... [https://pmc.ncbi.nlm.nih.gov/articles/PMC11134766/]
- 5. Endometrial receptivity profiled through transcriptomic ... [https://www.nature.com/articles/s41598-025-19633-z]
- 6. A molecular staging model for accurately dating the ... [https://www.nature.com/articles/s41467-023-41979-z]
- 7. Deep diving into menstrual cycle data to enhance women's ... [https://www.nature.com/articles/d43747-024-00025-7]
- 8. Assessment of Endometrial Sampling and ... [https://pmc.ncbi.nlm.nih.gov/articles/PMC5389493/]
- 9. Navigating single - cell -sequencing: RNA , tools, databases... protocols [https://genomicsinform.biomedcentral.com/articles/10.1186/s44342-025-00044-5]
- 10. Single-cell RNA sequencing of endometrium uncovers ... [https://pmc.ncbi.nlm.nih.gov/articles/PMC12465366/]
- 11. Exploring the Early Endometrial–Blastocyst Interactome in ... [https://pmc.ncbi.nlm.nih.gov/articles/PMC12649848/]
- 12. Single-cell sequencing uncovers disrupted stromal ... [https://www.nature.com/articles/s42003-025-08634-3]
- 13. Integration of Single-cell and bulk RNA sequencing data ... [https://www.nature.com/articles/s41598-025-22803-8]
- 14. Integrated analysis of single-cell RNA-seq and bulk RNA-seq ... [https://translational-medicine.biomedcentral.com/articles/10.1186/s12967-025-07015-y]
- 15. Frontiers | Integrating - single - cell , RNA - seq and... bulk RNA seq [https://www.frontiersin.org/journals/pharmacology/articles/10.3389/fphar.2025.1558366/full]
- 16. Integrative analysis of bulk and single-cell RNA ... [https://www.frontiersin.org/journals/medicine/articles/10.3389/fmed.2025.1552029/full]
- 17. Integration of single-cell and bulk RNA-sequencing data ... [https://pubmed.ncbi.nlm.nih.gov/39973042/]
- 18. Diagnostic Efficiency of Endometrial Sampling Methods ... [https://pmc.ncbi.nlm.nih.gov/articles/PMC12156339/]
- 19. Pipelle Endometrial Biopsy Versus Conventional Dilation ... [https://pmc.ncbi.nlm.nih.gov/articles/PMC12504009/]
- 20. A Comparative Analysis of the Pipelle Device and ... [https://pmc.ncbi.nlm.nih.gov/articles/PMC12431704/]
- 21. A Comparative Evaluation of the Three Different Methods ... [https://jcgo.org/index.php/jcgo/article/view/271/140]
- 22. Single-cell transcriptome analysis of endometrial tissue [https://pmc.ncbi.nlm.nih.gov/articles/PMC4791917/]
- 23. Optimized gene-enhanced ERA improves in vitro fertilization ... [https://pmc.ncbi.nlm.nih.gov/articles/PMC11903006/]
- 24. Quantitating RNA | Thermo Fisher Scientific - US [https://www.thermofisher.com/us/en/home/references/ambion-tech-support/rna-isolation/tech-notes/quantitating-rna.html]
- 25. RNA quantification and quality control methods [https://www.qiagen.com/us/knowledge-and-support/knowledge-hub/bench-guide/rna/rna-analysis/quantification-and-analysis-of-rna]
- 26. Purity Ratios | Nucleic Acid Ratios | Technical Note 130 [https://www.denovix.com/tn-130-purity-ratios-explained/]
- 27. Input DNA/RNA QC [https://nanoporetech.com/document/input-dna-rna-qc]
- 28. Comparison Between Two Methodologies of Sample ... [https://pmc.ncbi.nlm.nih.gov/articles/PMC11939649/]
- 29. Unlocking uterine biology at home: a validated system for ... [https://www.medrxiv.org/content/10.1101/2025.05.21.25327630v3.full-text]
- 30. RNA-seq Sample Guidelines | Genomics Core Facility [https://www.huck.psu.edu/core-facilities/genomics-core-facility/sample-recommendations/rna-seq-sample-guidelines]
- 31. Human endometrial cell-type-specific RNA sequencing ... [https://pmc.ncbi.nlm.nih.gov/articles/PMC9632455/]
- 32. The Application of Liquid Biopsy for the Development ... [https://pmc.ncbi.nlm.nih.gov/articles/PMC11988008/]
- 33. Whole Transcriptome vs 3' mRNA-Seq: How to Choose ... [https://www.lexogen.com/blog/choosing-between-whole-transcriptome-total-rna-seq-and-3-mrna-seq/]
- 34. A comparison of mRNA sequencing (RNA-Seq) library ... [https://pmc.ncbi.nlm.nih.gov/articles/PMC9008973/]
- 35. Comparison of whole transcriptome and targeted RNA ... [https://www.sciencedirect.com/science/article/abs/pii/S027323002500128X]
- 36. Comparison of library preparation methods reveals their ... [https://pmc.ncbi.nlm.nih.gov/articles/PMC4213505/]
- 37. RNA-Seq transcriptome profiling reveals distinct immune ... [https://www.nature.com/articles/s41598-025-89483-2]
- 38. a systematic comparison of DNA library preparation kits for ... [https://bmcgenomics.biomedcentral.com/articles/10.1186/s12864-016-2757-4]
- 39. Uterine Transcriptome: Understanding Physiology and ... [https://pmc.ncbi.nlm.nih.gov/articles/PMC10136129/]
- 40. A Two-Cohort RNA-seq Study Reveals Changes in Endometrial and Blood miRNome in Fertile and Infertile Women - PMC [https://pmc.ncbi.nlm.nih.gov/articles/PMC6315937/]
- 41. Single-cell transcriptome analysis of endometrial tissue - PubMed [https://pubmed.ncbi.nlm.nih.gov/26874359/]
- 42. Data analysis pipeline for RNA-seq experiments [https://pmc.ncbi.nlm.nih.gov/articles/PMC6373869/]
- 43. Bioinformatics Pipeline: mRNA Analysis - GDC Docs [https://docs.gdc.cancer.gov/Data/Bioinformatics_Pipelines/Expression_mRNA_Pipeline/]
- 44. Ten simple rules for developing visualization tools in genomics [https://pmc.ncbi.nlm.nih.gov/articles/PMC9648702/]
- 45. The power of RNA-seq-based endometrial receptivity testing [https://pubmed.ncbi.nlm.nih.gov/39470570/]
- 46. Precise hourly personalized embryo transfer significantly ... [https://www.frontiersin.org/journals/endocrinology/articles/10.3389/fendo.2024.1408398/full]
- 47. Targeted gene expression profiling for accurate ... [https://www.nature.com/articles/s41598-023-40991-z]
- 48. Endometrial Biopsy: Tips and Pitfalls [https://www.aafp.org/pubs/afp/issues/2020/0501/p551.html]
- 49. Endometrial Biopsy - StatPearls - NCBI Bookshelf - NIH [https://www.ncbi.nlm.nih.gov/books/NBK541135/]
- 50. Disease Modeling | Thermo Fisher Scientific - US [https://www.thermofisher.com/us/en/home/life-science/disease-modeling.html]
- 51. Stromal Heterogeneity in the Human Proliferative ... [https://pmc.ncbi.nlm.nih.gov/articles/PMC8224746/]
- 52. An integrated single-cell reference atlas of the human ... [https://www.nature.com/articles/s41588-024-01873-w]
- 53. Systematic comparison and assessment of RNA-seq ... [https://www.nature.com/articles/s41598-020-76881-x]
- 54. A Beginner's Guide to Analysis of RNA Sequencing Data [https://pmc.ncbi.nlm.nih.gov/articles/PMC6096346/]
- 55. Low-Quality/FFPE RNA-Seq Solutions [https://www.illumina.com/science/education/ffpe-sample-analysis/low-quality-ffpe-rna-seq.html]
- 56. A molecular staging model for accurately dating the ... [https://pmc.ncbi.nlm.nih.gov/articles/PMC10556104/]
- 57. A comprehensive assessment of RNA-seq protocols for degraded and low-quantity samples | BMC Genomics | Full Text [https://bmcgenomics.biomedcentral.com/articles/10.1186/s12864-017-3827-y]
- 58. Maximizing Small Biopsy Patient Samples: Unified RNA-Seq Platform Assessment of over 120,000 Patient Biopsies - PMC [https://pmc.ncbi.nlm.nih.gov/articles/PMC9866839/]
- 59. Low-Input RNA Sequencing [https://www.psomagen.com/low-input-rna-sequencing]
- 60. Primary Data Analysis of RNA-Seq data| RNA Lexicon [https://www.lexogen.com/blog/rna-lexicon-data-analysis-and-quality-control-primary-analysis/]
- 61. RNA-QC-chain: comprehensive and fast quality control for ... [https://bmcgenomics.biomedcentral.com/articles/10.1186/s12864-018-4503-6]
- 62. Assessing and mitigating batch effects in large-scale omics ... [https://genomebiology.biomedcentral.com/articles/10.1186/s13059-024-03401-9]
- 63. Highly effective batch effect correction method for RNA-seq ... [https://pmc.ncbi.nlm.nih.gov/articles/PMC11718288/]
- 64. [Table], QA Table for Cohort Studies - NCBI - NIH [https://www.ncbi.nlm.nih.gov/books/NBK513729/table/tablec3/]
- 65. Normalizing single-cell RNA sequencing data - PubMed Central [https://pmc.ncbi.nlm.nih.gov/articles/PMC5549838/]
- 66. Data normalization for addressing the challenges in the ... [https://bmcgenomics.biomedcentral.com/articles/10.1186/s12864-024-10364-5]
- 67. Seurat part 3 – Data normalization and PCA - NGS Analysis [https://learn.gencore.bio.nyu.edu/single-cell-rnaseq/seurat-part-3-data-normalization/]
- 68. National Statement on Ethical Conduct in Human ... [https://www.nhmrc.gov.au/about-us/publications/national-statement-ethical-conduct-human-research-2025]
- 69. Protocol for the Endometriosis Research Queensland Study ... [https://pmc.ncbi.nlm.nih.gov/articles/PMC9577890/]
- 70. The RNA-seq based endometrial receptivity test (rsERT) ... [https://www.frontiersin.org/journals/endocrinology/articles/10.3389/fendo.2022.1009161/full]
- 71. Molecular and biological markers for assessing endometrial ... [https://pmc.ncbi.nlm.nih.gov/articles/PMC12041708/]
- 72. Comparative analysis of endometrial gland imaging and ... [https://rbej.biomedcentral.com/articles/10.1186/s12958-025-01395-y]
- 73. Tissue-aware RNA-Seq processing and normalization for ... [https://bmcbioinformatics.biomedcentral.com/articles/10.1186/s12859-017-1847-x]
- 74. Statistical and machine learning methods for spatially ... [https://www.sciencedirect.com/science/article/pii/S2001037021002907]
- 75. Selecting Optimal Housekeeping Genes for RT-qPCR in ... [https://pmc.ncbi.nlm.nih.gov/articles/PMC12429465/]
- 76. RNA sequencing and immunohistochemistry jointly ... [https://www.nature.com/articles/s41598-025-12780-3]
- 77. Tool Comparison for Detecting Tumour Cells in ... [https://pmc.ncbi.nlm.nih.gov/articles/PMC12571190/]
- 78. Minimalistic Transcriptomic Signatures Permit Accurate ... [https://pmc.ncbi.nlm.nih.gov/articles/PMC12140511/]
- 79. Clinical and analytical validation of a combined RNA ... [https://www.nature.com/articles/s43856-025-00934-3]
- 80. Types of Patient-Reported Outcomes - NCBI - NIH [https://www.ncbi.nlm.nih.gov/books/NBK424381/]
- 81. Outcome Measures Table - NCBI - NIH [https://www.ncbi.nlm.nih.gov/books/NBK513785/]
- 82. Whole Transcriptome vs. Targeted Gene Expression Profiling [https://missionbio.com/company/blog/comparison-whole-transcriptome-vs-targeted-gene-expression-profiling/]
- 83. Comparative Analysis of Targeted RNA-Seq and Optical ... [https://pmc.ncbi.nlm.nih.gov/articles/PMC12608001/]
- 84. Endometrial biopsy under direct hysteroscopic visualisation ... [https://pmc.ncbi.nlm.nih.gov/articles/PMC10191705/]
- 85. Comparing the accuracy of Pipelle versus hysteroscopy and ... [https://journals.plos.org/plosone/article?id=10.1371/journal.pone.0319294]
- 86. A Comparative Cross-Platform Meta-Analysis to Identify ... [https://www.mdpi.com/2076-3417/11/8/3349]
- 87. Guidelines for biomarker discovery in endometrium [https://pmc.ncbi.nlm.nih.gov/articles/PMC8063681/]
- 88. Endometrial transcriptome profiling of patients with recurrent ... [https://pmc.ncbi.nlm.nih.gov/articles/PMC10863671/]
- 89. Predicting risk of endometrial failure: a biomarker signature ... [https://www.sciencedirect.com/science/article/pii/S0015028224001900]
- 90. Present progress in biomarker discovery of endometrial ... [https://pmc.ncbi.nlm.nih.gov/articles/PMC12032760/]