Advanced Motion Representation in Sperm Analysis: From 2D Kinematics to AI-Driven 3D Dynamics
This article provides a comprehensive overview of the evolution and current state of motion representation techniques for sperm analysis, a critical domain for advancing male fertility diagnostics and treatment.
Advanced Motion Representation in Sperm Analysis: From 2D Kinematics to AI-Driven 3D Dynamics
Abstract
This article provides a comprehensive overview of the evolution and current state of motion representation techniques for sperm analysis, a critical domain for advancing male fertility diagnostics and treatment. It begins by establishing the foundational importance of sperm motility kinematics and their established correlation with fertility outcomes. The piece then delves into the methodological shift from traditional Computer-Aided Sperm Analysis (CASA) to advanced approaches powered by artificial intelligence (AI), deep learning, and novel 3D imaging technologies. It critically examines the persistent challenges in standardization, data quality, and clinical integration, offering insights into troubleshooting and optimization strategies. Finally, the article presents a rigorous validation and comparative framework, assessing the performance of new techniques against clinical gold standards and exploring their potential to revolutionize assisted reproductive technology (ART) outcomes through more precise, automated, and predictive analysis.
The Fundamentals of Sperm Motility: Understanding Kinematic Parameters and Their Clinical Significance
Sperm motility is a fundamental parameter in assessing male fertility, serving as a functional measurement of the sperm's ability to propel themselves and successfully fertilize an oocyte [1]. The kinematic parameters of sperm motion—velocity, linearity, and beat patterns—provide crucial insights into the functional competence and metabolic state of spermatozoa [2] [3]. Traditional manual assessments of these parameters are inherently subjective and prone to significant variability, driving the adoption of Computer-Assisted Sperm Analysis (CASA) systems for objective, quantitative analysis [2] [4].
Modern technological advancements, including artificial intelligence (AI) and deep learning, are revolutionizing this field by enabling more accurate, automated, and high-throughput evaluation of sperm kinematics [5] [4] [6]. These sophisticated analyses reveal that sperm motility is a complex process dependent on intricate intracellular signaling pathways and precise post-translational modifications [3]. This document outlines the core principles of sperm motion kinematics and provides detailed protocols for their assessment in research settings focused on motion representation techniques for sperm analysis.
Core Kinematic Parameters
The movement of spermatozoa is characterized by several quantitative parameters that describe the geometry and frequency of their flagellar beating and resulting trajectory. The table below summarizes the primary kinematic parameters utilized in sperm motility analysis.
Table 1: Core Sperm Kinematic Parameters and Their Definitions
| Parameter | Acronym | Definition | Biological Significance |
|---|---|---|---|
| Curvilinear Velocity | VCL | The time-average velocity of the sperm head along its actual curvilinear path [7]. | Reflects the total energy output and vigor of movement [7]. |
| Straight-Line Velocity | VSL | The time-average velocity of the sperm head along a straight line from its first to its last position [7]. | Indicates the efficiency of forward progression. |
| Average Path Velocity | VAP | The time-average velocity of the sperm head along its spatially averaged path [7]. | Used by CASA systems to classify progressive motility. |
| Linearity | LIN | A ratio of VSL/VCL, expressed as a percentage [8]. | Measures the straightness of the trajectory; higher values indicate more linear movement [7]. |
| Amplitude of Lateral Head Displacement | ALH | The mean width of the head oscillations perpendicular to the average path [7]. | Indicates the vigor and force of the flagellar beat. |
| Beat-Cross Frequency | BCF | The frequency at which the sperm head crosses the average path [8] [7]. | Reflects the fundamental frequency of the flagellar beat. |
These parameters are not static; they can vary significantly within an individual over time. For instance, the coefficient of variation for velocity within a single individual can be around 19%, and for linearity, about 17% [8]. Furthermore, distinct sperm subpopulations with different kinematic signatures can coexist within a single ejaculate [7]. Certain parameters like VCL, VAP, ALH, and BCF have demonstrated a significant, albeit limited, predictive capacity for fertility outcomes such as litter size [7].
Signaling Pathways Regulating Motility
Sperm motility is regulated by a complex interplay of intracellular signaling pathways that control flagellar movement. The key pathway involves calcium (Ca²⁺) and bicarbonate (HCO₃⁻) ions activating soluble adenylyl cyclase (sAC), leading to the production of cyclic adenosine monophosphate (cAMP) [3]. The subsequent activation of the cAMP/PKA (protein kinase A) signaling pathway increases the phosphorylation of intrasperm phosphoproteins, including dyneins and other proteins associated with the axonemal cytoskeleton, which is essential for generating flagellar movement [3]. A parallel Ca²⁺/calmodulin pathway also regulates protein phosphorylation and motility [3]. The following diagram illustrates this core regulatory network.
Experimental Protocol for CASA-Based Kinematic Analysis
This protocol details the assessment of core sperm motion kinematics using a Computer-Assisted Sperm Analysis (CASA) system, suitable for research in species such as boars, bulls, and humans [2] [3] [7].
Research Reagent Solutions and Essential Materials
Table 2: Essential Materials for CASA Kinematic Analysis
| Item | Function/Description | Example/Specification |
|---|---|---|
| Semen Extender | Dilutes and preserves semen, providing energy substrates and maintaining osmotic balance and pH [7]. | Commercial extenders (e.g., for boars: Zoosperm ND5 [7]); may include components like Na glutamate, fructose, and buffers [1]. |
| Counting Chamber | Provides a standardized depth for microscopic analysis, critical for consistent kinematic measurements. | Chambers with a recommended depth of 20 μm for boar sperm to allow adequate movement [7]. |
| Phase-Contrast Microscope | Enables clear visualization of unstained, motile spermatozoa. | Microscope with 20x and 40x phase-contrast objectives, heated stage maintained at 37°C [2] [6]. |
| CASA System | Automates the tracking and calculation of sperm kinematic parameters. | Systems like ISASv1 [7] with validated settings for the species being analyzed. |
| Antioxidants (Optional) | Protect sperm from oxidative stress during processing, which can impair motility [9]. | Reduced Glutathione (GSH, 1 mM) and L-Ascorbic Acid (AA, 8 mM) can be added to the extender [9]. |
Step-by-Step Workflow
Sample Preparation:
- Collect semen samples using standard methods (e.g., for boars, the gloved-hand technique) [7].
- Dilute the sperm-rich fraction of the ejaculate 1:1 (vol:vol) with a pre-warmed (37°C) commercial extender [7]. For cryopreservation studies, antioxidants like a combination of 1 mM GSH and 8 mM AA can be added to the freezing extender to improve post-thaw kinematic parameters [9].
Slide Preparation:
- Load a fixed volume (e.g., 10 μL for a 20 μm deep chamber) of the diluted semen sample into a standardized counting chamber [7].
- Ensure no air bubbles are trapped and the chamber is properly filled. The choice of chamber depth is critical, as it influences the freedom of movement and thus the kinematic results [7].
Microscopy and Video Capture:
- Place the chamber on the microscope stage, ensuring the temperature is stabilized at 37°C [2] [6].
- Using a 20x or 40x phase-contrast objective, select multiple random fields of view for analysis to ensure a representative sample.
- Record videos of the moving spermatozoa. A minimum frame rate of 50 frames-per-second (fps) is recommended to accurately capture the rapid motion of the sperm head [6]. Record each field for a sufficient duration (e.g., 1-2 seconds) to establish sperm trajectories.
CASA System Analysis:
- Import the recorded videos into the CASA system software.
- The software will automatically identify spermatozoa and track their movement across consecutive frames.
- The system will calculate the core kinematic parameters (VCL, VSL, VAP, LIN, ALH, BCF) for each tracked sperm cell based on the reconstructed trajectories [7].
Data Interpretation and Quality Control:
- Export the raw kinematic data for statistical analysis. A minimum of 200 spermatozoa per sample should be analyzed for reliability [2].
- Perform multivariate statistical procedures, such as principal factor analysis and k-means clustering, to identify distinct kinematic subpopulations within the ejaculate [7].
- Be aware of technical factors that can affect results, including the type of dilution medium, temperature, dilution factor, optics, and software settings. Consistent protocol standardization is essential for inter-laboratory comparability [3].
The following flowchart summarizes this experimental workflow.
The precise definition and measurement of core sperm motion kinematics—velocity, linearity, and beat patterns—are fundamental to advancing research in male fertility and sperm pathophysiology. The integration of CASA systems with robust, standardized experimental protocols allows for the objective and high-throughput analysis of these parameters. Furthermore, the application of AI and deep learning is pushing the boundaries of this field, enabling the discovery of subtle, predictive patterns in sperm motion that were previously indiscernible [5] [4] [6]. As motion representation techniques continue to evolve, they will undoubtedly yield deeper insights into the molecular mechanisms driving sperm motility and their direct correlation with reproductive success.
The quantitative analysis of sperm motility represents a cornerstone of modern andrology, providing critical insights into male fertility potential. Within the broader context of motion representation techniques for sperm analysis, establishing robust correlations between specific kinematic parameters and reproductive outcomes is paramount for advancing both basic research and clinical applications. This Application Note details the key sperm motion parameters that demonstrate significant correlation with conception success and litter size, provides standardized protocols for their accurate measurement, and visualizes the critical biological pathways connecting motion to fertility. By integrating advanced computer-aided sperm analysis (CASA) with deep learning methodologies, researchers can now move beyond traditional subjective assessments to achieve unprecedented accuracy in predicting fertility outcomes [5] [4]. The protocols and data presented herein are designed to equip reproductive biologists and drug development professionals with the tools necessary to implement these advanced motion analysis techniques in their experimental and preclinical workflows.
Quantitative Correlation of Motion Parameters with Fertility Outcomes
Advanced sperm motion analysis has identified several kinematic parameters that serve as reliable biomarkers for predicting fertility success. The data, synthesized from studies across multiple species including humans, swine, and murine models, provide a quantitative framework for fertility assessment. The correlation between these parameters and reproductive outcomes enables more accurate prognostication and refined experimental design in contraceptive and fertility therapeutic development.
Table 1: Key Sperm Motion Parameters and Their Correlation with Fertility Outcomes
| Parameter | Abbreviation | Description | Correlation with Fertility | Experimental Evidence |
|---|---|---|---|---|
| Curvilinear Velocity | VCL | Total path velocity of the sperm head (μm/s) | Positive correlation with litter size; marker for hyperactivation [10] [7] | Swine study: Limited predictive capacity for litter size (AUC: 0.55-0.58) [7] |
| Average Path Velocity | VAP | Average velocity of the sperm head along its smoothed path (μm/s) | Positive correlation with fertilization rates [7] | Swine study: Limited predictive capacity for litter size (AUC: 0.55-0.58) [7] |
| Amplitude of Lateral Head Displacement | ALH | Mean width of sperm head oscillation (μm) | Indicator of hyperactivation; correlates with fertilization competence [10] [7] | Swine study: Limited predictive capacity for litter size (AUC: 0.55-0.58) [7] |
| Beat-Cross Frequency | BCF | Frequency of sperm head crossing the average path (Hz) | Positive association with successful fertilization [7] | Swine study: Limited predictive capacity for litter size (AUC: 0.55-0.58) [7] |
| Hyperactivated Motility | N/A | Asymmetric, high-amplitude flagellar beating | Essential for fertilization competence; increased with HyperSperm treatment [10] | Mouse model: Significant increase (p<0.05) with HyperSperm; led to improved blastocyst development and implantation [10] |
Table 2: Sperm Concentration Optimization for Reproductive Outcomes
| Species | Optimal Concentration Range | Fertility/Kindling Rate | Key Findings | Source |
|---|---|---|---|---|
| Rabbit (Nulliparous) | 15 million/straw | 84.4% | Highest fertility at lower concentration | [11] |
| Rabbit (Multiparous) | 25-55 million/straw | 78.1-81.3% | Broader optimal range compared to nulliparous | [11] |
| Rabbit (General) | 15-35 million/straw | Comparable to fresh semen | Recommended for cryopreservation protocols | [11] |
Experimental Protocols for Motion Analysis and Fertility Assessment
Protocol: 3D+Sperm Motility Analysis Using Multifocal Imaging
Purpose: To capture and analyze the three-dimensional motility patterns of human sperm, enabling detailed assessment of flagellar beating and hyperactivation under capacitating (CC) and non-capacitating conditions (NCC) [12].
Materials:
- Sperm samples from healthy donors (obtained with informed consent and ethical approval)
- Inverted microscope (e.g., Olympus IX71) with 60X water immersion objective (N.A. = 1.00)
- Piezoelectric device (e.g., Physik Instruments P-725) for z-axis objective displacement
- High-speed camera (e.g., MEMRECAM Q1v) capable of 5000-8000 fps
- NI USB-6211 digital/analog converter for signal synchronization
- Custom C# software for acquisition management
- HTF medium and capacitating media (non-capacitating media supplemented with 5 mg/ml BSA and 2 mg/ml NaHCO₃) [12]
Procedure:
- Sample Preparation:
- Obtain highly motile cells through swim-up separation after 1 hour incubation in HTF medium at 37°C in 5% CO₂.
- Centrifuge for 5 minutes at 3000 rpm.
- Resuspend in NCC media for control, or CC media to promote hyperactivation.
- Place 500 μL of sample (10² cells/mL) in imaging chamber maintained at 37°C.
Multifocal Imaging Setup:
- Attach piezoelectric device to microscope objective, configuring oscillation at 90 Hz with 20 μm amplitude.
- Set high-speed camera to record at 5000-8000 fps with 640 × 480 pixel resolution.
- Synchronize camera and piezoelectric signals using digital/analog converter and custom software.
Data Acquisition:
- Manually focus and select individual sperm cells for recording.
- Initiate acquisition, recording image sequences while piezoelectric device moves upward.
- Save images as TIF stacks with corresponding text file documenting objective height for each frame.
- Acquire 1-3.5 seconds of volumetric data per sperm cell.
Data Analysis:
- Reconstruct 3D sperm trajectories and flagellar waveforms from multifocal hyperstacks.
- Classify motility patterns (e.g., hyperactivated vs. non-hyperactivated) using computational analysis.
- Quantify kinematic parameters (VCL, VAP, ALH, BCF) specific to 3D trajectories.
Notes: This protocol generates the first publicly available collection of 3D+t raw multifocal videomicroscopy acquisitions of sperm dynamics (3D-SpermVid), particularly suited for studying hyperactivation under capacitating conditions [12].
Protocol: Deep Learning-Based Motility and Morphology Estimation
Purpose: To implement a deep neural network framework for automated assessment of sperm motility and morphology using novel motion representation, achieving MAE of 6.842% and 4.148% for motility and morphology, respectively [5].
Materials:
- VISEM dataset or comparable sperm video data
- Python with TensorFlow/PyTorch frameworks
- Computational resources (GPU recommended)
- Standard microscope with video capture capabilities
Procedure:
- Data Preprocessing:
- Extract motion information from sperm videos using MotionFlow representation.
- Simultaneously extract shape information from sperm images.
- Annotate data with expert-derived motility and morphology labels.
Model Architecture:
- Construct separate deep neural networks for motility and morphology estimation.
- Implement transfer learning from pre-trained models in computer vision.
- Design networks to ingest motion and shape features independently.
Model Training:
- Utilize K-Fold cross-validation scheme for robust performance evaluation.
- Train motility network on motion features, morphology network on shape features.
- Optimize models to minimize mean absolute error (MAE) between predictions and ground truth.
Validation:
- Compare model performance against state-of-the-art solutions and manual analysis.
- Assess generalizability across different sample preparations and imaging conditions.
- Deploy trained models for automated analysis of new sperm samples.
Notes: This approach addresses human subjectivity in traditional semen analysis and demonstrates superior performance compared to existing automated methods [5].
Protocol: Functional Fertility Assessment in Murine Models
Purpose: To evaluate the functional impact of sperm motion parameters on reproductive outcomes using a mouse IVF model, specifically testing interventions like the HyperSperm preparation technique [10].
Materials:
- Sexually mature male and female mice (e.g., F1 hybrids)
- HyperSperm media sequences (or control media)
- CASA system for sperm motility analysis
- CO₂ incubator maintained at 37°C with 5% CO₂
- Embryo culture materials
Procedure:
- Sperm Preparation and Treatment:
- Collect sperm from male mice through epididymal dissection or swim-up.
- Divide sperm sample into two aliquots: Control (standard media) and HyperSperm (sequential media treatment).
- Incubate samples for 1 hour under capacitating conditions.
Motility Analysis:
- Assess total motility and hyperactivated motility using CASA system.
- Record kinematic parameters (VCL, ALH, etc.) for both treatment groups.
- Note significant increases in hyperactivation and VCL in HyperSperm group.
In Vitro Fertilization:
- Collect cumulus-oocyte complexes (COCs) from superovulated F1 females.
- Incubate oocytes with treated sperm samples (1x10⁶ sperm/mL) for 6 hours.
- Assess fertilization rates by counting 2-cell embryos 24 hours post-insemination.
Embryo Development and Transfer:
- Culture embryos to blastocyst stage (96-120 hours).
- Record blastocyst development rates from fertilized embryos.
- Transfer 8-10 blastocysts to pseudo-pregnant recipient females.
- Assess implantation sites 7 days post-transfer and monitor pregnancy to term.
Notes: The HyperSperm protocol significantly increased hyperactivation (p<0.05), fertilization rates, blastocyst development, implantation sites, and live pup numbers compared to controls in the mouse model [10].
Signaling Pathways Linking Sperm Motility to Fertilization Competence
The journey from sperm motility to successful fertilization involves a cascade of biochemical events and signaling pathways, primarily centered on the process of capacitation. The following diagram visualizes these key pathways and their relationship to functional fertility outcomes:
Sperm Motility to Fertilization Pathway
This pathway illustrates how environmental signals in the female reproductive tract trigger biochemical changes through specific ion channels (CatSper, Hv1, SLO3), leading to hyperactivated motility—a specialized movement pattern essential for penetrating the uterotubal junction (UTJ) and achieving fertilization competence [10] [13]. The HyperSperm protocol enhances this natural process through optimized media conditions, while serine proteases like PRSS55 are essential for the sperm's functional capacity to navigate to the fertilization site [10] [13]. Advanced motion analysis techniques (CASA/DL) provide the quantitative means to measure these critical motility parameters and predict functional outcomes.
The Scientist's Toolkit: Essential Research Reagents and Solutions
Table 3: Key Research Reagent Solutions for Sperm Motion and Fertility Studies
| Reagent/Solution | Composition/Type | Function in Research | Application Context |
|---|---|---|---|
| Capacitating Media | HTF medium with 5 mg/ml BSA and 2 mg/ml NaHCO₃ | Promotes sperm hyperactivation by mimicking oviductal environment | In vitro fertilization studies; HyperSperm protocol [12] [10] |
| Non-Capacitating Media (NCC) | Physiological salts (NaCl, KCl, CaCl₂, MgCl₂) with energy substrates (pyruvate, glucose, lactate) | Maintains sperm in non-capacitated state for control conditions | Baseline motility assessment; experimental controls [12] |
| HyperSperm Media Sequence | Sequential media with varying ion concentrations and BSA | Recapitulates in vivo capacitation process in vitro | Enhancing sperm hyperactivation for improved IVF outcomes [10] |
| Cryopreservation Extender | Tris-citrate-glucose (TCG) with 16% DMSO and 0.1M sucrose | Protects sperm during freezing-thawing process | Sperm banking; fertility preservation; concentration optimization studies [11] |
| Dithiothreitol (DTT) Solution | 5mM DTT, 1% Triton X-100, 50mM TRIS | Decondenses sperm chromatin for FISH analysis | Sperm aneuploidy screening; genetic fertility assessment [14] |
| Multifocal Imaging System | Microscope with piezoelectric objective positioner | Captures 3D+t sperm motility data | Advanced flagellar analysis; hyperactivation detection in 3D space [12] |
| CASA-Mot System | Microscope with high-speed camera, specialized software | Quantifies kinematic parameters (VCL, VAP, ALH, BCF) | Standardized motility assessment; fertility prediction [4] [7] |
| Aptamer-Based Detection | Single-stranded DNA molecules targeting sperm cells | Selective binding to sperm for detection and analysis | Forensic analysis; alternative to microscopic staining [15] |
The integration of advanced motion representation techniques with functional fertility assessment has revolutionized our understanding of the quantitative relationship between sperm kinematics and reproductive success. The parameters and protocols detailed in this Application Note provide researchers with a standardized framework for implementing these analyses in both basic and translational contexts. As the field progresses toward increasingly sophisticated 3D analysis and deep learning approaches, the correlations between specific motion patterns and fertility outcomes will continue to refine our ability to diagnose male factor infertility, develop novel contraceptives, and optimize assisted reproductive technologies. The experimental workflows and reagent solutions outlined herein serve as essential tools for advancing these research objectives in reproductive biology and drug development.
Motility-related proteins DNALI1 (Dynein Axonemal Light Intermediate Chain 1) and RSPH9 (Radial Spoke Head Component 9) serve as critical regulators of ciliary and flagellar function in mammalian cells. These proteins maintain the structural integrity and motility of the "9+2" axoneme in motile cilia and sperm flagella. In sperm cells, DNALI1 functions as a component of the inner dynein arm and interacts with the MEIG1/PACRG complex within the manchette, facilitating proper cargo transport for flagellum assembly [16] [17]. RSPH9 constitutes an essential element of the radial spoke head, which connects the outer microtubule doublets to the central pair apparatus, enabling regulated waveform propagation [18] [19]. Recent evidence identifies these proteins as promising predictive biomarkers for male infertility and primary ciliary dyskinesia (PCD), with diagnostic applications extending to both genetic screening and proteomic assessment [20] [21]. This document presents standardized protocols for evaluating DNALI1 and RSPH9 in sperm analysis research, supporting their integration into motion representation techniques for fertility and ciliary function assessment.
Biomarker Mechanisms and Functional Significance
DNALI1: Structural and Functional Roles
DNALI1 encodes a protein component of the axonemal inner dynein arm that directly interacts with the cytoplasmic dynein heavy chain 1. Molecular studies demonstrate that DNALI1 recruits and stabilizes Parkin co-regulated gene (PACRG) within the manchette, forming a crucial complex with MEIG1 (Meiosis Expressed Gene 1) that enables intramanchette transport of flagellar components such as SPAG16L [17]. During spermiogenesis, this transport system delivers essential proteins to the developing sperm flagellum. Disruption of DNALI1 function results in profoundly impaired sperm motility and complete male infertility in murine models, despite normal sperm morphology in some cases [16]. Ultrastructural analysis reveals that DNALI1 deficiency causes asymmetrical distribution of the longitudinal columns in the sperm flagellum's fibrous sheath, indicating its critical role in maintaining flagellar architecture [16].
Table 1: Functional Characteristics of DNALI1 and RSPH9
| Feature | DNALI1 | RSPH9 |
|---|---|---|
| Cellular Localization | Manchette of elongating spermatids, sperm flagellum [17] | Radial spoke head of axoneme in motile cilia and flagella [19] |
| Molecular Function | Inner dynein arm component; MEIG1/PACRG complex stabilization [17] | Radial spoke head component; central pair connection [18] |
| Biological Process | Intramanchette transport; sperm flagellum assembly [17] | Regulation of flagellar waveform; ciliary beat pattern [19] |
| Mutation Phenotype | Disrupted flagellar ultrastructure; complete male infertility [16] | Ciliary transposition defects; abnormal rotational beating [18] |
| Diagnostic Utility | Immunofluorescence absence indicates PCD [21] | Immunofluorescence absence indicates PCD [21] |
RSPH9: Structural and Functional Roles
RSPH9 constitutes an essential component of the radial spoke head complex in motile cilia and flagella. This protein facilitates the structural connection between the peripheral microtubule doublets and the central apparatus, enabling mechanical coordination and regulation of dynein activity during ciliary beating [18]. In zebrafish models, Rsph9 mutations result in significantly diminished motility of both "9+2" olfactory cilia and "9+0" neural cilia, unexpectedly demonstrating its requirement beyond conventionally structured axonemes [19]. Human patients with RSPH9 mutations typically exhibit ciliary transposition defects characterized by central pair loss and displacement of an outer doublet into the axonemal center [18]. These structural abnormalities manifest as aberrant rotational beating patterns rather than complete immotility, distinguishing RSPH9-related deficiencies from other forms of PCD.
The following diagram illustrates the functional relationships and experimental assessment approaches for DNALI1 and RSPH9 in sperm flagellar function:
Experimental Protocols and Methodologies
Immunofluorescence Analysis for DNALI1 and RSPH9 Detection
Principle: Immunofluorescence (IF) enables visualization of protein localization and distribution within respiratory cilia and sperm flagella, providing diagnostic information for structural defects [21].
Protocol:
Sample Collection: Obtain nasal epithelial brushings or sperm samples from patients with suspected PCD or infertility. For sperm, collect samples by routine collection procedures and wash with PBS to remove seminal plasma [20] [21].
Cell Processing:
- For nasal brushings: Transfer samples to glass slides, air-dry, and fix in cold methanol (-20°C) for 10 minutes.
- For sperm: Wash sperm pellets three times with PBS, then transfer to poly-L-lysine-coated slides and fix with 4% paraformaldehyde for 15 minutes [21].
Permeabilization and Blocking: Permeabilize cells with 0.5% Triton X-100 in PBS for 10 minutes. Block non-specific binding with 10% goat serum in PBS for 1 hour at room temperature [21].
Antibody Incubation: Incubate samples with primary antibodies against DNALI1 (1:150; Proteintech 17601-1-AP), RSPH9, DNAH5, and GAS8 diluted in blocking buffer overnight at 4°C [16] [21]. Include positive and negative controls.
Detection: Wash slides three times with PBS, then incubate with Alexa Fluor-conjugated secondary antibodies (1:1000 dilution) for 1 hour at room temperature protected from light [16].
Mounting and Visualization: Counterstain with Hoechst 33342 (1:1000) for 10 minutes, mount with antifade medium, and visualize using laser scanning confocal microscopy [16] [21].
Interpretation: Normal cilia show continuous axonemal staining for DNALI1 and RSPH9. Abnormal patterns include complete absence, partial staining, or mislocalization to the proximal axoneme or cytoplasm [21].
Transmission Electron Microscopy for Ultrastructural Analysis
Principle: Transmission electron microscopy (TEM) reveals detailed axonemal ultrastructure, identifying defects associated with DNALI1 and RSPH9 deficiencies [16].
Protocol:
Sample Preparation: Fix sperm or ciliated epithelial samples in 2.5% phosphate-buffered glutaraldehyde for 2 hours at 4°C [16].
Post-fixation: Wash samples three times with 0.1M phosphate buffer (pH 7.2) and post-fix in 1% osmium tetroxide in 0.1M PB at 4°C for 1-1.5 hours [16].
Dehydration and Embedding: Dehydrate through graded ethanol series (50%, 70%, 90%, 100%) and 100% acetone. Infiltrate with 1:1 acetone:SPI-Chem resin overnight at 37°C, then embed in Epon 812 [16].
Sectioning and Staining: Section samples with an ultramicrotome (70-90nm thickness). Collect sections on grids and stain with uranyl acetate and lead citrate [16].
Imaging: Observe and photograph samples using a TEM at 80kV. Analyze multiple cross-sections for axonemal defects [16].
Interpretation: DNALI1 deficiencies may show asymmetrical longitudinal columns. RSPH9 mutations typically display central pair defects and microtubule transposition [16] [18].
Genetic Analysis for Mutation Detection
Principle: Whole-genome and Sanger sequencing identify pathogenic variants in DNALI1 and RSPH9 genes associated with infertility and PCD [20].
Protocol:
DNA Extraction: Isolate genomic DNA from sperm or blood using commercial kits (e.g., QIAamp DNA Mini Kit). Quantify DNA concentration using spectrophotometry [20].
Library Preparation and Sequencing: For whole-genome sequencing, prepare libraries using Illumina kits. Sequence on Illumina platforms with minimum 30x coverage. For Sanger sequencing, design primers flanking exons of interest [20].
Variant Analysis: Align sequences to reference genome (GRCh38). Identify nonsynonymous, splice-site, and structural variants in DNALI1 and RSPH9. Validate putative mutations by Sanger sequencing [20].
Variant Interpretation: Classify variants according to ACMG guidelines. Prioritize loss-of-function variants (nonsense, frameshift, splice-site) and conserved missense changes [20].
Table 2: Experimental Modalities for Biomarker Assessment
| Method | Applications | Key Outcomes | Advantages | Limitations |
|---|---|---|---|---|
| Immuno-fluorescence | Protein localization and presence in cilia/flagella [21] | Absence, mislocalization, or truncation of target proteins [21] | High specificity, visual protein distribution, relatively low cost [21] | Requires fresh, well-ciliated cells; subjective interpretation |
| Transmission Electron Microscopy | Ultrastructural analysis of axoneme [16] | Central pair defects, dynein arm absence, microtubule disorganization [16] [18] | Gold standard for structural defects; high resolution | Expensive, labor-intensive, requires specialized expertise |
| Genetic Sequencing | Mutation detection in DNALI1 and RSPH9 genes [20] | Identification of pathogenic variants (nonsense, frameshift, missense) [20] | Comprehensive, objective, enables genetic counseling | May identify variants of uncertain significance; expensive |
| High-Speed Video Microscopy | Ciliary and sperm motility analysis [21] | Abnormal beat pattern, frequency, and waveform [18] [19] | Functional assessment, non-invasive | Requires specialized equipment, subjective analysis |
The Scientist's Toolkit: Research Reagent Solutions
Table 3: Essential Research Reagents for DNALI1 and RSPH9 Analysis
| Reagent | Specifications | Application | Example Sources |
|---|---|---|---|
| Anti-DNALI1 Antibody | Polyclonal, 1:150-1:750 dilution [16] [21] | Immunofluorescence, Western blot | Proteintech (17601-1-AP), Abcam (ab155490) |
| Anti-RSPH9 Antibody | Polyclonal/monoclonal, species-specific | Immunofluorescence, axonemal localization | Commercial suppliers |
| Secondary Antibodies | Alexa Fluor conjugates (568, 488), 1:1000 dilution [16] | Immunofluorescence detection | Thermo Fisher Scientific |
| DNA Extraction Kit | QIAamp DNA Mini Kit [20] | Genetic analysis | Qiagen |
| PCR Reagents | Primer sets for exonic regions, Taq polymerase | Target amplification for sequencing | Various manufacturers |
| Sequence Analysis Software | BLAST, alignment tools, variant classifiers | Genetic variant interpretation | Open source and commercial |
| TEM Reagents | Glutaraldehyde, osmium tetroxide, Epon 812 resin [16] | Ultrastructural analysis | Electron microscopy suppliers |
| Cell Culture Media | HTF capacitation solution [16] | Sperm motility analysis | Millipore (MR-070-D) |
Data Interpretation and Diagnostic Integration
Analytical Considerations
The diagnostic workflow for DNALI1 and RSPH9 assessment requires multimodal integration. IF analysis of a four-antibody panel (DNAH5, DNALI1, GAS8, and RSPH4A/RSPH9) demonstrates 100% specificity but only 68.8% sensitivity for PCD diagnosis, necessitating complementary approaches [21]. In a Spanish cohort study, abnormal IF patterns included complete absence of DNALI1 (10 cases) or RSPH9 (3 cases), proximal distribution of DNAH5, and cytoplasmic mislocalization of GAS8 [21]. Genetic analysis enhances diagnostic precision, with whole-genome sequencing revealing DNALI1 and RSPH9 variants in patients with idiopathic infertility and PCD [20].
The following workflow diagram outlines the integrated diagnostic approach for assessing these biomarkers:
Clinical Applications and Therapeutic Implications
DNALI1 and RSPH9 assessment extends beyond diagnostic applications to inform therapeutic strategies. Notably, DNALI1-deficient mice with complete infertility achieved successful reproduction through intracytoplasmic sperm injection (ICSI), indicating that assisted reproductive technologies can bypass functional flagellar defects [16]. This finding provides crucial guidance for genetic counseling in cases of DNALI1-associated human infertility. For RSPH9 deficiencies, the partially retained ciliary motility may explain the variable clinical severity observed in PCD patients with radial spoke defects [18] [19]. These biomarkers thus facilitate personalized treatment approaches based on underlying molecular mechanisms.
DNALI1 and RSPH9 represent critical biomarkers with established roles in sperm motility and ciliary function. Their assessment through standardized protocols in immunofluorescence, electron microscopy, and genetic analysis provides robust diagnostic information for male infertility and primary ciliary dyskinesia. The integration of these biomarkers into motion representation frameworks enhances our understanding of sperm motility mechanisms and enables targeted therapeutic interventions. As research continues to elucidate the complex interactions of these proteins within the axonemal apparatus, their utility as predictive biomarkers will expand, offering new avenues for diagnostic refinement and personalized treatment in reproductive medicine.
The quantitative assessment of sperm motility is a cornerstone of male fertility evaluation and reproductive research. The journey from subjective visual estimates to sophisticated computational analysis represents a significant paradigm shift in how researchers understand and quantify sperm locomotion. This evolution, transitioning from manual microscopy to Computer-Aided Sperm Analysis (CASA), has been driven by the need for objective, reproducible, and detailed kinematic data. Framed within a broader thesis on motion representation techniques, this article details the historical context, technical capabilities, and standardized protocols that define modern sperm motility assessment, providing researchers and drug development professionals with a comprehensive resource for their experimental work.
Historical Progression of Sperm Motility Analysis
The Era of Manual Microscopy
Before the advent of digital technology, sperm motility analysis relied entirely on manual methods. The initial work involved photo- and cine-micrography, where images were projected onto photographic films at speeds of 50–200 frames per second [22]. Researchers would hand-trace sperm heads and flagellar patterns across sequential film stacks to reconstruct their two-dimensional trajectories [23] [22]. This process, while pioneering, was exceptionally time-consuming and low-throughput, fundamentally limiting the scale and statistical power of studies. Even with the introduction of video microscopy, assessments often remained subjective, typically classifying sperm motility into broad categories (e.g., progressive, non-progressive, immotile) based on technologist observation [24] [25].
The Advent of Computer-Aided Sperm Analysis (CASA)
The development of CASA systems, beginning with the first commercial instruments like CellSoft in 1985 and the Hamilton-Thorn HTM-2000, marked a revolutionary advance [23]. The core innovation was the application of computational power to digitize video images and automatically reconstruct individual sperm tracks [23]. Early systems, however, faced significant limitations in accurately distinguishing sperm from background debris and handling samples with high cell concentrations or agglutination [23] [26]. This led to consensus statements from organizations like the European Society for Human Reproduction and Embryology (ESHRE), which in 1998 advised caution in using CASA for critical clinical parameters like sperm concentration and the proportion of motile spermatozoa [23].
Modern CASA and Computational Imaging
Contemporary CASA platforms have overcome many early challenges through improved hardware and sophisticated software algorithms. Modern systems can automatically analyze 500 to >2000 sperm from multiple fields in under two minutes, capturing detailed kinematic data at 50 or 60 frames per second [27]. The latest innovations move beyond traditional microscopy, employing techniques like lens-free on-chip holography [22]. This approach uses the interference patterns of light scattered by sperm cells to reconstruct their movement in three dimensions over large volumes, offering a high-throughput, portable, and cost-effective alternative [22]. Furthermore, the field is now focused on 3D+t (3D over time) analysis, as evidenced by new public datasets like 3D-SpermVid, which capture the complex flagellar beating patterns essential for understanding hyperactivated motility [12].
Table 1: Key Milestones in Sperm Motility Analysis
| Time Period | Primary Technology | Key Capabilities | Inherent Limitations |
|---|---|---|---|
| Pre-1980s | Manual Cine-Micrography | Hand-traced 2D paths from photographic films [22]. | Extremely low throughput; labor-intensive; subjective. |
| 1980s-1990s | Early CASA Systems | Digital video capture; automated tracking of sperm heads [23]. | Poor debris/sperm differentiation; inaccurate concentration counts [23]. |
| 2000s-2010s | Improved CASA | Standardized kinematic parameters (VCL, VSL, ALH, etc.); better algorithms [23] [22]. | Limited to 2D analysis in shallow chambers; collision errors [22]. |
| 2010s-Present | Advanced Computational Imaging | 3D+t tracking; holographic imaging; flagellar analysis; large public datasets [22] [12]. | High computational demand; requires validation against clinical outcomes [27]. |
Quantitative Motility Parameters and Their Significance
The transition to CASA moved the field beyond simple motility percentages to a rich, quantitative description of sperm movement. A consensus reached in the late 1980s established standardized kinematic parameters and a three-letter terminology (e.g., VCL, LIN, ALH) that are still in use today [23]. These parameters provide deep insight into the functional competence of spermatozoa.
Table 2: Core Sperm Kinematic Parameters Measured by CASA Systems
| Parameter | Abbreviation | Definition | Clinical/Research Significance |
|---|---|---|---|
| Curvilinear Velocity | VCL | The total distance traveled by the sperm head per unit time along its actual, curved path [22]. | Indicator of sperm vigor; high VCL is linked to IVF success [22]. |
| Straight-Line Velocity | VSL | The straight-line distance between the start and end points of the track per unit time [22]. | Reflects progressive efficiency. |
| Average Path Velocity | VAP | The velocity along a spatially averaged, smoothed sperm path [22]. | Found to be higher in semen samples that achieved pregnancy [22]. |
| Linearity | LIN | A ratio (VSL/VCL) expressing the straightness of the curvilinear path [22]. | Measures the efficiency of forward progression. |
| Amplitude of Lateral Head Displacement | ALH | The mean width of the sperm head oscillations across its average path [22]. | Linked to cervical mucus penetration capability, a key functional indicator [22]. |
| Beat-Cross Frequency | BCF | The frequency at the sperm head crosses the average path [22]. | Related to the flagellar beat frequency. |
Essential Reagents and Materials for Motility Analysis
A standardized experimental setup is critical for obtaining reliable and reproducible motility data. The following toolkit details essential reagents and materials.
Table 3: Research Reagent Solutions and Essential Materials for Sperm Motility Analysis
| Item Name | Function/Application | Brief Description & Usage |
|---|---|---|
| Counting Chambers (SCA, Leja, 2X-CEL) | Motility and Concentration Assessment | Specially designed slides with a defined depth (e.g., 20 µm) to constrain sperm for consistent 2D tracking [23] [28]. "Drop-loading" chambers are preferred over capillary-loaded to avoid laminar flow artefacts [23]. |
| SpermBlue / BrightVit Stain | Morphology & Vitality Assessment | Stains used for differentiating sperm structures (morphology) and for assessing membrane integrity (vitality), respectively [28]. |
| Capacitating Media (with BSA, NaHCO₃) | Functional Motility Studies | Media used to incubate sperm to induce capacitation, a process that enables hyperactivated motility, which is essential for fertilization [12]. |
| Non-Capacitating Physiological Media | Experimental Control | A control media used to maintain sperm in a non-capacitated state for comparative studies of basal vs. hyperactivated motility [12]. |
| GoldCyto DNA Kit | DNA Fragmentation Assessment | Used to prepare samples for tests beyond motility, such as assessing sperm DNA fragmentation, which can impact fertility [28]. |
| QC-Beads & Micrometer | Internal Quality Control (IQC) | Synthetic particles and calibration tools used to regularly verify the precision and accuracy of the CASA system's tracking and measurements [28]. |
Standardized Experimental Protocol for CASA Motility Assessment
The following protocol is optimized for assessing human sperm motility using a modern CASA system and is aligned with WHO recommendations [29].
Sample Collection and Preparation
- Collection: Collect semen sample after 3-7 days of sexual abstinence via masturbation into a wide-mouthed, nontoxic container [24].
- Liquefaction: Allow the sample to liquefy completely at 37°C for up to 60 minutes [24].
- Homogenization: Mix the sample thoroughly before aliquoting to ensure a representative distribution of sperm [26].
Sample Loading and Chamber Selection
- Dilution (if necessary): For samples with very high concentration (>100 million/mL), dilute with a suitable medium to prevent cell overlapping and tracking errors.
- Chamber Loading: Place a small aliquot (4-6 µL) of the mixed sample into a counting chamber. Prefer chambers that use "drop-loading" (e.g., 2X-CEL, Cell-VU) over capillary-action loading to avoid the Segre-Silberberg effect, which can lead to a significant underestimation of concentration [23].
- Incubation: Allow the loaded chamber to settle for approximately 1 minute on a heated stage (37°C) to minimize drift and stabilize temperature.
CASA Instrument Setup and Analysis
- System Calibration: Prior to analysis, calibrate the microscope objectives and motorized stage using a certified micrometer [28].
- Configuration Selection: Choose the appropriate instrument configuration (pre-validated for human sperm analysis) that defines the kinematic thresholds for motility classification (e.g., progressive vs. non-progressive) [28].
- Image Capture & Analysis:
- Place the chamber on the motorized stage.
- Set the camera to acquire a minimum of 60 frames per second [22].
- The software will automatically capture images from multiple, randomly selected fields.
- Advanced tracking algorithms (e.g., Kalman filters, probabilistic data association) will detect sperm heads and connect their centroids across frames to build trajectories [22].
- Data Review and Validation:
- Review the analyzed fields. Manually add any sperm that were not detected and delete any non-sperm particles or debris incorrectly identified as sperm [28].
- Use the intelligent filter tool, if available, to automatically remove obvious debris [28].
- Ensure that a statistically robust number of sperm (e.g., >200) have been analyzed for a representative result.
Data Interpretation and Quality Assurance
- Report Generation: The CASA software will generate a report containing all kinematic parameters (VCL, VSL, VAP, LIN, ALH, etc.) and population statistics.
- Internal Quality Control (IQC): Perform regular IQC using control beads to monitor system performance over time [28]. Participate in External Quality Assurance (EQA) schemes to ensure inter-laboratory comparability [23].
- Clinical Correlation: Interpret results in the context of clinical reference values. For example, a progressive motility of >32% is considered normal according to WHO standards [24].
Workflow and Technological Evolution
The following diagram illustrates the core workflow of a modern CASA system and the key technological advancements that have defined each phase of its evolution.
The evolution from manual microscopy to CASA has fundamentally transformed sperm motility assessment, providing researchers with an powerful toolkit for objective, quantitative, and high-dimensional analysis. While modern CASA and emerging computational imaging methods like 3D+t tracking and on-chip holography offer unprecedented insights into sperm locomotion, the accuracy of results remains dependent on rigorous standardization, sample preparation, and quality control. For the research and drug development community, these technological advances continue to unlock new possibilities for understanding sperm function, developing novel diagnostics, and evaluating the efficacy of therapeutic interventions for male infertility.
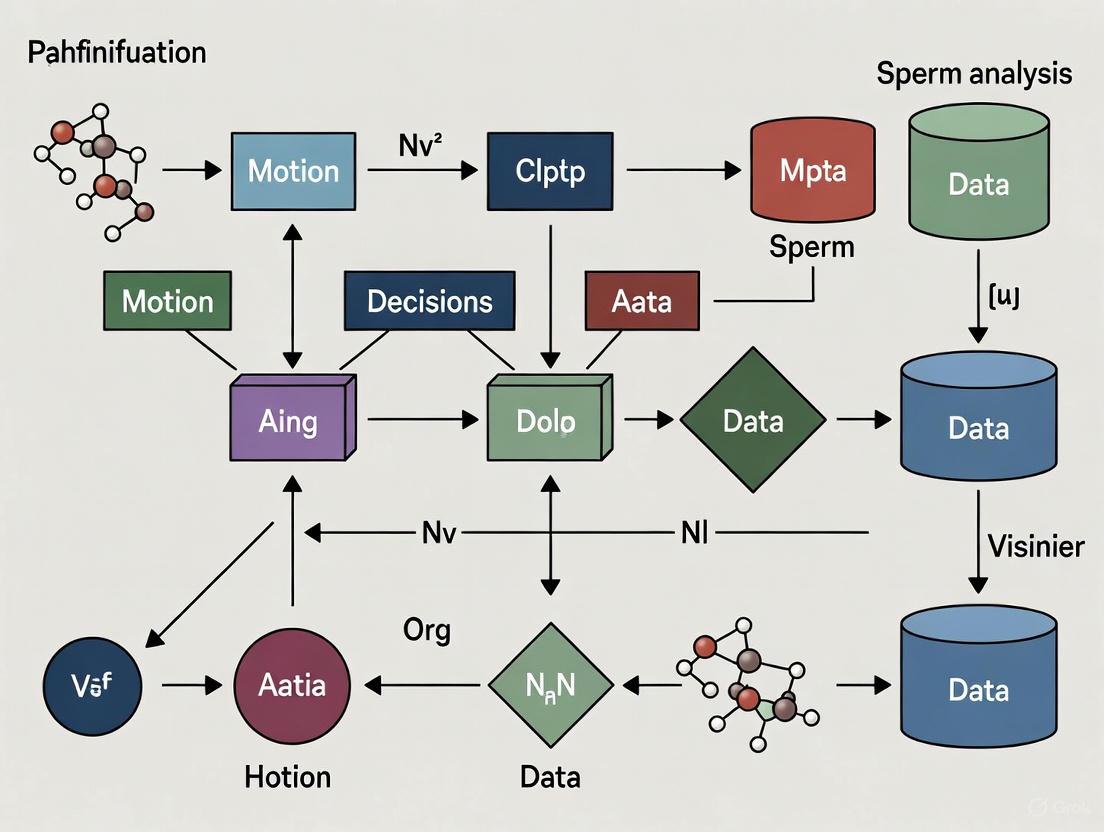
From 2D CASA to 3D AI: A Technical Deep Dive into Modern Motion Representation Techniques
Principles of Traditional CASA Systems
Traditional Computer-Assisted Semen Analysis (CASA) systems represent the established technological standard for the objective assessment of sperm motility and concentration. These systems are fundamentally designed to automate the analysis of sperm movement by tracking the kinematic parameters of sperm cells within a two-dimensional (2D) plane [12].
The core operating principle involves the use of optical microscopy, typically with a phase-contrast microscope, coupled with a digital camera. This setup captures short, sequential video recordings of a semen sample placed on a standardized chamber slide [30] [12]. The system's software then employs sophisticated image analysis algorithms to identify and track the movement of individual spermatozoa between consecutive video frames. This tracking process allows for the quantification of key kinematic parameters that describe the nature of sperm movement [30].
Table 1: Core Principles of Traditional CASA Systems
| Principle Component | Technical Description | Primary Function |
|---|---|---|
| Image Acquisition | Bright-field or phase-contrast microscopy; high-speed camera recording at 50-60 fps [12]. | Captures sequential images of sperm cell movement in a 2D plane. |
| Cell Identification | Image processing algorithms differentiate moving sperm heads from static background debris [30]. | Identifies and selects individual sperm cells for tracking. |
| Kinematic Tracking | Software tracks the centroid of the sperm head across consecutive video frames [12]. | Generates sperm movement trajectories and calculates velocity parameters. |
| Data Output | Calculation of standardized motility and kinematic parameters based on the tracked pathways [30]. | Provides quantitative metrics for sperm concentration, motility, and velocity. |
Capabilities and Standard Outputs
Traditional CASA systems are engineered to deliver a standardized suite of quantitative measurements, moving beyond the subjectivity of visual assessments by a human technician. The primary strength of these systems lies in their ability to provide high-throughput, reproducible data on several key aspects of semen quality [30].
The most fundamental outputs are concentration and the classification of motility. The system automatically calculates the sperm concentration in the sample and categorizes individual sperm tracks into motility types, such as progressive, non-progressive, and immotile, based on threshold values for velocity and straightness [30]. Beyond these basic classifications, CASA systems extract detailed kinematic parameters that provide a more nuanced picture of sperm movement characteristics. These parameters offer critical insights into the functional competence of spermatozoa.
Table 2: Standard Quantitative Outputs of Traditional CASA Systems
| Parameter Category | Specific Metrics | Biological and Clinical Significance |
|---|---|---|
| Motility & Concentration | Total sperm concentration; Percentage of motile, progressively motile, and immotile sperm [30]. | Assesses overall semen quality and the potential for sperm to reach the fertilization site. |
| Velocity Parameters | Curvilinear velocity (VCL); Straight-line velocity (VSL); Average path velocity (VAP) [30]. | Describes the vigor and nature of sperm movement. VCL reflects actual flagellar activity, while VSL indicates net progress. |
| Movement Character | Linearity (LIN = VSL/VCL); Straightness (STR = VSL/VAP); Amplitude of lateral head displacement (ALH) [30]. | Quantifies the efficiency of forward progression. Low linearity and high ALH can be indicative of hyperactivation. |
Traditional CASA System Workflow
Inherent Limitations and Technological Constraints
Despite their widespread adoption as a gold standard, traditional CASA systems possess several inherent limitations that stem from their foundational technology and 2D analysis paradigm. These constraints are particularly relevant within a research context focused on advancing motion representation techniques [12].
A primary limitation is the restriction to two-dimensional analysis. Sperm motility in vivo is an inherently three-dimensional (3D) process within the female reproductive tract. The 2D projection captured by CASA systems can distort true movement parameters; for instance, a sperm cell moving in a tight helical pattern may appear to have a high amplitude of lateral head displacement in 2D, while another moving in a wide circle in a different plane may be misclassified [12]. Furthermore, these systems are predominantly designed to track only the sperm head, deriving all kinematic parameters from the movement of the head's centroid. This approach completely ignores the flagellum, which is the actual engine of sperm motility. The complex, whip-like motion of the flagellum is the direct cause of the head's movement, and its beating patterns contain a wealth of information about sperm health and function that CASA systems fail to capture [12].
Other significant limitations include a lack of standardization across different commercial systems, which can lead to variability in results, and sensitivity to sample preparation and technical settings, such as chamber depth, viscosity, and cell concentration, which can artifactually alter motility readings [30].
Inherent Limitations of Traditional CASA
Experimental Protocol for Traditional CASA Analysis
This protocol outlines the standard methodology for analyzing sperm motility and kinematics using a traditional CASA system, suitable for research on human or animal spermatozoa.
Materials and Reagents
Table 3: Research Reagent Solutions for CASA
| Item Name | Function / Application | Example / Specification |
|---|---|---|
| Capacitating Media | Supports sperm hyperactivation; used for functional studies [12]. | Contains Bovine Serum Albumin (5 mg/ml) and NaHCO3 (2 mg/ml) [12]. |
| Non-Capacitating Media | Physiological control medium for baseline motility assessment [12]. | Physiological salt solution (e.g., NaCl, KCl, CaCl2, HEPES, lactate, glucose) [12]. |
| Standardized Chamber Slide | Holds sample for analysis with defined, consistent depth. | Disposable 20-micrometer or 100-micrometer deep counting chambers (e.g., Leja or Makler). |
| Pipettes and Tips | For accurate handling and loading of semen samples. | Sterile, disposable tips and adjustable volume pipettes. |
Step-by-Step Procedure
- Sample Preparation: Liquefy semen sample at 37°C for 20-30 minutes. For specific studies, prepare sperm using a swim-up procedure in either non-capacitating (NCC) or capacitating media (CC) to isolate motile populations and induce hyperactivation [12].
- Instrument Setup: Power on the CASA instrument, microscope, and attached computer. Launch the CASA software. Select the appropriate analysis method or species-specific settings. Ensure the microscope stage heater is stabilized at 37°C.
- Sample Loading: Gently mix the prepared sample. Using a precision pipette, load a small volume (typically 4-7 µL) into the chamber of a pre-warmed, standardized counting slide. Carefully place the slide on the heated microscope stage. Avoid introducing air bubbles.
- Image Acquisition: Allow the sample to settle for approximately 5-10 seconds. Using the 10x or 20x phase-contrast objective, locate a suitable field of view with a homogeneous distribution of sperm, avoiding the edges of the chamber. The software will automatically capture a predetermined number of video frames (e.g., 30-45 frames) at a frame rate of 50-60 Hz.
- Analysis and Data Collection: The software will automatically identify and track sperm cells. Manually verify the tracking, correcting for any misidentified objects (e.g., debris or clusters). Repeat the acquisition and analysis for a minimum of 5-8 different fields to ensure a representative sample of at least 200 sperm cells.
- Data Export: Once analysis is complete, export the raw data for all individual sperm tracks and the aggregated summary statistics for the sample for further statistical analysis.
The Research Context: Beyond Traditional CASA
The limitations of traditional CASA systems have driven the development of advanced motion representation techniques in sperm analysis research. The field is moving towards 3D+t (3D + time) analysis, which captures the full spatial and temporal dynamics of sperm movement [12]. New datasets, such as the 3D-SpermVid repository, provide raw multifocal video-microscopy hyperstacks that enable detailed observation of 3D sperm flagellar motility patterns, offering novel insights into capacitation and hyperactivation [12].
Furthermore, the integration of infrared thermography (IRT) and deep learning (DL) is addressing CASA's limitations. IRT provides non-contact temperature measurement as an indicator of physiological status, while DL architectures can achieve high-accuracy identification of behaviors and phenotypes that are invisible to traditional CASA, such as specific abnormal behaviors or early-stage diseases [30]. These next-generation technologies are poised to overcome the inherent constraints of 2D head tracking, paving the way for a more holistic and functionally relevant understanding of sperm motility.
The integration of artificial intelligence (AI) into reproductive medicine is transforming the diagnosis and treatment of male infertility. AI-driven Computer-Aided Sperm Analysis (CASA) systems leverage advanced machine learning (ML) and deep learning (DL) techniques to provide automated, objective, and high-throughput evaluation of key sperm parameters—motility, morphology, and DNA integrity [4]. This revolution addresses significant limitations inherent in traditional manual analysis, which is labor-intensive, prone to variability, and dependent on technician expertise [4] [31]. By employing a spectrum of AI techniques, from interpretable classic ML to complex DL models that extract intricate features directly from image and video data, the field now achieves more accurate and consistent assessments [4]. These advanced systems offer significant advantages, including enhanced objectivity, improved consistency, and the ability to detect subtle predictive patterns not discernible by human observation [4] [32]. The emergence of extensive open datasets and big data analytics has further enabled the development of more robust models, paving the way for personalized, efficient, and accessible fertility care [4]. This document outlines the core applications, detailed protocols, and essential resources for implementing AI in sperm analysis research, with a specific focus on motion representation techniques.
AI Applications in Key Sperm Analysis Domains
Sperm Motility and Motion Analysis
Motion analysis is the study of the locomotion and trajectory of objects [33]. In the context of sperm analysis, AI models, particularly deep learning architectures, have been developed to perceive and interpret sperm motion in a human-like manner. A key advancement is the development of a dual-pathway model that mimics the cortical V1-MT motion processing pathway in primates [34]. This model uses a trainable motion energy sensor bank and a recurrent graph network to process luminance-based first-order motion, and incorporates an additional sensing pathway with nonlinear preprocessing using a multilayer 3D CNN block to capture higher-order motion signals [34]. This architecture allows the model to naturally develop the capacity to perceive multi-order motion, making it robust for estimating object motion in natural environments that contain complex optical fluctuations [34]. Such models effectively align with biological systems while generalizing both luminance-based and higher-order motion phenomena, enabling precise tracking and characterization of sperm movement patterns that are critical for assessing fertility potential.
Sperm Morphology Classification
The manual assessment of sperm morphology is highly subjective and challenging to standardize [31]. Deep learning approaches, particularly Convolutional Neural Networks (CNNs), have demonstrated remarkable success in automating this task. One study developed a predictive model for sperm morphological evaluation utilizing CNNs trained on a dataset enhanced through data augmentation techniques [31]. The initial dataset of 1,000 individual spermatozoa images was extended to 6,035 images after augmentation. The deep learning model produced satisfactory results, with accuracy ranging from 55% to 92% across different morphological classes based on the modified David classification, which includes 12 classes of morphological defects across the head, midpiece, and tail [31]. This approach enables the automation, standardization, and acceleration of semen analysis, bringing a new level of objectivity to a traditionally variable diagnostic parameter [31].
Table 1: Performance of Deep Learning Models in Sperm Analysis
| Analysis Type | AI Model Used | Dataset Size | Key Performance Metric | Reference |
|---|---|---|---|---|
| Morphology Classification | Convolutional Neural Network (CNN) | 1,000 images (augmented to 6,035) | Accuracy: 55-92% | [31] |
| DNA Integrity Prediction | Deep CNN | 1,064 images | Bivariate correlation: ~0.43 | [35] |
| DNA Integrity Prediction (Cross-Donor) | Deep CNN | Varies by donor (73-507 images) | Mean Pearson's r: 0.43 | [35] |
Sperm DNA Integrity Prediction
Beyond morphology and motility, AI has shown promise in predicting internal sperm quality metrics that are not directly visible, such as DNA integrity. Traditional DNA integrity assays compromise cell viability, making them unsuitable for sperm selection in clinical procedures like ICSI [35]. A groundbreaking study demonstrated that a deep CNN could be trained to predict DNA integrity from brightfield images alone [35]. Using approximately 1,000 sperm cells of known DNA quality, the model achieved a moderate correlation (bivariate correlation ~0.43) between sperm cell images and DNA Fragmentation Index (DFI) [35]. The model demonstrated the ability to identify higher DNA integrity cells relative to the median, with the potential to select sperm at the 86th percentile from a given sample [35]. This approach provides rapid DNA quality predictions (under 10 ms per cell) without damaging the cell, offering a non-invasive method for selecting superior sperm for assisted reproductive technologies.
Experimental Protocols
Protocol for AI-Based Sperm Morphology Analysis
Principle: This protocol details the procedure for developing a deep learning model for automated sperm morphology classification based on the modified David classification system [31].
Materials:
- Semen samples with a sperm concentration of at least 5 million/mL
- Microscope with digital camera (e.g., MMC CASA system)
- Staining solutions (e.g., RAL Diagnostics staining kit)
- Computer with Python 3.8 and deep learning frameworks (e.g., TensorFlow, PyTorch)
Procedure:
- Sample Preparation and Staining:
- Prepare semen smears following WHO guidelines [31].
- Stain smears using an appropriate staining method (see Table 2 for comparison).
- Ensure sperm concentration is between 20-50×10^6/mL to avoid image overlap.
Data Acquisition:
- Acquire images using an optical microscope equipped with a digital camera with an oil immersion 100× objective in bright field mode [31].
- Capture approximately 37±5 images per sample, depending on sample density and sperm distribution.
- Ensure each image contains a single spermatozoon comprising head, midpiece, and tail.
Expert Classification and Labeling:
- Have three independent experts with extensive experience in semen analysis classify each spermatozoon according to the modified David classification [31].
- Resolve disagreements through consensus or majority voting.
- Create a ground truth file containing image name, expert classifications, and sperm head and tail dimensions.
Data Preprocessing:
- Clean images to handle missing values, outliers, or inconsistencies.
- Normalize or standardize numerical features to a common scale.
- Resize images to 80×80×1 grayscale using linear interpolation strategy [31].
Data Augmentation:
- Apply augmentation techniques to balance morphological classes, including rotation, flipping, and contrast adjustments.
- Expand dataset from 1,000 to 6,035 images to improve model robustness [31].
Model Training and Evaluation:
- Implement a CNN architecture for spermatozoa classification.
- Partition the dataset into training (80%) and testing (20%) sets.
- Train the model and evaluate performance using accuracy metrics ranging from 55% to 92% across different morphological classes [31].
AI Morphology Analysis Workflow
Protocol for Staining Method Comparison in Sperm Morphology Analysis
Principle: Different staining methods influence sperm head dimensions and acrosome visibility, affecting the accuracy of morphological analysis [36]. This protocol enables comparison of six common staining methods to establish method-specific reference values.
Materials:
- Semen samples from 25 donors
- Six staining solutions: Papanicolaou, Diff-Quik, Shorr, Hematoxylin-eosin (HE), Wright, and Wright-Giemsa
- Computer-aided sperm morphological analysis (CASMA) system (e.g., CFT-9202)
Procedure:
- Sample Preparation:
- Wash 2 mL of fresh liquefied semen twice with normal saline by centrifugation for 5 min at 600g.
- Resuspend sperm pellets with normal saline to adjust concentration between 20-50×10^6/mL.
- Prepare eight smears for each sperm suspension sample.
Staining:
- Stain sperm smears using each of the six staining methods according to manufacturer's instructions.
- For Papanicolaou staining: Fix in 95% alcohol for 15 min, stain with hematoxylin for 5 min, differentiate in 1% HCl alcohol, then stain with orange G and EA36 [36].
- For Diff-Quik staining: Immerse in solution A (methanol and eosin) for 30s, then in solution B (methylene blue) for 30s [36].
Morphometric Analysis:
- Using a CASMA system, measure the following sperm head parameters for 100 sperm per staining method per specimen (2,500 sperm total per method) [36]:
- Length (L)
- Width (W)
- Area (A)
- Perimeter
- Acrosomal area (Ac)
- Calculate derived values L/W and Ac/A.
- Using a CASMA system, measure the following sperm head parameters for 100 sperm per staining method per specimen (2,500 sperm total per method) [36]:
Data Analysis:
- Compare sperm head dimensions across staining methods.
- Evaluate acrosome and nucleus visibility for each method.
- Establish normal reference values for sperm head parameters specific to each staining method.
Table 2: Comparison of Sperm Staining Methods for Morphological Analysis
| Staining Method | Sperm Head Size | Acrosome/Nucleus Distinction | Recommended Use |
|---|---|---|---|
| Papanicolaou | Lowest values | Not evident | Standard morphology (with established references) |
| Diff-Quik | Moderate (third highest) | Clear distinction | Routine morphology analysis |
| Shorr | Moderate | Clear distinction | Routine morphology analysis |
| Hematoxylin-Eosin (HE) | Moderate | Moderate distinction | General assessment |
| Wright | High (second highest) | Not evident | Specific diagnostic needs |
| Wright-Giemsa | Highest values | Not evident | Specific diagnostic needs |
The Scientist's Toolkit: Research Reagent Solutions
Table 3: Essential Materials for AI-Based Sperm Analysis Research
| Item | Function | Example Specifications |
|---|---|---|
| CASA System | Automated image acquisition and initial analysis | MMC CASA system with optical microscope and digital camera [31] |
| Staining Kits | Sperm visualization and differentiation | Papanicolaou, Diff-Quik, Shorr, HE, Wright, Wright-Giemsa [36] |
| CASMA System | Computer-aided sperm morphometric analysis | CFT-9202 system for measuring head parameters [36] |
| Deep Learning Framework | Model development and training | Python 3.8 with TensorFlow/PyTorch [31] |
| Augmented Datasets | Model training and validation | SMD/MSS dataset: 1,000 images extended to 6,035 after augmentation [31] |
Advanced Motion Analysis Techniques
For researchers focusing specifically on motion representation, the dual-pathway model offers a biologically-inspired approach. This model combines classical motion energy sensors with modern deep neural networks to replicate human-like motion perception [34]. The implementation involves:
Stage I - Motion Energy Sensing (V1 Simulation):
- Implement 256 trainable motion energy units with quadrature 2D Gabor spatial filters and quadrature temporal filters.
- Capture spatiotemporal motion energies of input sperm videos within a multiscale wavelet space.
- Allow motion energy neuron parameters (preferred speed, direction) to be trainable.
Stage II - Motion Integration (MT Simulation):
- Construct a fully connected graph on local motion energy, treating each spatial location as a node.
- Use self-attention mechanism to define graph topological structure.
- Recurrently integrate motions to generate interpretations of global motion and address aperture problems.
Dual-Channel Design:
- First-order channel: Luminance-based motion sensing using motion energy computations.
- Higher-order channel: Multilayer 3D convolutions for nonlinear spatiotemporal feature extraction before motion energy computations.
This architecture enables the model to perceive both first-order (luminance-based) and second-order (higher-level spatiotemporal features) motions, making it particularly robust for analyzing sperm movement in various environmental conditions [34].
Dual-Pathway Motion Analysis Model
The integration of machine and deep learning into sperm analysis represents a paradigm shift in male fertility assessment. By leveraging advanced motion representation techniques, convolutional neural networks for morphology classification, and predictive models for DNA integrity, AI-driven CASA systems offer unprecedented objectivity, consistency, and insight into sperm quality parameters. The protocols and methodologies outlined herein provide researchers with a comprehensive framework for implementing these advanced techniques in both clinical and research settings. As the field continues to evolve, attention to data standardization, model interpretability, and ethical considerations will be crucial for maximizing the potential of these transformative technologies in revolutionizing reproductive medicine.
Quantitative Phase Imaging (QPI) represents a transformative, label-free approach for analyzing cellular dynamics by quantifying the optical path length delays that light experiences when passing through a specimen. This allows for the non-invasive measurement of nanoscale morphological and dynamic changes in living cells. Within the field of sperm analysis research, the integration of QPI with advanced computational methods is overcoming the limitations of conventional bright-field microscopy, which lacks the sensitivity to detect critical subcellular changes that influence sperm quality and fertilizing potential. This application note details how QPI, particularly when enhanced with deep learning and advanced tracking algorithms, enables the precise capture of 3D positional and biochemical dynamics of sperm cells, providing unprecedented insights for research and clinical diagnostics [37] [38].
Quantitative Performance Data
The following tables summarize key quantitative metrics for evaluating sperm cells using QPI and associated technologies, providing researchers with benchmarks for their own experiments.
Table 1: Classification Performance of Deep Neural Networks on Sperm Cell Phase Maps
| Stress Condition | Number of Cells Analyzed | Sensitivity | Specificity | Overall Accuracy |
|---|---|---|---|---|
| Control (Healthy) | 2,400 | 85.5% | 94.7% | 85.6% |
| Cryopreservation | 2,750 | (Part of overall average) | (Part of overall average) | (Part of overall average) |
| Oxidative Stress (H₂O₂) | 2,515 | (Part of overall average) | (Part of overall average) | (Part of overall average) |
| Alcohol (Ethanol) | 2,498 | (Part of overall average) | (Part of overall average) | (Part of overall average) |
Table 2: Technospatial Resolution of Advanced 3D-SpecDIM Technology
| Performance Parameter | Value / Achieved Metric | Experimental Conditions |
|---|---|---|
| Spatial Phase Sensitivity | ± 20 mrad | Utilizing a Partially Spatially Coherent Digital Holographic Microscope (PSC-DHM) [37] |
| Spectral Localization Precision | 1.11 nm (with ViT_d model) | Tracking 200 nm fluorescent microspheres; represents a 32% enhancement over conventional Gaussian fitting [39] |
| Spectral Imaging Temporal Resolution | 2.55 ms | For a 200 nm fluorescent bead with a camera exposure time of 1 ms [39] |
| 3D Tracking Capability | High spatiotemporal localization precision | Enabled by 3D target-locking single-molecule tracking (TL-3D-SMT) [39] |
Experimental Protocols
Protocol 1: QPI with Deep Learning for Classification of Spermatozoa Under Stress
This protocol outlines the procedure for acquiring quantitative phase maps of human spermatozoa under various stress conditions and their subsequent classification using deep neural networks (DNNs) [37].
Sample Preparation:
- Obtain human sperm samples and divide into aliquots for control and stress induction.
- Induction of Stress Conditions:
- Cryopreservation: Follow standard cryopreservation protocols and subsequent thawing.
- Oxidative Stress: Incubate sperm cells with a defined concentration of hydrogen peroxide (H₂O₂).
- Alcohol Affect: Incubate sperm cells with a defined concentration of ethanol.
- For motility comparison, analyze a subset from each group using a phase-contrast microscope with a Makler counting chamber according to WHO standards to categorize progressive and non-progressive motility [37].
Image Acquisition with PSC-DHM:
- Utilize a custom-built Partially Spatially Coherent Digital Holographic Microscope (PSC-DHM). This system offers high spatial phase sensitivity (± 20 mrad), which is crucial for imaging thin structures like the sperm tail [37].
- Place the sample on the microscope stage and acquire interferometric images (holograms) for each cell. The study acquired images of 10,163 individual sperm cells (2,400 control, 2,750 cryopreserved, 2,515 H₂O₂-treated, 2,498 ethanol-treated) [37].
Phase Map Reconstruction:
- Process the acquired interferometric images using appropriate numerical reconstruction algorithms to generate quantitative phase maps for each sperm cell. These phase maps represent the combined information of refractive index and local thickness of the cell [37].
Deep Neural Network Training and Classification:
- Divide the dataset of phase maps, with 70% used for training and 30% reserved for testing.
- Train a total of seven feedforward deep neural networks (DNNs) on the training set to automatically classify the phase maps into the four categories: control, cryopreserved, oxidative stress, and alcohol-affected.
- Validate the trained models against the held-out test dataset. The reported performance achieves an average sensitivity of 85.5%, specificity of 94.7%, and accuracy of 85.6% [37].
Protocol 2: 3D-SpecDIM for Single-Molecule Spectral and Positional Dynamics
This protocol describes a method for simultaneously capturing the 3D positional dynamics and fluorescence spectral dynamics of single biomolecules, a technique that can be adapted for high-resolution sperm analysis [39] [40].
System Setup:
- Integrate a prism-based spectral imaging system into the detection path of a 3D single-molecule active real-time tracking (3D-SMART) microscope.
- The 3D-SMART system uses a pair of electro-optic deflectors and a tunable acoustic gradient index (TAG) lens to drive 3D laser focus scanning. Fluorescence photons are collected by high-speed single-photon avalanche diodes [39].
- Split the fluorescence emission into a reference channel and a spectral channel. The light in the spectral channel is dispersed by a prism and projected onto an EMCCD camera [39].
Target-Locking Tracking and Data Acquisition:
- The photon arrival times are processed in real-time by a field-programmable gate array (FPGA) to calculate the deviation of the target molecule from the center of the excitation volume.
- Apply feedback control voltages to piezo stages to continuously re-center the molecule within the excitation volume, thereby recording its precise 3D trajectory and preventing motion-induced blur [39].
Spectral Image Acquisition and Processing:
- Simultaneously, acquire spectral stripe images on the EMCCD camera at high frame rates (theoretically up to 644 fps).
- For enhanced spectral localization precision, employ a Vision Transformer model with a domain adaptation strategy (ViT_d) to identify the spectral peak emission wavelength from the acquired images. This method has been shown to improve precision from 1.63 nm (with conventional Gaussian fitting) to 1.11 nm [39].
Data Synchronization and Analysis:
- Synchronize the extracted spectral information with the corresponding 3D positional data of the molecule with high temporal precision.
- Analyze the concurrent multiparameter dynamics (position and spectrum) to gain comprehensive insights into the biomolecule's behavior [39].
The following workflow diagram illustrates the integrated process of the 3D-SpecDIM protocol:
Diagram 1: 3D-SpecDIM integrated workflow for simultaneous 3D tracking and spectral imaging.
The Scientist's Toolkit: Research Reagent Solutions
Table 3: Essential Materials and Reagents for QPI-based Sperm Analysis
| Item | Function / Description | Relevance to Experiment |
|---|---|---|
| Partially Spatially Coherent Light Source | A light source with high temporal coherence but spatial incoherence, enabling single-shot phase extraction with high sensitivity. | Critical for PSC-DHM to achieve the ±20 mrad spatial phase sensitivity needed to image the thin tail of sperm cells [37]. |
| Electro-Optic Deflectors & TAG Lens | Components for high-speed 3D laser beam steering. | Enable the rapid 3D scanning required for target-locking single-molecule tracking in the 3D-SpecDIM system [39]. |
| Single-Photon Avalanche Diodes (SPADs) | High-speed, sensitive detectors for capturing low-light fluorescence signals. | Used in 3D-SpecDIM to collect photon arrival times for real-time position calculation and feedback [39]. |
| Hydrogen Peroxide (H₂O₂) | A chemical agent that induces oxidative stress in cells. | Used in stress protocols to model the negative effects of oxidative stress on sperm cell morphology and function [37]. |
| Ethanol | A chemical agent that can disrupt cell membrane integrity and function. | Used in stress protocols to model the effects of alcohol consumption on sperm cell quality [37]. |
| Cryopreservation Media | Specialized solutions containing cryoprotectants to preserve cells during freezing and thawing. | Used to study the detrimental effects of cryopreservation on sperm cells, such as mitochondrial dysfunction and membrane damage [37]. |
| Vision Transformer (ViT) Model | A deep learning model architecture based on self-attention mechanisms. | Used for precise spectral peak localization in 3D-SpecDIM, outperforming conventional fitting methods and CNNs [39]. |
Workflow and Data Processing Pathways
The integration of advanced imaging hardware and sophisticated data processing algorithms is key to extracting meaningful biological insights. The following diagram outlines the complete pathway from image acquisition to biological insight, particularly for the QPI-DNN framework.
Diagram 2: QPI-DNN workflow for automated sperm cell classification.
The quantitative analysis of sperm motility is a cornerstone of male fertility assessment. Traditional computer-aided sperm analysis (CASA) systems have provided foundational metrics such as velocity and linearity. However, these parameters often fail to capture the complex, multi-dimensional nature of sperm movement, limiting their predictive value for clinical outcomes. The integration of artificial intelligence (AI) and advanced motion analysis is catalyzing a transformative shift in this field. Modern CASA systems, leveraging machine learning (ML) and deep learning (DL) techniques, now enable automated, objective, and high-throughput evaluation of key sperm parameters, thus overcoming many limitations of subjective, manual analysis [4].
We introduce two novel motion descriptors—MotionFlow and World-Local Flows—to address the critical need for more sophisticated characterization of sperm dynamics. MotionFlow formalizes the continuous movement of sperm as a physical flow, while World-Local Flows provide a multi-scale framework for analyzing movement relative to both the global environment (World Flow) and the sperm's own body frame (Local Flow). These descriptors aim to capture the intricate kinematics and underlying biomechanical efficiency of sperm cells, offering a more powerful paradigm for linking motion patterns to fertility potential.
Theoretical Foundations of MotionFlow and World-Local Flows
MotionFlow: A Vector Field of Motion
In mathematical terms, a flow formalizes the idea of the continuous motion of particles in a fluid over time. For sperm analysis, we can define the MotionFlow of a sperm cell as a function ( \varphi ) that describes its position over time [41]. Formally, let ( X ) be the spatial domain of the sample. The MotionFlow ( \varphi ) is a function: [ \varphi : X \times \mathbb{R} \to X ] such that for an initial position ( p ) at time ( t = 0 ), the trajectory is given by ( \varphi(t, p) ). This function satisfies the group property ( \varphi(s, \varphi(t, p)) = \varphi(s + t, p) ), meaning the motion is continuous and deterministic over short time scales for a given cell [41]. The instantaneous velocity field, or the vector field ( V ) that generates this flow, is given by the derivative: [ V(p) = \frac{d}{dt} \varphi(t, p) \bigg|_{t=0} ] This formulation allows us to model the entire sperm population's movement as a vector flow field, enabling the application of differential and integral calculus to analyze collective and individual motion dynamics.
World-Local Flows: A Multi-Scale Analytical Framework
The World-Local Flows descriptor disentangles the complex motion of a sperm cell into two components that provide distinct biological insights.
World Flow (( \varphi_W )): This describes the sperm's trajectory in the laboratory (world) coordinate system—the standard frame of reference in conventional CASA. It is the absolute path of the sperm cell as recorded by the microscope camera, characterized by metrics like velocity curved line (VCL) and amplitude of lateral head displacement (ALH) [4]. This flow is crucial for understanding the overall progression and efficiency of movement toward a target.
Local Flow (( \varphiL )): This describes the motion of the sperm's constituent parts (head, midpiece, tail) relative to its own center of mass or principal body axis [42]. In mathematical terms, if ( \varphiW(t) ) is the world flow, the local flow of a point on the tail relative to the head can be defined by a local transformation. This internal motion is critical for understanding the cell's propulsive mechanism and energy expenditure, as it directly captures the beating patterns of the flagellum and the resulting head oscillations.
The relationship between these flows can be expressed as ( \varphiW = T \circ \varphiL ), where ( T ) is a time-dependent transformation that maps the local body-frame motion back into the world coordinates. Analyzing both flows simultaneously provides an integrated view of the cell's navigation strategy (World Flow) and its underlying propulsion biomechanics (Local Flow).
Application Notes: Implementing Motion Descriptors in Clinical Research
Data Acquisition and Preprocessing
High-quality input data is essential for extracting robust motion descriptors. The following protocols are recommended:
- Microscopy and Recording: Use phase-contrast or differential interference contrast (DIC) microscopy. Record sperm videos at a minimum frame rate of 90-100 frames per second (fps) to adequately capture rapid flagellar beats. A resolution of at least 1080p is recommended to facilitate accurate tracking of subcellular components [43] [44].
- Sperm Preparation: Prepare semen samples according to WHO 2010 guidelines. Use standardized liquefaction and dilution protocols to minimize technical artifacts. Maintain a constant temperature of 37°C during analysis using a heated stage to preserve native sperm motility.
- Data Annotation and Ground Truth: For model training and validation, use publicly available datasets that provide high-quality annotations. Key benchmark datasets are summarized in Table 1.
Table 1: Key Benchmark Datasets for Sperm Motility and Morphology Analysis
| Dataset Name | Modality | Key Features | Annotation Type | Potential Use Case |
|---|---|---|---|---|
| VISEM-Tracking [44] | Video, 2D images | 656,334 annotated objects with tracking details | Detection, Tracking, Regression | Training and benchmarking tracking models for World Flow |
| SVIA [44] | Video, 2D images | 125,000 annotated instances; 26,000 segmentation masks | Detection, Segmentation, Classification | Training multi-task models for joint World and Local Flow analysis |
| Care-PD [45] | 3D mesh (from video) | Largest public archive of 3D mesh gait data; multi-site collection | 3D pose, Clinical scores | Inspirational for 3D sperm pose estimation from 2D videos |
| Human Motion DB [43] | Inertial, Video | 90 fps full-body IMU data, egocentric/exocentric video | 3D pose, Activity | Methodology reference for multi-modal sensor fusion |
Computational Analysis Pipeline
The workflow for computing MotionFlow and World-Local Flows from raw video data involves sequential steps of detection, tracking, and trajectory processing, as visualized below.
Diagram 1: Computational workflow for motion descriptor extraction.
- Sperm Detection and Segmentation: Implement a deep learning-based instance segmentation model (e.g., Mask R-CNN or U-Net) trained on datasets like SVIA [44] to identify and segment individual sperm cells in each video frame. The model should be capable of distinguishing the head, midpiece, and tail regions to enable Local Flow analysis.
- Multi-Object Tracking (MOT): Apply a tracking algorithm (e.g., SORT or DeepSORT) to the segmentation masks to generate continuous trajectories for each cell across frames. This step connects discrete detections into the continuous World Flow (( \varphi_W )) for each sperm.
- Trajectory Processing for World Flow: Smooth the tracked trajectories using a Kalman filter or Savitzky-Golay filter to reduce high-frequency noise. From the smoothed World Flow path, calculate standard kinematic parameters (VCL, VSL, VAP, LIN) and novel metrics derived from the flow's vector field, such as local curvature and torsion.
- Local Flow Estimation: For each sperm, define a body-centric coordinate system origin at the centroid of the sperm head. Track the motion of keypoints along the flagellum and the head's orientation relative to this origin. The Local Flow (( \varphi_L )) is the time series of these relative displacements and rotations, which captures the internal flagellar waveform and head yaw.
Quantitative Benchmarks and Validation
To validate the clinical utility of these novel descriptors, researchers should correlate them with established measures of sperm quality and function. Table 2 summarizes potential correlations and benchmark performance targets based on current literature.
Table 2: Benchmarking Motion Descriptors Against Sperm Quality Metrics
| Motion Descriptor | Related Kinematic Metric | Target Correlation with DNA Fragmentation Index (DFI) | Expected AUC for Predicting Fertilization Capacity |
|---|---|---|---|
| World Flow Curvature Variance | Linearity (LIN) | Spearman's ρ > -0.65 [4] | > 0.75 |
| Local Flow Frequency Entropy | Beat Cross Frequency (BCF) | Spearman's ρ > -0.55 [4] | > 0.70 |
| World-Local Flow Phase Lag | - | Spearman's ρ > -0.70 [4] | > 0.78 |
| Conventional VCL | VCL | Spearman's ρ ~ -0.45 [4] | ~ 0.65 |
Experimental Protocols
Protocol 1: Staining-Free Motility Analysis Using World-Local Flows
This protocol details the procedure for acquiring and analyzing sperm motility without fluorescent staining, preserving cell viability.
Materials:
- Fresh semen sample
- Computer-assisted sperm analysis (CASA) system with a high-speed camera (≥ 90 fps)
- Standard counting chamber (e.g., Makler or Leja)
- Temperature-controlled stage (37°C)
Procedure:
- Sample Preparation: Allow the semen sample to liquefy for 20-30 minutes at 37°C. Mix the sample gently to ensure homogeneity.
- Loading: Load 5-10 µL of the sample into the counting chamber, ensuring no air bubbles are formed.
- Video Acquisition: Place the chamber on the pre-warmed microscope stage. Record at least five different fields of view. For each field, acquire a 3-second video at 100 fps.
- Data Processing and Analysis:
- Run Computational Pipeline: Process each video through the workflow shown in Diagram 1.
- Calculate World Flow Descriptors: For each tracked cell, compute the path curvature, progressive velocity (VSL), and the straight-line distance from start to end point.
- Calculate Local Flow Descriptors: For each cell, perform a Fourier analysis on the tail's Local Flow signal to extract the dominant beat frequency and amplitude.
- Data Fusion: For each cell, compute the phase difference between the head's rotation (from Local Flow) and the overall turning of the World Flow path.
- Interpretation: Sperm with high fertilization potential are expected to exhibit a stable dominant beat frequency (Local Flow) and a World Flow path with low curvature variance, indicating efficient, directed movement. A consistent phase relationship between head oscillation and path direction is also a positive indicator.
Protocol 2: Integrating Motion Descriptors with DNA Integrity Assessment
This protocol outlines how to correlate MotionFlow patterns with sperm DNA fragmentation index (DFI) for a comprehensive functional assessment.
Materials:
- Aliquots of the same semen sample from Protocol 1
- Reagents for sperm chromatin dispersion test (e.g., SCD kit)
- Standard fluorescence microscope (for DFI assessment)
- Custom software for MotionFlow analysis
Procedure:
- Parallel Processing: Split the liquefied semen sample into two aliquots.
- Aliquot 1 - Motility Analysis: Perform video acquisition and MotionFlow analysis as described in Protocol 1.
- Aliquot 2 - DNA Integrity: Process the second aliquot using the SCD test according to the manufacturer's instructions. Score at least 500 sperm cells to determine the DFI (% of fragmented DNA).
- Correlational Analysis:
- While individual cells cannot be tracked across these two destructive assays, perform a population-level correlation.
- Calculate the population averages for key MotionFlow descriptors (e.g., mean Local Flow frequency, variance of World Flow curvature).
- Use Spearman's rank correlation to test the relationship between these population-level motion metrics and the DFI value.
- Interpretation: A significant negative correlation (e.g., ρ < -0.5, p < 0.05) between progressive World Flow metrics and DFI would support the hypothesis that efficient motion descriptors are indicative of better genetic integrity.
The Scientist's Toolkit: Research Reagent Solutions
Successful implementation of these advanced motion analyses requires a combination of specific datasets, software tools, and laboratory reagents.
Table 3: Essential Research Reagents and Resources
| Item Name | Supplier / Source | Function in Protocol |
|---|---|---|
| VISEM-Tracking Dataset [44] | Thambawita V. et al. | Provides a large-scale benchmark with tracking annotations for training and validating sperm detection and World Flow analysis models. |
| SVIA Dataset [44] | Chen A. et al. | Offers segmentation masks and cropped images essential for developing and testing models for sperm part segmentation (Local Flow analysis). |
| Standard Counting Chamber (Leja) | Various suppliers (e.g., CooperSurgical) | Provides a standardized depth for reliable and reproducible video recording of sperm motility. |
| SCD Kit (Sperm Chromatin Dispersion) | Halotech DNA, SCD fertilité | Enables the assessment of sperm DNA fragmentation for correlational studies with motion descriptors. |
| U-Net or Mask R-CNN Models | Open-source platforms (e.g., PyTorch, TensorFlow) | Pre-trained neural networks that can be fine-tuned for the specific task of segmenting sperm heads and tails from microscopy images. |
The integration of MotionFlow and World-Local Flows into sperm analysis represents a significant advancement beyond conventional CASA. By providing a rigorous mathematical framework to describe both the external trajectory and internal biomechanics of sperm cells, these descriptors offer a deeper, more nuanced understanding of sperm function. The proposed protocols and benchmarks provide a clear pathway for clinical researchers and drug development scientists to adopt these tools. Future work should focus on validating these descriptors in large-scale multi-center studies and further refining them using emerging 3D imaging and multi-modal data fusion techniques to fully unlock their diagnostic and prognostic potential in reproductive medicine.
The analysis of sperm motility has traditionally relied on two-dimensional (2D) assessments of the sperm head trajectory. However, the propulsion and steering forces are generated by the complex, three-dimensional (3D) beating of the flagellum. A comprehensive understanding of sperm function, particularly the hyperactivation critical for fertilization, requires a shift "beyond the head" to directly quantify these 3D flagellar dynamics [46]. Hyperactivation is a motility pattern change characterized by high-amplitude, asymmetrical flagellar bending, which is essential for sperm to penetrate the layers surrounding the egg [47]. This application note details advanced protocols for capturing and analyzing the 4D (3D + time) kinematics of the sperm flagellum, providing researchers with methodologies to uncover novel biomarkers for male fertility assessment and drug development.
Hyperactivation and Its Flagellar Signatures
Hyperactivation is a consequence of the capacitation process, a multifaceted series of structural and functional changes that sperm undergo in the female reproductive tract. This change in beating behaviour is associated with the acquisition of fertilizing capacity [47]. In human samples incubated under capacitating conditions, approximately 10-20% of sperm exhibit this hyperactivated motility [12].
The defining characteristics of hyperactivation manifest as distinct alterations in flagellar beating, which can be quantitatively measured:
- Increased Bend Amplitude: The flagellum exhibits significantly larger bending angles post-hyperactivation [47]. One study on adhered human sperm reported a consistent increase in flagellar bending following stimulation with a hyperactivation-inducing drug [47].
- Altered Beat Frequency: The flagellar beat frequency often decreases upon hyperactivation. In drug-induced hyperactivation, all responsive cells showed a waveform with a characteristic frequency that was lower than before stimulation [47].
- Asymmetrical Beating: The flagellar bending becomes more asymmetrical in its directions, which is thought to generate the non-progressive, "star-spin" or thrashing trajectories characteristic of hyperactivated sperm [48].
- Complex Waveforms: A subset of hyperactivated cells may exhibit more complex motility with multiple frequency modes, as opposed to a single, regular frequency [47].
Table 1: Key Flagellar Parameters for Identifying Hyperactivation
| Parameter | Description | Typical Change in Hyperactivation |
|---|---|---|
| Bend Angle | The maximum angle of curvature along the flagellum. | Increases significantly [47] |
| Beat Frequency | The rate (Hz) of the flagellar beat cycle. | Decreases [47] |
| Waveform Symmetry | The balance of bend angles to left and right. | Becomes more asymmetrical [48] |
| Time-Averaged Power Dissipation | The rate of mechanical work performed on the surrounding fluid. | May decrease despite increased bending [47] |
Advanced 3D+t Imaging Techniques
Traditional 2D analysis confines the sperm head to a focal plane, but the flagellar movement is inherently 3D, always displaying components outside of a single plane [46]. The following techniques enable true 4D capture (3D spatial coordinates over time) of the freely moving flagellum.
Multifocal Imaging (MFI) Technique
The MFI technique rapidly alternates the focal plane to capture a volume of space over time.
- Objective: To record the 3D dynamics of freely swimming sperm with high temporal resolution.
- Experimental Setup: An inverted microscope is equipped with a 60X water immersion objective (e.g., NA 1.00) attached to a piezoelectric device. This device oscillates the objective along the z-axis at a high frequency (e.g., 90 Hz) and a defined amplitude (e.g., 20 µm) [12].
- Image Acquisition: A high-speed camera (e.g., NAC MEMRECAM Q1v) records images at very high frame rates (5,000-8,000 fps). The camera's capture is synchronized with the objective's z-position, allowing each image to be assigned a specific height [12].
- Data Output: The raw data is a "multifocal hyperstack"—a time-lapse series of images at different z-positions. This allows for the reconstruction of the precise 3D flagellar position at each time point [12].
High-Speed Oscillating Objective Method
This method is conceptually similar to MFI and is designed to overcome the challenge of the flagellum moving rapidly in and out of focus.
- Principle: A 100 Hz oscillating objective on a bright-field microscope scans a 16-micron depth space. This system captures images at an effective rate of ~5000 frames per second [46].
- Output: The best-focused subregions of the flagellum from each image are associated with their real 3D z-position, enabling the direct visualization and quantification of the flagellum's 3D movement over time [46].
Quantitative Analysis of Flagellar Beating
Once 4D data is acquired, the flagellum must be digitized and parameterized for quantitative analysis.
Flagellar Capture and Kinematic Descriptors
- Flagellar Tracking: The flagellum in each image frame is captured by thresholding and skeletonizing. A cubic spline is then fitted to the resulting skeleton, producing a discretized representation of the flagellum,
x(sj,tk), wheresis the arclength andtis the timestep [47]. - Key Kinematic Features:
- Curvature Analysis: The flagellar curvature along its length is calculated over time. The beat frequency can be determined from the period required to complete one beat cycle, assessed through curvature plots [47].
- Proxidistal Angle (Φ): This is defined as the maximum angle formed by a point at a fixed arclength (e.g., 30 µm from the head) relative to the tangent to the proximal midpiece. The Root Mean Square (RMS) of this angle,
∥Φ∥₂, is a useful metric for quantifying the amplitude of bending [47]. - Hydrodynamic Power Dissipation: The mechanical work done by the flagellum on the surrounding fluid can be estimated using Resistive Force Theory. The force per unit length is calculated, and the time-averaged power dissipation is derived, providing insight into the metabolic demands of motility [47].
Table 2: Core Mathematical Descriptors for Flagellar Beat Analysis
| Descriptor | Formula/Description | Application | |
|---|---|---|---|
| Flagellar Position | x(sj,tk); discretized representation via spline fitting. |
Foundation for all subsequent calculations [47]. | |
| Proxidistal Angle (Φ) | Maximum angle at a point (e.g., 30 µm from head) relative to midpiece tangent. | Quantifies bending amplitude [47]. | |
| Time-Averaged Power | P̄ = 1/T ∫₀ᵀ ∫₀ᴸ f(s,t) • u(s,t) ds dt where f is hydrodynamic force and u is velocity. |
Estimates mechanical work and energy use [47]. | |
| Fourier Transform of Curvature | `|F[κ(s,t)] | `; decomposes the beat pattern into its frequency components. | Identifies dominant beat frequencies and multi-frequency modes [47]. |
Super-Resolution and Machine Learning
Emerging computational methods enhance the resolution of motility analysis.
- Super-Resolution Phase Imaging: Techniques like the MUltiple SIgnal Classification ALgorithm (MUSICAL) can achieve a motion precision of 340 nm, far exceeding the diffraction-limited resolution, using a standard 10x lens. This allows for the derivation of nanoscale motion traces and new kinematic features like the statistics of helix period and radius [49].
- Unsupervised Classification: Feature-based 3D+t descriptors of the flagellar beat pattern can be used as input for unsupervised machine learning algorithms. This allows for the automated categorization of sperm into distinct motility groups, including the identification of hyperactivated cells without prior bias [50].
Experimental Protocols
Protocol: Drug-Induced Hyperactivation in Adhered Sperm
This protocol allows for high-resolution imaging of same-cell changes in flagellar beating upon hyperactivation [47].
Sperm Preparation:
- Perform a direct swim-up from freshly collected raw semen. Layer 300 µL of semen beneath 1 mL of supplemented Earle's Balanced Salt Solution (sEBSS).
- Incubate for 60 minutes at 37°C in a 6% CO₂ atmosphere.
- Collect the top 600 µL of medium, which contains motile sperm.
Sample Chamber Preparation:
- Coat the inner surface of a top coverslip with 0.1% poly-D-lysine and air-dry. This enhances sperm head attachment.
- Assemble the imaging chamber and fill it with the motile sperm suspension.
Pre-Stimulation Imaging:
- Identify a cell adhered by its head but with a freely moving flagellum.
- Image the cell for at least 5 seconds at a high frame rate (e.g., 332 Hz) using negative phase-contrast optics.
Hyperactivation Stimulation:
- Manually perfuse the chamber with 1 mL of medium containing 2.5 mM 4-Aminopyridine (4AP), a potent inducer of hyperactivation.
Post-Stimulation Imaging:
- Immediately image the same cell for an additional 5 seconds after perfusion.
Data Analysis:
- Track the flagellum and calculate parameters such as bend angle, beat frequency, and power dissipation before and after stimulation for direct comparison.
Protocol: 3D Flagellar Dynamics of Freely Swimming Sperm
This protocol is designed to capture the unconstrained 3D movement of sperm [12].
Sperm Incubation and Preparation:
- For non-capacitating conditions (NCC): Resuspend the sperm pellet in a physiological medium (e.g., containing NaCl, KCl, HEPES, lactate, pyruvate, glucose).
- For capacitating conditions (CC): Resuspend the sperm pellet in NCC medium supplemented with Bovine Serum Albumin (5 mg/mL) and NaHCO₃ (2 mg/mL). Incubate for ~1 hour at 37°C in 5% CO₂.
- Centrifuge the samples and adjust the concentration.
Imaging Chamber Setup:
- Place 500 µL of the sperm suspension (at ~10² cells/mL) into an imaging chamber maintained at 37°C with a thermal controller.
Multifocal Image Acquisition:
- Using the MFI system, manually select individual, freely swimming sperm cells.
- Activate the piezoelectric oscillator and high-speed camera to record a multifocal hyperstack for 1-3.5 seconds per cell.
Data Processing:
- Synchronize the camera frames with the objective's z-position using the recorded signal data.
- Assemble the image sequences (typically from the upward motion of the piezo) into a 4D dataset for analysis.
The Scientist's Toolkit
Table 3: Essential Research Reagents and Materials for Flagellar Analysis
| Item | Function/Application |
|---|---|
| 4-Aminopyridine (4AP) | Pharmacological agent to potently and rapidly induce hyperactivation for same-cell studies [47]. |
| Charcoal-Delipidated BSA | A common component of capacitation media; helps remove cholesterol from the sperm membrane, promoting capacitation [47] [12]. |
| Poly-D-Lysine | Coating agent used to adhere sperm cells by their heads to a coverslip for tethered flagellar analysis [47]. |
| Non-Capacitating Medium (NCC) | Physiological medium (e.g., with NaCl, KCl, HEPES, lactate) used as a control to study baseline motility [12]. |
| Capacitating Medium (CC) | NCC medium supplemented with BSA and bicarbonate to support the capacitation process and subsequent hyperactivation [12]. |
| Piezoelectric Device | Physik Instruments P-725 or similar. Provides precise, high-frequency oscillation of the microscope objective for 3D imaging [12]. |
| High-Speed Camera | NAC MEMRECAM Q1v or similar. Essential for capturing flagellar beating at thousands of frames per second [46] [12]. |
| Water Immersion Objective | High numerical aperture (e.g., 60x, NA 1.00) objective for high-resolution imaging, compatible with piezoelectric mounting [12]. |
Overcoming Analytical Hurdles: Addressing Data, Technical, and Standardization Challenges
In the field of andrology research, particularly in the analysis of sperm motility and morphology, the shift towards computer-assisted and automated methods has made the availability of large, high-quality, and accurately annotated datasets more critical than ever. Motion representation techniques for sperm analysis rely heavily on robust machine learning models, which in turn depend on extensive datasets for training and validation [51] [52]. However, obtaining such datasets from real clinical samples presents significant challenges, including costly and time-consuming annotation processes, privacy concerns, and inherent biological variability [51] [53]. This application note explores these challenges within the context of sperm analysis research and details standardized protocols and innovative solutions, such as synthetic data generation, that are essential for navigating the data landscape.
Standardized Laboratory Protocols for Data Acquisition
The foundation of any high-quality dataset is a standardized and rigorous data acquisition process. In semen analysis, adherence to established protocols is paramount to ensure the accuracy, consistency, and reproducibility of the data used to train and validate computer models [53].
Pre-Analytical Phase: Sample Collection and Handling
Proper procedures in the pre-analytical phase are crucial for maintaining sample integrity.
- Patient Instructions and Collection: Patients should be provided with clear instructions. After 2 to 7 days of abstinence, the entire semen sample is collected in a sterile container via masturbation. Coitus interruptus is not acceptable due to the risk of sample loss, bacterial contamination, and exposure to acidic vaginal pH [54].
- Liquefaction: After collection, the sample must be placed in an incubator at 37°C for 30 to 60 minutes to allow for liquefaction before analysis [53].
- Rejection Criteria: Laboratories should establish strict specimen rejection criteria. Reasons for rejection include incorrect sample collection, exposure to extreme temperatures during transport, and delays in analysis exceeding 60 minutes [53].
Analytical Phase: Macroscopic and Microscopic Evaluation
A routine semen analysis involves the evaluation of multiple parameters, as standardized by the World Health Organization (WHO) guidelines [53] [54].
Table 1: Key Parameters in Manual Semen Analysis and WHO Reference Limits
| Parameter | Description | WHO Lower Reference Limit (2021) |
|---|---|---|
| Volume | Total volume of the ejaculate | 1.4 mL [54] |
| Sperm Concentration | Number of sperm per milliliter | 16 million/mL [54] |
| Total Motility | Percentage of sperm that are motile | 40% [54] |
| Progressive Motility | Percentage of sperm moving actively, either linearly or in a large circle | 32% [54] |
| Sperm Morphology | Percentage of sperm with normal shape | 4% [54] |
| Vitality | Percentage of live sperm | 60% [54] |
Macroscopic Examination: This includes the assessment of liquefaction, viscosity, appearance, volume, and pH of the ejaculate [53].
Microscopic Examination: This is performed using a phase-contrast microscope. The sample must be mixed well using a vortex mixer to resuspend the cellular fraction before examination. Key assessments include [53]:
- Sperm Concentration and Count: Calculated using a hemocytometer or similar chamber.
- Sperm Motility: Differentiated into progressively motile, non-progressively motile, and immotile categories.
- Other Elements: Assessment of the presence of round cells, white blood cells, and sperm agglutination.
Quality Control (QC) and Quality Assurance (QA)
Implementing a robust QC and QA program is fundamental to reliable data generation in an andrology laboratory [53].
- Internal Quality Control (IQC): This assesses day-to-day reproducibility within a laboratory. It involves checking critical points such as temperature control, equipment maintenance, and technical performance. Technicians should undergo biannual performance evaluations [53].
- External Quality Control (EQC): This involves an external agency checking laboratory performance to assess accuracy and detect systematic variations. It is typically carried out by having different laboratories evaluate the same sample [53].
- Standard Operating Procedures (SOPs): The first step in a QC program is to create detailed SOPs for all laboratory processes to reduce errors and ensure uniformity [53].
Table 2: Example Schedule for Quality Control in an Andrology Laboratory
| Frequency | QC Steps |
|---|---|
| Daily | Monitor temperature of all instruments; count QC beads in counting chamber [53] |
| Weekly | Equipment calibration and function checks [53] |
| Monthly | Technician proficiency testing for key assays [53] |
| Annually | Comprehensive review of all SOPs and QC records [53] |
Computational Methods and Data Scarcity Solutions
The limitations of manual analysis and the need for high-volume data have driven the development of Computer-Assisted Semen Analysis (CASA) systems. A major challenge in developing and validating these systems is the accurate assessment of their algorithms against a known ground truth, which is often unavailable for real-life samples [52].
Synthetic Data Generation for CASA Validation
To address the data availability challenge, open-source software tools and simulation platforms have been developed. These tools generate life-like synthetic images and videos of sperm cells, which are invaluable for training and testing CASA algorithms because all parameters are known and controllable [51] [52].
AndroGen is one such tool, an open-source software designed to generate customized synthetic images of male reproductive cells without the need for real data or generative training models. This reduces costs, annotation effort, and privacy concerns. It allows researchers to create task-specific datasets by customizing parameters related to cell morphology and movement [51].
Sperm Image Simulation Models, as described by Choi et al., involve creating a model for the sperm cell image and its movement. The simulator can generate sperm cells with different swimming modes (linear, circular, hyperactive, and immotile) and integrate them into multi-cell images that closely mimic real semen samples. This allows for the objective assessment of segmentation, localization, and tracking algorithms under a wide variety of controlled conditions [52].
The following workflow outlines the protocol for using synthetic data generation to validate CASA algorithms:
Advanced Segmentation for Morphology Analysis
Beyond motility, sperm morphology is a crucial parameter. Traditional analysis is subjective and time-consuming. Advanced computational methods are being developed to address this. SpeHeatal is an unsupervised segmentation method designed for sperm head and tail analysis. It uses the Segment Anything Model (SAM) to generate masks for sperm heads and a novel clustering algorithm, Con2Dis, to segment overlapping tails. This approach is particularly effective for handling images with overlapping sperm and dye impurities, reducing the dependency on large, perfectly annotated real-world datasets [55].
The Scientist's Toolkit: Research Reagent Solutions
The following table details key reagents and materials essential for conducting standardized semen analysis and fluorescence in situ hybridization (FISH), a technique used for genetic analysis of sperm [53] [56].
Table 3: Essential Research Reagents and Materials for Sperm Analysis
| Reagent/Material | Function/Application |
|---|---|
| Silanized or Adhesive-Coated Slides | Provides a charged surface to ensure tissue sections and cell preparations adhere during processing and hybridization steps [56]. |
| Proteinase K / Protease Solution | Digests proteins in formalin-fixed paraffin-embedded (FFPE) tissue sections, allowing the FISH probe to access the target DNA [56]. |
| Formamide/2xSSC Denaturation Solution | Denatures double-stranded DNA in both the specimen and the labeled probe, enabling hybridization [56]. |
| Fluorochrome-Labeled DNA Probes | Target-specific DNA sequences (e.g., for centromeres, telomeres, unique genes) for visualization via fluorescence microscopy [56]. |
| Vectashield Mounting Medium with DAPI | Preserves fluorescence and provides a counterstain that labels all nuclear DNA, allowing for the visualization of nuclei and the context of FISH signals [56]. |
| Wash Buffers (e.g., 0.4xSSC/0.3% IGEPAL) | Removes excess and nonspecifically bound probe after hybridization to reduce background signal and improve specificity [56]. |
| Phase-Contrast Microscope | Essential for the initial microscopic evaluation of sperm concentration, motility, and agglutination in fresh samples [53] [54]. |
| Fluorescence Microscope | Required for visualizing and scoring FISH signals using specific filters for different fluorochromes (e.g., DAPI, FITC, TRITC) [56]. |
Experimental Protocol: Sperm Motility Analysis via CASA with Synthetic Data Validation
This protocol outlines the steps for assessing sperm motility using a CASA system, with an integrated procedure for validating the CASA algorithm using a public sperm image simulator [52].
Objective: To accurately quantify sperm motility parameters and validate the CASA algorithm's performance using simulated semen images with known ground truth.
Materials and Equipment:
- Computer-Assisted Semen Analysis (CASA) system
- Phase-contrast or fluorescence microscope with camera
- Sperm Image Simulator (e.g., NJIT Sperm Simulator from https://github.com/JiwonChoi-NJIT/NJITspermsimulator)
- Standard laboratory equipment for semen sample preparation (incubator, vortex mixer, micropipettes)
Procedure:
Part A: CASA Algorithm Validation with Simulated Data
- Install Simulation Software: Download and install the stand-alone sperm image simulator or MATLAB codes from the public repository [52].
- Define Simulation Parameters: Use the software to define parameters for generating synthetic semen video sequences. Key parameters include:
- Number of sperm cells.
- Proportion of cells in each motility type (linear, circular, hyperactive, immotile).
- Level of image noise.
- Duration and frame rate of the video.
- Generate Ground Truth Data: Run the simulator to produce synthetic video sequences. The software simultaneously generates the ground truth data for every sperm's position and trajectory.
- Run CASA Analysis: Process the generated synthetic videos with the CASA algorithm under evaluation.
- Performance Metrics Calculation: Compare the CASA output against the known ground truth. Calculate metrics such as:
- Multi-Object Tracking Accuracy (MOTA): Combines false positives, false negatives, and identity switches to measure tracking accuracy.
- Multi-Object Tracking Precision (MOTP): Measures the average discrepancy between the tracked and ground truth positions.
- Optimal Subpattern Assignment (OSPA): Evaluates the error in multi-object tracking by considering both localization and cardinality errors [52].
- Algorithm Refinement: Iterate by refining the CASA algorithm's segmentation and tracking logic based on performance metrics and re-running the validation until satisfactory performance is achieved.
Part B: Motility Analysis of a Human Semen Sample
- Sample Preparation: After liquefaction, mix the semen sample well using a vortex mixer to ensure a homogeneous suspension [53].
- Slide Preparation: Place a small drop (e.g., 5-10 µL) of the mixed sample on a clean microscope slide and cover with a coverslip.
- Microscopy and Recording: Place the slide on the microscope stage pre-warmed to 37°C. Record multiple video sequences (at least 5 fields) using a 20x objective for at least 30 seconds per field.
- CASA Processing: Upload the recorded videos to the validated CASA system for analysis.
- Data Output and Interpretation: The CASA system will generate a report. Key motility parameters to record include:
- Total Motility (%)
- Progressive Motility (%)
- Sperm Concentration (million/mL)
- Curvilinear Velocity (VCL, µm/s)
- Straight-Line Velocity (VSL, µm/s)
- Average Path Velocity (VAP, µm/s)
The following diagram illustrates the complete experimental protocol, integrating both synthetic validation and real sample analysis:
The rapid proliferation of artificial intelligence (AI), particularly deep learning (DL) models, has revolutionized numerous fields, including biomedical research. However, this progress is accompanied by a significant challenge: the "black-box" nature of these complex models, where their internal decision-making processes are opaque and not easily understandable by humans [57] [58]. In highly sensitive domains like healthcare and drug development, this opacity can hinder trust, adoption, and validation of AI systems. The demand for transparency has catalyzed the field of Explainable AI (XAI), which aims to make AI models more interpretable and their decisions more comprehensible [59] [58].
Within reproductive medicine, the application of AI for sperm analysis presents a compelling case study. Modern Computer-Aided Sperm Analysis (CASA) systems leverage sophisticated deep learning models to automatically evaluate sperm motility, morphology, and concentration [4] [60]. While these systems offer superior objectivity and throughput over manual analysis, the complexity of the underlying models, such as convolutional neural networks (CNNs) and recurrent neural networks (RNNs), creates a black-box problem [57]. For researchers, scientists, and drug development professionals, understanding how a model arrives at a specific motility classification or trajectory prediction is crucial for validating findings, improving protocols, and ultimately developing new therapeutic interventions.
Interpretability methods can be broadly categorized based on their scope and approach. The table below summarizes the core techniques relevant to motion analysis and sperm research.
Table 1: Model-Agnostic Interpretability Methods for AI Models
| Method | Scope | Primary Function | Key Advantages | Key Limitations |
|---|---|---|---|---|
| Partial Dependence Plot (PDP) [61] | Global | Shows the marginal effect of a feature on the prediction. | Intuitive; easy to implement. | Hides heterogeneous effects; assumes feature independence. |
| Individual Conditional Expectation (ICE) [61] | Local | Plots the dependence of prediction on a feature for each instance. | Uncovers heterogeneous relationships. | Can be hard to see the average effect; cluttered visuals. |
| Permuted Feature Importance [61] | Global | Quantifies a feature's importance by shuffling values and measuring error increase. | Concise; accounts for feature interactions. | Results can vary due to shuffling randomness. |
| LIME (Local Surrogate) [61] | Local | Approximates a black-box model locally with an interpretable model. | Model-agnostic; provides human-friendly explanations. | Unstable explanations; can generate unrealistic data points. |
| SHAP (Shapley Value) [61] [58] | Local & Global | Explains the contribution of each feature to an individual prediction based on game theory. | Additive and locally accurate; consistent explanations. | Computationally expensive for large datasets. |
| Global Surrogate [61] | Global | Trains an interpretable model to approximate the predictions of a black-box model. | Any interpretable model can be used; fidelity measurable. | Approximates the model, not the underlying data process. |
The choice of method often involves a trade-off between scope and fidelity. Global methods like PDP and surrogate models provide a holistic view of model behavior but may oversimplify. Local methods like LIME and SHAP offer detailed explanations for individual predictions but may not capture the model's global logic [61]. Furthermore, a persistent myth in the field is a necessary trade-off between model accuracy and interpretability. In practice, particularly with structured data, simpler, more interpretable models often achieve comparable accuracy to complex black boxes, and the insights gained from interpretation can guide better data processing, ultimately leading to superior overall performance [62].
Experimental Protocols for Interpretable Sperm Motility Analysis
This section provides a detailed protocol for implementing and interpreting a deep learning-based sperm tracking model, ensuring the analysis is both accurate and understandable.
Protocol: Interpretable Multi-Sperm Tracking with DP-YOLOv8n and SHAP
Objective: To accurately detect and track multiple sperm in a microscopic video sequence and provide interpretable explanations for the motion parameters extracted from the trajectories.
Background: Deep learning models like YOLOv8 can achieve high accuracy in sperm detection [60]. However, their black-box nature necessitates post-hoc interpretation techniques like SHAP to understand which visual features (e.g., sperm head shape, contrast) the model deems important for identification, thereby building trust in the tracking results.
Materials:
- Dataset: VISEM-Tracking dataset [60], a public sperm microscopic video dataset with annotations.
- Software: Python 3.8+, PyTorch, OpenCV, SHAP library, Ultralytics (for YOLOv8).
- Hardware: GPU-enabled workstation (e.g., NVIDIA GTX 1080 Ti or higher) for accelerated deep learning inference.
Procedure:
- Data Preprocessing:
- Resize all video frames to a uniform resolution of 640x640 pixels.
- Apply standard normalization to pixel values (0-1 range).
- Augment the training dataset using random horizontal flips and slight brightness/contrast adjustments to improve model robustness.
Model Training & Validation:
- Initialize the DP-YOLOv8n model [60], a deep sperm recognition model based on YOLOv8n.
- Train the model on the VISEM training set for 100 epochs using an Adam optimizer with a learning rate of 0.01.
- Validate the model on a held-out test set. Monitor metrics such as precision, recall, and mean Average Precision ([email protected]) until performance plateaus. A benchmark [email protected] of 86.8% is achievable [60].
Sperm Tracking & Trajectory Analysis:
- Use the ByteTrack tracking algorithm [60] on the model's detection outputs to link sperm detections across frames into continuous trajectories.
- Extract kinematic parameters (e.g., curvilinear velocity, straight-line velocity, linearity) from the resulting trajectories for motility analysis.
Model Interpretation with SHAP:
- Sample Selection: Randomly select 1000 confirmed sperm detection patches from the validation set.
- Explainer Initialization: Create a SHAP explainer object, using the trained DP-YOLOv8n model as the backbone and the selected image patches as the background data distribution.
- Explanation Generation: Calculate SHAP values for each pixel in the input image patches. This quantifies how much each pixel contributed to the model's "sperm" classification score.
- Visualization: Plot the SHAP value heatmaps (saliency maps) overlaid on the original sperm images. Regions with high positive SHAP values (colored red) are the most influential for the detection decision.
Troubleshooting:
- Low Detection Accuracy: Ensure the training dataset is sufficiently large and the annotations are precise. Consider further data augmentation or model architecture adjustments.
- Uninformative SHAP Maps: If the SHAP heatmaps are noisy, try using a larger background dataset for the explainer or smoothing the output.
Workflow Visualization: From Data to Interpretation
The following diagram illustrates the integrated experimental and interpretability pipeline for sperm motility analysis.
Diagram 1: Integrated analysis and interpretation workflow.
The Scientist's Toolkit: Essential Reagents & Materials
Table 2: Research Reagent Solutions for AI-Based Sperm Motility Analysis
| Item Name | Function / Description | Application Context in Protocol |
|---|---|---|
| VISEM-Tracking Dataset [60] | A public, annotated multimodal dataset of human sperm microscopy videos and associated data. | Serves as the primary benchmark dataset for training the DP-YOLOv8n detection model and validating the full pipeline. |
| DP-YOLOv8n Model [60] | A deep learning object detection model based on YOLOv8, optimized for robust sperm head detection in complex scenes. | The core detection component in the protocol; outputs bounding box coordinates for each sperm in a frame. |
| ByteTrack Algorithm [60] | A simple, online, and real-time multi-object tracking algorithm that associates detections across frames. | Links the frame-level detections from DP-YOLOv8n into continuous sperm trajectories for motility analysis. |
| SHAP (SHapley Additive exPlanations) [61] [58] | A game theory-based approach to explain the output of any machine learning model. | The post-hoc interpretation tool used to generate saliency maps, explaining the features driving the detection model's predictions. |
| YOLOv8n Network | The foundational neural network architecture upon which the specialized DP-YOLOv8n is built. Provides a balance between speed and accuracy. | The base model structure that is modified and trained on sperm data to create the final DP-YOLOv8n detector. |
The integration of artificial intelligence (AI), particularly deep learning, into sperm morphology analysis represents a paradigm shift in male fertility diagnostics. While these technologies promise enhanced objectivity and throughput, their clinical translation is critically dependent on solving the dual challenges of standardization and generalizability [63]. A model demonstrating exceptional performance in a controlled, single-laboratory environment often fails when confronted with the vast heterogeneity of clinical data across different hospitals and populations. This protocol outlines a comprehensive framework for developing and validating AI-driven sperm analysis systems that maintain consistent, reliable, and generalizable performance, ensuring their utility in real-world clinical settings.
Current Challenges in Model Generalization
The deployment of AI models in diverse clinical environments is hindered by several key factors:
- Lack of Standardized Datasets: A primary obstacle is the absence of large, high-quality, and diversified annotated datasets. Models trained on limited or homogenous data fail to generalize. Variability in semen sample preparation, staining techniques, and imaging equipment across clinics introduces unwanted bias, causing models to learn site-specific artifacts rather than biologically relevant features [63]. For instance, a model trained on one type of stained image may not perform well on images with different staining protocols or from different microscope models [64].
- Algorithmic Limitations: Conventional machine learning models, which rely on handcrafted features (e.g., grayscale intensity, contour analysis), are particularly prone to performance degradation when faced with new data distributions. While deep learning automates feature extraction, its efficacy is directly proportional to the diversity and scale of the training data [63].
- The "Black-Box" Problem: The inherent complexity of deep learning models can obscure the reasoning behind their decisions, fostering skepticism among clinicians and complicating the identification of failure modes when applied to new populations [4].
Quantitative Performance of AI Models in Sperm Analysis
The following table summarizes the reported performance of various AI models, highlighting their potential while underscoring the variability in evaluation metrics and approaches.
Table 1: Performance Metrics of AI Models in Sperm Analysis
| Model Type | Key Function | Reported Performance | Dataset Used | Reference |
|---|---|---|---|---|
| Hybrid ML-ACO Framework | Fertility diagnosis from clinical/lifestyle factors | 99% accuracy, 100% sensitivity, 0.00006 sec computational time | 100 male fertility cases (UCI Repository) | [65] |
| YOLOv7 Object Detection | Bovine sperm morphology classification (6 categories) | mAP@50: 0.73, Precision: 0.75, Recall: 0.71 | 277 annotated images | [64] |
| Support Vector Machine (SVM) | Classification of sperm heads (good vs. bad) | AUC-ROC: 88.59%, Precision: >90% | >1400 sperm cells from 8 donors | [63] |
| Conventional ML (Bayesian) | Sperm head classification (4 categories) | Accuracy: 90% | Not Specified | [63] |
| Deep Learning (VGG-inspired) | Detection of acrosome, head, vacuole abnormalities | F0.5 Score: Acrosome (84.74%), Head (83.86%), Vacuoles (94.65%) | MHSMA (1,540 images) | [64] |
Protocol for Ensuring Standardization and Generalizability
This section provides a detailed, step-by-step experimental protocol for developing a generalizable deep learning model for sperm morphology analysis, using a object detection framework like YOLOv7 as an example [64].
Phase 1: Multi-Center Data Acquisition and Standardization
Objective: To create a diversified and well-annotated dataset that mirrors real-world clinical variability.
Materials:
- Sperm samples from multiple clinical sites
- Standardized sample collection kits
- Phase-contrast or bright-field microscopes (e.g., Optika B-383Phi)
- Image capture software (e.g., PROVIEW)
- Annotation software (e.g., Roboflow)
Procedure:
- Multi-Center Collaboration: Establish partnerships with at least 3-5 independent andrology laboratories. Collect semen samples from a diverse donor population regarding age, ethnicity, and fertility status.
- Standardized SOPs for Imaging: Develop and distribute detailed Standard Operating Procedures (SOPs) covering:
- Sample Preparation: Specify dilution ratios (e.g., 1:20 with Optixcell extender), slide preparation, and fixation methods (e.g., dye-free pressure and temperature fixation with a system like Trumorph) [64].
- Image Acquisition: Standardize microscope settings (e.g., 40x objective with negative phase contrast), lighting, and image resolution across all sites [64].
- Expert Annotation and Quality Control:
- A panel of experienced andrologists should annotate images according to WHO guidelines [63]. Categories should include:
Normal,Head defects,Neck/Midpiece defects,Tail defects, andExcess residual cytoplasm[64]. - Implement a quality control process where a subset of annotations from each site is cross-verified by a central lead annotator to minimize inter-observer variability [63].
- A panel of experienced andrologists should annotate images according to WHO guidelines [63]. Categories should include:
- Data Preprocessing:
Phase 2: Model Development with Generalization in Mind
Objective: To train a model that learns generalizable features of sperm morphology.
Procedure:
- Data Partitioning: Split the multi-center dataset into three distinct sets:
- Training Set (70%): Used to train the model.
- Validation Set (15%): Used for hyperparameter tuning and model selection during training.
- Hold-out Test Set (15%): Used only once for the final evaluation. Crucially, ensure this set contains data from clinical sites completely unseen during training.
- Model Selection and Training: Select a modern object detection architecture such as YOLOv7 [64]. Train the model on the training set and use the validation set to monitor for overfitting.
- Hybrid Optimization (Optional): To enhance convergence and predictive accuracy, consider integrating nature-inspired optimization algorithms like Ant Colony Optimization (ACO) for adaptive parameter tuning, as demonstrated in hybrid diagnostic frameworks [65].
Phase 3: Rigorous Validation and Performance Assessment
Objective: To objectively evaluate the model's performance and generalizability.
Procedure:
- Internal Validation: Evaluate the model on the hold-out test set from the original multi-center data. Report standard metrics including precision, recall, and mAP.
- External Validation: The most critical step for assessing generalizability. Source a completely new dataset from one or more external clinical partners that were not involved in the initial data collection. Evaluate the model on this external set without any further fine-tuning. A minimal performance drop between internal and external validation is a key indicator of robustness [63].
- Feature Importance Analysis: Employ techniques like Proximity Search Mechanism (PSM) or other Explainable AI (XAI) methods to interpret model decisions. This helps verify that the model is relying on biologically relevant features (e.g., head shape, tail integrity) rather than spurious correlations [65].
The following workflow diagram summarizes the complete experimental pipeline.
The Scientist's Toolkit: Essential Research Reagents and Materials
Table 2: Key Research Reagent Solutions for Automated Sperm Morphology Analysis
| Item Name | Function/Application | Specification/Example |
|---|---|---|
| Phase-Contrast Microscope | High-resolution imaging of live/unstained sperm cells for motility and morphology analysis. | E.g., Optika B-383Phi with 40x objective [64]. |
| Semen Extender | Dilutes and preserves semen samples post-collection, maintaining sperm viability for analysis. | E.g., Optixcell (IMV Technologies) [64]. |
| Standardized Fixation System | Immobilizes sperm without dye for consistent morphology evaluation, reducing preparation variability. | E.g., Trumorph system (pressure & temperature fixation) [64]. |
| Annotation Software | Platform for labeling and annotating sperm images to create ground-truth datasets for model training. | E.g., Roboflow [64]. |
| Deep Learning Framework | Software library used to build, train, and deploy the sperm detection and classification model. | E.g., YOLOv7 (You Only Look Once) object detection framework [64]. |
| Computational Hardware | Hardware capable of handling the intensive computations required for deep learning model training. | GPUs (Graphics Processing Units) are typically essential. |
The analysis of sperm motility, particularly irregular and hyperactivated patterns, is paramount in male fertility assessment and the development of therapeutic agents. Hyperactivation is a functionally critical motility pattern essential for fertilization, characterized by highly asymmetrical flagellar bends, increased amplitude, and decreased beating frequency [66]. This vigorous, non-linear movement is believed to facilitate sperm release from the oviduct reservoir and penetration of the egg's zona pellucida [67]. However, the inherent three-dimensionality and complexity of these patterns pose significant challenges for traditional two-dimensional analysis systems. This document outlines advanced techniques and detailed protocols to accurately capture, represent, and analyze these complex motion patterns, providing a critical toolkit for researchers and drug development professionals in reproductive biology.
Advanced Motion Representation Techniques
Overcoming the limitations of conventional two-dimensional analysis requires novel approaches to represent sperm movement. The techniques below leverage advanced imaging and computational methods to capture the full complexity of sperm motility.
3D+t Flagellar Tracking and Feature-Based Descriptors
Conventional clinical analysis often relies on tracking the sperm head, which provides only indirect information about the flagellar activity that powers motility. A more direct method involves the three-dimensional plus time (3D+t) acquisition and analysis of the entire sperm flagellum [66].
- Principle: A multi-plane imaging system captures the flagellum's position in 3D over time. The spatio-temporal motility pattern is then compactly described by a feature-based vector derived from an envelope of ellipses fitted to the flagellar waveform.
- Application: This technique has been successfully used to identify and characterize the distinct 3D flagellar beating patterns of hyperactivated sperm, which had not been previously described [66]. It provides a rich, quantitative descriptor for classifying motility patterns based on direct flagellar kinematics rather than inferred head movement.
Optical Flow for Motion Representation in Deep Learning
For applying deep learning to motility classification, a key challenge is effectively representing temporal motion information. The Optical Flow technique, specifically the Lucas-Kanade method, addresses this.
- Principle: Optical flow is estimated between consecutive frames in a video sequence, calculating the apparent motion of brightness patterns. This motion information is compressed into a single image that encapsulates the direction and magnitude of sperm movement over a short period (e.g., one second) [68].
- Application: This generated optical flow image serves as the input to a Deep Convolutional Neural Network (DCNN). This allows the DCNN to interpret motion patterns directly, rather than relying on static frames, leading to highly accurate classification of sperm into World Health Organization (WHO) motility categories [68].
Novel Motion Representation (MotionFlow)
A more recent approach proposes a new visual representation of sperm cell motion under a microscope, termed MotionFlow [5]. While specific details are not provided, this method is designed to extract motion information that is then processed by deep neural networks to estimate motility and morphology, reportedly outperforming other state-of-the-art solutions [5].
Table 1: Comparison of Advanced Motion Representation Techniques
| Technique | Primary Data Source | Key Output | Key Advantage | Reported Performance |
|---|---|---|---|---|
| 3D+t Flagellar Tracking [66] | 3D+time flagellar centerline | Feature-based vector (envelope of ellipses) | Directly characterizes the hyperactive 3D flagellar beat; removes subjectivity. | Accurately differentiated non-hyperactivated from hyperactivated 3D motility patterns. |
| Optical Flow (Lucas-Kanade) [68] | 2D video recordings | Motion-compressed image for DCNN input | Effectively captures temporal dynamics for deep learning models. | MAE of 0.05 for 3-category (progressive, non-progressive, immotile) model; Pearson's r=0.88 for % progressive motility. |
| MotionFlow [5] | 2D video recordings | Motion representation for deep neural networks | A new, efficient representation for joint motility and morphology estimation. | Mean Absolute Error of 6.842% for motility and 4.148% for morphology estimation. |
Experimental Protocols
The following sections provide detailed application notes and step-by-step protocols for implementing the described techniques.
Protocol 1: 3D+t Analysis of Hyperactivated Flagellar Motility
This protocol details the methodology for acquiring and analyzing 3D flagellar beating patterns to classify hyperactivated motility [66].
Materials and Equipment
- Microscope: Inverted microscope (e.g., Olympus IX71) on an optical table.
- Objective: 60X water immersion objective (e.g., Olympus UIS2 LUMPLFLN 60X W, N.A.=1.00).
- Piezoelectric Device: P-725 attached to the objective for high-speed Z-axis oscillation.
- High-Speed Camera: Capable of ≥5000 fps at 640 x 480 resolution (e.g., NAC Q1v).
- Sample Media: Capacitating media (e.g., Ham's F-10 with 5 mg/mL BSA and 25 mM NaHCO₃) and non-capacitating control media.
- Software: For 3D centerline reconstruction, tracking, and feature extraction.
Step-by-Step Procedure
- Sample Preparation: Collect human semen samples from healthy donors under informed consent. Select highly motile sperm via a swim-up procedure. Incubate the separated sperm in capacitating media at 37°C in 5% CO₂ for at least 1 hour. Use sperm in non-capacitating media as a control.
- System Setup: Mount the piezoelectric device to the objective. Set the piezoelectric to oscillate at a frequency of 90 Hz with an amplitude of 20 µm. Synchronize the camera and the piezoelectric device using a function generator.
- Image Acquisition: Place a droplet of the sperm suspension on a pre-heated slide maintained at 37°C. Using the high-speed camera, record multifocal image stacks at a frame rate of 5000-8000 fps for 3.4-5.4 seconds. Ensure the temperature is maintained at 37°C throughout the recording.
- 3D Waveform Segmentation: Reconstruct the 3D centerline of the sperm flagellum from the acquired multifocal image stacks using established segmentation software [66].
- Feature Extraction: For each reconstructed 3D+time flagellum, compute the feature-based descriptor. This involves fitting an envelope of ellipses to the flagellar waveform and extracting parameters from these ellipses over time.
- Classification: Perform unsupervised classification (e.g., clustering) on the extracted feature vectors from a dataset (e.g., 147 sperm cells) to identify distinct groups of beating patterns. Validate the clusters by correlating them with established biological characteristics of hyperactivation, such as high amplitude and low frequency.
Protocol 2: Deep Learning-Based Motility Classification Using Optical Flow
This protocol describes how to train a DCNN to classify sperm motility into WHO categories using optical flow representations [68].
Materials and Equipment
- Dataset: Video recordings of wet semen preparations (400x magnification). A publicly available dataset from the ESHRE External Quality Assessment Programme can be used [68].
- Ground Truth Data: Manually assessed motility data from multiple reference laboratories for training and validation.
- Computing Environment: Python with Keras and other deep learning libraries.
- Software: For optical flow calculation (e.g., Lucas-Kanade method).
Step-by-Step Procedure
- Data Preparation: Obtain a set of video clips of fresh semen samples. The corresponding manual assessments should categorize sperm motility into rapid progressive (a), slow progressive (b), non-progressive (c), and immotile (d).
- Optical Flow Calculation: For each video, compute the Lucas-Kanade optical flow for every consecutive second of footage (e.g., across 30 frames). Visualize the computed optical flow as a single image. This image becomes the input sample for the DCNN.
- Model Selection and Training: Select a DCNN architecture such as ResNet-50. Replace the final layer to match the number of output neurons (4 for categories a-d, or 3 for combined progressive (a+b), c, and d). Train the model using the Adam optimizer (e.g., learning rate 0.0004) with a loss function of Mean Absolute Error (MAE). Use ten-fold cross-validation to ensure robustness.
- Model Evaluation: Evaluate the trained model on a held-out test set. Compare the DCNN-predicted proportions of sperm in each motility category to the manual ground truth using MAE and Pearson's correlation coefficient. Generate difference plots (Bland-Altman) to visualize agreement.
Protocol 3: Pharmacological Induction of Hyperactivation
This protocol is used to experimentally induce hyperactivation in uncapacitated sperm to study the specific role of this motility pattern, for instance, in sperm release from oviduct glycans [67].
Materials and Equipment
- Hyperactivation Inducers:
- cBiMPS (cell-permeable cAMP analog): 50-100 µM stock in DMSO.
- 4-Aminopyridine (4-AP, CatSper activator): 2-4 mM stock in DMSO.
- Procaine (CatSper activator): 2.5-5 mM stock in DMSO.
- Progesterone: 80 nM stock in DMSO.
- Media: dmTALP (a modified Tyrode's solution for sperm capacitation).
- Analysis Tools: CASA system (e.g., Hamilton Thorne) and high-speed video microscopy.
Step-by-Step Procedure
- Sperm Preparation: Collect and extend semen. Wash sperm through a Percoll cushion and resuspend the resulting pellet in dmTALP. Confirm initial motility is >75%.
- Induction of Hyperactivation: Aliquot the sperm suspension and treat with one of the hyperactivation-inducing compounds (cBiMPS, 4-AP, procaine, progesterone) or a vehicle control (DMSO in dmTALP). Incubate at 39°C for 30 minutes.
- Motility Confirmation: Assess motility using a CASA system. Analyze at least 5 random fields per condition, evaluating a minimum of 100 cells. Confirm the presence of hyperactivated motility patterns using high-speed video microscopy.
- Functional Assay (e.g., Sperm Release): Pre-load a chamber with immobilized oviduct glycans (e.g., suLeX or bi-SiaLN). Allow sperm to bind to the glycans. Add the hyperactivation-inducing compound or vehicle control and monitor the release of bound sperm over time.
Table 2: Reagents for Pharmacological Induction of Hyperactivation
| Reagent | Working Concentration | Mechanism of Action | Key Function in Protocol |
|---|---|---|---|
| cBiMPS [67] | 50 - 100 µM | Cell-permeable cAMP analog | Mimics intracellular cAMP signaling, a key pathway in capacitation and hyperactivation. |
| 4-Aminopyridine (4-AP) [67] | 2 - 4 mM | Activates CatSper channels | Increases calcium influx through CatSper, directly triggering hyperactive motility. |
| Procaine [67] | 2.5 - 5 mM | Activates CatSper channels | Induces hyperactivation by modulating calcium influx, uncoupling it from other capacitation events. |
| Progesterone [67] | 80 nM | Binds ABHD2, activates CatSper | Uses a physiological trigger to induce hyperactivation, relevant to female tract signaling. |
| Dimethyl Sulfoxide (DMSO) | Equivalent volume | Solvent vehicle | Serves as a negative control to ensure effects are from the inducer and not the solvent. |
The Scientist's Toolkit: Research Reagent Solutions
This section lists essential materials and reagents used in the featured experiments for analyzing complex sperm motion.
Table 3: Essential Research Reagents and Materials for Motion Analysis
| Item | Specification / Example | Critical Function |
|---|---|---|
| Capacitating Media [66] [67] | Ham's F-10 with BSA (e.g., 5 mg/mL) and NaHCO₃ (e.g., 25 mM) | Provides a biochemical environment that supports the capacitation process, leading to hyperactivation. |
| High-Speed Camera [66] | NAC Q1v; 5000-8000 fps, 640x480 resolution | Captures high-temporal-resolution images necessary for analyzing rapid flagellar beats and head movements. |
| Piezoelectric Device [66] | Physik Instruments P-725 | Enables rapid Z-axis oscillation of the microscope objective for 3D multifocal imaging. |
| CASA System [68] [67] | Hamilton Thorne Semen Analysis System | Provides standardized, automated quantitative analysis of sperm concentration, motility, and kinematics. |
| Ubiquitin-Proteasome System (UPS) Inhibitors [67] | e.g., MG132 | Used to investigate the role of protein degradation in hyperactivation and sperm release processes. |
| CatSper Inhibitors [67] | e.g., RU1968 | Pharmacological tools to block CatSper channel function and confirm its role in hyperactivation. |
| Deep Learning Framework [68] | Keras with TensorFlow backend | Provides the software environment for building, training, and evaluating DCNN models for motility classification. |
| Optical Flow Algorithm [68] | Lucas-Kanade method | Converts temporal video information into a static motion representation usable by deep learning models. |
The integration of novel technological methods with established clinical protocols represents a paradigm shift in Assisted Reproductive Technology (ART). The core objective of workflow optimization in this context is to enhance efficiency, standardize procedures, and improve key performance indicators (KPIs) such as fertilization and blastulation rates, while minimizing procedural variability and embryologist fatigue. This is particularly critical for complex procedures like Intracytoplasmic Sperm Injection (ICSI), where precision is paramount. Recent advancements are primarily driven by artificial intelligence (AI), robotics, and advanced data analytics, which together create a more controlled and predictable laboratory environment [69] [70].
A foundational principle of optimizing IVF laboratory workflows is the critical importance of procedural timings. A large-scale retrospective study analyzing 7,986 ICSI cycles demonstrated that the interval from ovulation trigger to oocyte denudation is a significant factor influencing the mean blastulation rate (m-BR). The study found a consistent decline in m-BR with each additional hour of delay within a 36-44 hour window, with a more pronounced effect beyond the 40-hour threshold [71]. This evidence underscores that workflow optimization is not merely about speed but about the precise synchronization of biological and laboratory events.
Novel Methods for Sperm Analysis and Selection
The initial stage of ART, specifically sperm analysis and selection, has been revolutionized by computer-assisted and AI-driven technologies. These methods address the significant subjectivity and limitations of manual assessments.
Computer-Aided Sperm Analysis (CASA) and AI
Traditional CASA systems have provided automated, objective evaluations of sperm concentration, motility, and morphology for years [4] [60]. However, the integration of modern AI, particularly deep learning (DL), has dramatically enhanced their capabilities. AI-powered CASA systems can now analyze sperm motility patterns, morphology, and even DNA integrity with superior accuracy and consistency, identifying subtle predictive patterns not discernible through human observation [4].
A key innovation in this domain is the development of advanced multi-sperm dynamic tracking algorithms. These algorithms address the challenge of accurately tracking individual sperm in high-density samples with frequent collisions and complex paths. One such method is based on an Interacting Multiple Model (IMM) framework, which combines different motion models (e.g., Singer and Constant Turn models) to better predict sperm behavior in complex scenarios [60]. The workflow for this advanced tracking is detailed in the diagram below:
Diagram 1: AI-powered multi-sperm dynamic tracking workflow.
Experimental Protocol: AI-Based Sperm Motility and Tracking Analysis
Objective: To automatically detect, track, and analyze sperm motility parameters from microscopic video sequences using a deep learning-based Interacting Multiple Model (IMM) method.
Materials:
- Fresh semen sample.
- Phase-contrast microscope with a video recording system.
- Computer workstation with GPU.
- VISEM or similar annotated sperm dataset for model training [60].
Methodology:
- Sample Preparation: Prepare a diluted semen sample on a Makler chamber or glass slide according to standard andrology protocols.
- Video Acquisition: Record a 1-2 minute video of the sample under 200x magnification. Ensure even illumination and minimal background debris.
- Sperm Detection:
- Employ the DP-YOLOv8n deep learning model, an optimized version of YOLOv8n for sperm head detection.
- The model incorporates GSConv convolution and a Slim-neck structure to balance accuracy and real-time performance, achieving a reported [email protected] of 86.8% [60].
- Multi-Sperm Tracking:
- Input the frame-by-frame sperm detection data into the IMM-based tracking algorithm.
- The IMM algorithm interactively weights the predictions of the Singer model (for quasi-random motion) and the Constant Turn (CT) model (for curved paths) to generate a robust state estimation for each sperm [60].
- The ByteTrack algorithm then associates detections across frames to form complete trajectories, even for brief occlusions.
- Data Analysis: Calculate standard CASA parameters (e.g., curvilinear velocity, straight-line velocity, linearity) from the reconstructed sperm trajectories.
Research Reagent Solutions for Sperm Analysis
Table 1: Essential reagents and materials for advanced sperm analysis.
| Item | Function/Description |
|---|---|
| DP-YOLOv8n Model | A deep learning model for accurate sperm head detection in microscopic images [60]. |
| IMM-Based Tracking Algorithm | Software for robust multi-sperm trajectory prediction in complex motion scenarios [60]. |
| VISEM Dataset | A public, multimodal dataset of sperm videos and associated data for training and validation [60]. |
| Computer-Assisted Semen Analysis (CASA) System | An automated system for objective assessment of sperm concentration, motility, and kinematics [4]. |
| Phase-Contrast Microscope with Video | Essential hardware for visualizing and recording sperm movement for subsequent analysis. |
Integrating Novel Methods into ICSI Workflows
The pinnacle of precision in ART is the ICSI procedure. The integration of robotics and AI here aims to standardize the most delicate manual step: the injection of a single sperm into an oocyte.
Robotic and Remotely Operated ICSI Systems
Fully automated and digitally controlled ICSI systems represent a breakthrough in embryology. These systems use a robotic gripper to securely hold the oocyte while a micropipette performs the injection with calibrated, micron-level accuracy. This setup minimizes the risk of oocyte damage, a variable in manual ICSI, by stabilizing the cell and eliminating human tremor [72] [70].
A landmark case report demonstrated the first live birth following a remotely operated ICSI procedure [72]. This technology allows embryologists to supervise and perform the procedure digitally, potentially reducing physical fatigue and enabling consistent performance regardless of operator workload or experience. The system integrates with AI tools for sperm selection, creating a fully objective and standardized fertilization process [70].
Optimizing the IVF Lab Environment with Advanced Workstations
The physical laboratory environment is crucial for maintaining gamete and embryo viability during handling. Modern ART workstations are engineered to optimize workflow efficiency and sample safety. Key features include:
- Integrated Transient Incubation Chambers: These small, gas- and temperature-regulated chambers within the workstation maintain optimal conditions for gametes/embryos outside the main incubator. This significantly reduces environmental stress and minimizes the need for constant incubator opening, thereby stabilizing the culture environment [73].
- Vibration-Dampening Tables: Essential for ICSI, these tables stabilize micromanipulators to ensure precise control during injection [73].
- HEPA/ULPA Filtration: Provides an ISO Class 3 air cleanliness environment, protecting samples from particulate and airborne contamination [73].
- Ergonomic Design: Adjustable height settings and optimized layouts reduce physical strain on embryologists during prolonged procedures, indirectly enhancing procedural consistency [73].
Beyond specific procedures, a global approach to lab management using electronic witnessing systems and data analytics can yield significant insights.
A critical finding from large-data studies is that while daily workload per embryologist does not significantly impact blastulation rates, procedural timings are profoundly important [71]. This suggests that labs can manage high volumes effectively provided they coordinate schedules to meet ideal biological windows.
The following diagram synthesizes the key stages of an optimized, integrated IVF/ICSI workflow, highlighting where novel technologies and data-driven checkpoints are integrated:
Diagram 2: Integrated clinical workflow for IVF/ICSI with optimization checkpoints.
Key Performance Indicators and Data Management
Quantitative data is essential for continuous quality control. The following table summarizes critical metrics and findings from recent research:
Table 2: Key quantitative data for IVF/ICSI workflow optimization.
| Parameter | Impact on Outcome | Optimization Insight | Source |
|---|---|---|---|
| Trigger-to-Denudation Interval | Each additional hour (36-44h range) associated with a -1.6% decline in mean Blastulation Rate (m-BR). | Prioritize scheduling to keep interval below 40 hours. | [71] |
| Lab Workload | No significant association found between the number of daily procedures per operator and m-BR. | Workflow efficiency allows high volume without compromising quality. | [71] |
| AI Sperm Detection ([email protected]) | DP-YOLOv8n model achieved 86.8% accuracy on VISEM-1 dataset. | High-accuracy detection is feasible for automated CASA. | [60] |
| Robotic ICSI | First live birth reported; offers micron-level accuracy and reduced oocyte damage. | A viable technology for enhancing standardization and precision. | [72] [70] |
The integration of novel methods, including AI-driven sperm analysis, robotic ICSI, and data-driven lab management, into established IVF and ICSI protocols marks a significant leap toward a future of highly precise, efficient, and personalized reproductive medicine. The evidence indicates that success is not solely dependent on adopting individual technologies but on their synergistic integration within a framework that respects critical biological timings and optimizes the entire laboratory ecosystem. By leveraging these tools, clinics and researchers can standardize procedures, reduce variability, and ultimately improve the consistency and success of fertility treatments.
Benchmarking Performance: Validating New Techniques Against Clinical Gold Standards
This document provides application notes and protocols for using Mean Absolute Error (MAE) and Cross-Validation to evaluate the accuracy of predictive models in scientific research, with a specific focus on motion representation techniques for sperm analysis. These methodologies are crucial for ensuring that computational models generalize effectively to new, unseen data, thereby producing reliable and biologically meaningful results.
In the domain of sperm analysis research, quantitative assessment of motility and other dynamic parameters is fundamental. The reliability of these assessments depends heavily on the robust evaluation of the computational models and algorithms employed. Mean Absolute Error provides a straightforward measure of prediction accuracy, while Cross-Validation offers a framework for rigorously testing a model's generalizability, helping to flag critical issues like overfitting or selection bias [74].
Using these metrics is particularly advantageous with healthcare data, which are often "comparatively small to moderately sized, costly to obtain, or restricted by privacy and regulatory concerns" [75]. Cross-validation makes efficient use of all available data for both model development and evaluation.
Quantitative Data and Performance Metrics
Mean Absolute Error (MAE)
Mean Absolute Error is a fundamental metric for regression tasks, calculating the average magnitude of errors between predicted and observed values, without considering their direction. In the context of sperm motility analysis, this could be applied to predicting velocity parameters or the proportion of motile sperm in a sample.
- Calculation: The MAE is computed as the average of the absolute differences between the predicted values (ŷᵢ) and the actual values (yᵢ) across n observations.
- Interpretation: A lower MAE indicates better model accuracy. It is expressed in the same units as the target variable, making it intuitively easy to understand.
Metrics for Classification and Object Detection
While MAE is suited for continuous outcomes, sperm analysis often involves classification (e.g., motile vs. non-motile) or object detection (identifying and tracking individual sperm). Key metrics for these tasks are summarized in Table 1 below [76] [77].
Table 1: Key Performance Metrics for Classification and Object Detection
| Metric | Formula | Interpretation and Use Case |
|---|---|---|
| Accuracy | (TP+TN) / (TP+TN+FP+FN) | General performance for balanced datasets. Avoid for imbalanced data [76]. |
| Precision | TP / (TP+FP) | Importance when false positives are costly. Measures the accuracy of positive predictions [76] [77]. |
| Recall (True Positive Rate) | TP / (TP+FN) | Vital when missing a positive case (false negative) is critical. Measures the ability to find all positive instances [76] [77]. |
| F1 Score | 2 × (Precision×Recall) / (Precision+Recall) | Harmonic mean of precision and recall. Provides a single balanced metric, especially useful for imbalanced datasets [76] [77]. |
| Intersection over Union (IoU) | Area of Overlap / Area of Union | Measures the accuracy of object localization by quantifying the overlap between a predicted bounding box and the ground truth [77]. |
| Mean Average Precision (mAP) | Average of AP across all classes | A comprehensive metric for object detection that averages precision values across all recall levels and multiple object classes [77]. |
Cross-Validation: Protocols for Robust Evaluation
Cross-validation is a class of model validation techniques used to assess how the results of a statistical analysis will generalize to an independent dataset. Its core purpose is to test the model's ability to predict new data that was not used in estimating it [74]. The following section outlines standard protocols for its implementation.
Standard K-Fold Cross-Validation
K-fold cross-validation is one of the most commonly used methods [78] [74] [75].
Table 2: Protocol for K-Fold Cross-Validation
| Step | Action | Details and Considerations |
|---|---|---|
| 1. Partitioning | Randomly shuffle the dataset and split it into k equal-sized subsets (folds). | Common values for k are 5 or 10 [74]. For clinical data with rare outcomes, use stratified k-fold to ensure equal outcome rates across folds [75]. |
| 2. Iteration | For each of the k folds: a) Treat the current fold as the validation set. b) Use the remaining k-1 folds as the training set. | This process is repeated k times, with each fold used exactly once as the validation set [74]. |
| 3. Training & Validation | Train the model on the training set and evaluate it on the validation set. | Store the performance metric (e.g., MAE) for that fold. |
| 4. Aggregation | Compute the final performance estimate by averaging the results from all k iterations. | The average error across all k trials is computed, which generally provides a more reliable estimate than a single holdout test [78]. |
Diagram 1: K-Fold Cross-Validation Workflow
Leave-One-Out Cross-Validation (LOOCV)
Leave-one-out cross-validation is a special case of k-fold cross-validation where k is set equal to the number of data points (N) in the dataset [78] [74].
- Procedure: A single data point is used as the validation set, and the remaining N-1 points are used as the training set. This process is repeated N times such that each data point is used once for validation.
- Advantage: It maximizes the training data used in each iteration and provides an almost unbiased estimate of the model's performance.
- Disadvantage: It is computationally expensive, as the model must be trained N times. However, for certain locally weighted learners, it can be computationally efficient [78].
Nested Cross-Validation for Model Tuning
A advanced protocol involves nested cross-validation (or double cross-validation), which is used when both model selection and hyperparameter tuning are required [75].
Diagram 2: Nested Cross-Validation for Hyperparameter Tuning
This method features an inner loop (e.g., k-fold CV) within an outer loop (e.g., another k-fold CV). The inner loop is responsible for hyperparameter tuning on the training fold from the outer loop, and the outer loop provides an unbiased performance estimate of the final tuned model. This protocol "reduces optimistic bias but comes with additional computational challenges" [75].
Application in Sperm Analysis Research
Case Study: Validating Sperm Motility Measurements
A critical application of these evaluation metrics is in validating Computer-Assisted Sperm Analysis (CASA) systems. A 2024 study introduced the "Motility Ratio method" to objectively validate the reliability of sperm motility assessments [79].
- Experimental Objective: To determine whether commonly used analysis slides (e.g., LEJA, MAKLER, coverslip) provide accurate motility measurements or introduce systematic bias.
- Protocol: Bovine and porcine semen samples were split. One fraction (A) was kept alive (theoretical 100% motility), and the other (B) was killed (theoretical 0% motility). A range of samples with known theoretical motility (e.g., 0%, 25%, 50%, 75%, 100%) was created by mixing fractions A and B [79].
- Validation: The measured motility from the CASA system was compared against the theoretical motility for each slide type. The agreement was quantified using metrics like the Concordance Correlation Coefficient, and the bias was assessed.
- Key Finding: The LEJA slide showed the lowest bias, while the MAKLER and coverslip methods showed significantly higher bias, demonstrating that the "best" (highest) motility results do not always reflect the "true" motility [79]. This underscores the necessity of rigorous validation.
The Scientist's Toolkit: Research Reagent Solutions
Table 3: Essential Materials for Sperm Motility Validation Experiments
| Item | Function/Description | Example from Literature |
|---|---|---|
| CASA System | Automated device for quantifying sperm concentration, motility, and kinematic parameters. | IVOS II was used with specific settings for bovine (Qualivet setup) and porcine spermatozoa [79]. |
| Analysis Slides & Chambers | Standardized chambers of specific depths to hold semen for microscopic analysis. | LEJA slide (20 µm depth), MAKLER chamber (10 µm depth), and microscope slide with coverslip were compared [79]. |
| Semen Extenders/Diluents | Media used to dilute semen to an optimal concentration for analysis while maintaining sperm viability. | OptiXcell, EasyBuffer B, NUTRIXcell Ultra, TRIXcell Plus [79]. |
| Motility Ratio Samples | Internally controlled samples with known proportions of motile and immotile sperm. | Created by mixing a fully motile fraction (A) with a fully immotile fraction (B) killed by freeze-thawing [79]. |
Integrating Mean Absolute Error and Cross-Validation into the developmental pipeline of algorithms for sperm analysis is not merely a technical formality but a cornerstone of rigorous science. These protocols guard against over-optimistic performance reports and ensure that models and measurement systems are robust, reliable, and generalizable. As the field moves towards increasingly automated and AI-driven analysis, a steadfast commitment to these rigorous evaluation standards will be paramount for generating clinically and biologically meaningful results.
Comparative Analysis: AI-Driven CASA vs. Manual Analysis and Traditional CASA
The quantitative analysis of sperm motility, morphology, and concentration is a cornerstone of male fertility assessment. For decades, this relied on manual microscopy, a method fraught with subjectivity and inter-observer variability. The advent of Computer-Aided Sperm Analysis (CASA) systems introduced a level of standardization and quantification, automating the tracking of sperm movement and morphology. Today, the field is undergoing a second revolution with the integration of Artificial Intelligence (AI), particularly deep learning, into next-generation CASA platforms. This application note provides a comparative analysis of these three methodologies—Manual Analysis, Traditional CASA, and AI-Driven CASA—framed within the context of motion representation techniques for sperm analysis research. It details experimental protocols and provides a scientific toolkit for researchers and drug development professionals evaluating these technologies.
The following tables summarize key performance metrics and characteristics of the three sperm analysis methodologies, based on recent literature and comparative studies.
Table 1: Comparative Analysis of Technical Performance and Agreement
| Parameter | Manual Analysis (Gold Standard) | Traditional CASA | AI-Driven CASA | Notes & Sources |
|---|---|---|---|---|
| Concentration (ICC) | 1.00 (Reference) | Moderate (e.g., 0.723 - 0.842) [80] | Data Inferred (See Motility) | LensHooke X1 Pro showed good agreement (ICC: 0.842), others moderate [80]. |
| Total Motility (ICC) | 1.00 (Reference) | Poor to Moderate (0.417 - 0.634) [80] | Improved Performance | CEROS II showed moderate agreement (ICC: 0.634); others were poor [80]. AI reduces fitting errors [81]. |
| Morphology (ICC) | 1.00 (Reference) | Poor (0.160 - 0.261) [80] | High Potential for Improvement | Tested traditional CASA systems showed poor consistency with manual morphology [80]. AI excels in image-based pattern recognition [4]. |
| Fitting/Analysis Error | Not Applicable | Baseline | Remarkable reduction (up to 70%, avg. 45%) [81] | Genetic Algorithms (a type of AI) significantly outperformed traditional Fourier analysis in flagellar parameter fitting [81]. |
| Diagnostic Agreement (κ) - Oligozoospermia | 1.00 (Reference) | Moderate to Substantial (0.588 - 0.701) [80] | Data Needed | LensHooke X1 Pro (κ=0.701) and CEROS II (κ=0.664) showed substantial agreement [80]. |
| Diagnostic Agreement (κ) - Asthenozoospermia | 1.00 (Reference) | Fair to Moderate (0.157 - 0.405) [80] | Data Needed | LensHooke X1 Pro showed moderate agreement (κ=0.405); others were fair or poor [80]. |
Table 2: Comparative Analysis of Operational and Functional Characteristics
| Characteristic | Manual Analysis | Traditional CASA | AI-Driven CASA |
|---|---|---|---|
| Throughput | Low | Medium | High [22] [4] |
| Objectivity | Low (Subjective) | Medium (Algorithm-dependent) | High (Data-driven) [4] |
| Standardization | Low (Requires extensive training) | Medium (Varies by system/settings) | High (Consistent model application) [4] |
| Cost | Low (Equipment) | High (Equipment) | High (Equipment/Development) |
| Key Strengths | Gold standard; low equipment cost. | Quantifies motility parameters; reduces some subjectivity. | Detects subtle patterns; high consistency; automates complex tasks [4]. |
| Key Limitations | Time-consuming; subjective; high variability. | Poor morphology analysis; cell collision errors [22] [80]. | "Black-box" nature; requires large, annotated datasets [4]. |
Experimental Protocols for Sperm Motion Analysis
Protocol: Manual Sperm Analysis per WHO Guidelines
This protocol establishes the gold standard against which automated systems are often validated [80].
- Objective: To perform a standardized assessment of sperm concentration, motility, and morphology manually.
- Materials:
- Fresh, liquefied semen sample
- Improved Neubauer hemocytometer
- Microscope with phase contrast (400x magnification) and oil immersion (1000x magnification)
- Incubator maintained at 37°C
- Disposable counting chambers (e.g., Leja slides)
- Staining solutions for morphology (e.g., Diff-Quik)
- Timer
- Procedure:
- Sample Preparation: Allow the semen sample to fully liquefy at 37°C for 20-30 minutes. Mix the sample gently but thoroughly to ensure homogeneity.
- Motility Analysis: a. Place a 10µL aliquot of the sample on a clean counting chamber and transfer to the pre-warmed microscope stage. b. Systematically count at least 200 spermatozoa across multiple fields. c. Categorize each spermatozoon as: Progressive Motile (PR), Non-Progressive Motile (NP), or Immotile (IM). d. Calculate the percentage for each category.
- Concentration Analysis: a. Dilute the semen sample 1:20 with a diluent that immobilizes sperm (e.g., sodium bicarbonate-formalin). b. Load the diluted sample into the Neubauer hemocytometer. c. Count the spermatozoa in the designated squares under 400x magnification. d. Calculate the concentration (sperm/mL) using the standard hemocytometer formula.
- Morphology Analysis: a. Prepare a thin smear of the semen sample on a glass slide and allow it to air dry. b. Stain the smear using a modified Papanicolaou or Diff-Quik method. c. Under 1000x oil immersion, evaluate at least 200 spermatozoa for abnormalities in the head, midpiece, and tail. d. Calculate the percentage of morphologically normal forms.
Protocol: Traditional CASA Motility and Morphometry
This protocol outlines the use of standard CASA systems for automated parameter extraction.
- Objective: To automatically track sperm trajectories and calculate kinematic parameters and morphometric data.
- Materials:
- Traditional CASA system (e.g., Hamilton Thorne CEROS II, LensHooke X1 Pro) [80]
- Phase contrast microscope with a heated stage (37°C)
- Digital camera (≥60 fps)
- Pre-calibrated disposable counting chambers (e.g., Leja 4-chamber slides)
- Procedure:
- System Calibration: Calibrate the CASA system using a calibration slide according to the manufacturer's instructions. Set the particle size and intensity thresholds for accurate sperm cell identification.
- Loading Sample: Pipette a small aliquot (e.g., 3-7µL) of the liquefied semen sample into the chamber, ensuring even distribution and no air bubbles.
- Data Acquisition: Place the chamber on the heated stage. Select the appropriate objective (typically 10x or 20x). Record multiple digital videos (minimum 3-5 fields, 1-2 seconds each) at a frame rate of ≥60 fps.
- Trajectory Analysis: The CASA software will automatically: a. Detect sperm heads in each frame using thresholding and image segmentation [22]. b. Track and connect sperm positions across frames to build trajectories, using algorithms like Kalman filters to handle cell collisions [22]. c. Calculate standard kinematic parameters: Curvilinear Velocity (VCL), Straight-Line Velocity (VSL), Average Path Velocity (VAP), Linearity (LIN), Amplitude of Lateral Head Displacement (ALH), etc. [22].
- Morphometry Analysis: Acquire static images of spermatozoa at high magnification. The software analyzes the silhouette of the sperm head to report measurements for length, width, area, and perimeter.
Protocol: AI-Driven Flagellar Dynamics and Viability Assessment
This protocol describes an advanced workflow leveraging AI for deep analysis of sperm motion and function.
- Objective: To employ AI models for detailed analysis of flagellar beating patterns and to identify viable sperm in severe male factor infertility cases.
- Materials:
- Procedure:
- High-Throughput Imaging: a. For flagellar analysis, use a high-speed camera to capture videos at a high frame rate to resolve the rapid flagellar beat cycle [81]. b. Alternatively, use a lens-free holographic on-chip imaging platform to capture holographic patterns of sperm cells over a large volume with sub-micron precision [22].
- AI Model Application for Flagellar Analysis: a. Input the captured image sequences into an AI model (e.g., a Genetic Algorithm or a Convolutional Neural Network). b. The model extracts key parameters of the equation approximating the flagellar shape, including beating period, bending amplitude, mean curvature, and wavelength [81]. c. The output provides a superior fit to the flagellar motion data compared to traditional Fourier analysis, enabling a more comprehensive study of sperm cell pairs and bundling phenomena [81].
- AI-Guided Sperm Selection (e.g., STAR Protocol): a. For samples with severe oligospermia or azoospermia, load the semen sample into the AI system (e.g., STAR - Sperm Tracking and Recovery) [82]. b. The system uses high-powered imaging to scan the sample, capturing millions of images. c. A trained deep learning model identifies and classifies sperm cells based on morphological normality and viability within the sea of cellular debris. d. Robotics are then used to gently capture the identified viable sperm for use in Intracytoplasmic Sperm Injection (ICSI) [82].
Visualization of Workflows and Signaling Pathways
Workflow for Comparative Sperm Analysis
- Title: Sperm Analysis Method Comparison
Signaling Pathways in Reproductive Aging
- Title: Sperm Pathways in Reproductive Aging
The Scientist's Toolkit: Research Reagent Solutions
Table 3: Essential Materials and Reagents for Advanced Sperm Analysis Research
| Item | Function/Application | Specific Example/Note |
|---|---|---|
| Disposable Counting Chambers | Standardized depth for consistent CASA and manual analysis. | Leja 4-chamber slides [80]. Ensures uniform sample thickness for accurate motility and concentration measurements. |
| Phase Contrast Microscope | Essential for visualizing unstained, motile spermatozoa in traditional CASA and manual methods. | Olympus BX43 or equivalent, with a 10x-20x objective and a heated stage (37°C) [80]. |
| CMOS Image Sensor & LED | Core components of a lens-free, holographic on-chip imaging platform [22]. | Enables high-throughput, portable 3D sperm tracking over large volumes, decoupling FOV from resolution. |
| Sperm Staining Kits | Assessing sperm viability, acrosome reaction, and DNA fragmentation. | Diff-Quik for manual morphology [80]. JC-1 dye for measuring mitochondrial membrane potential (MMP), a biomarker of sperm health [83]. |
| AI/ML Software Platforms | For developing custom sperm tracking, flagellar analysis, or classification models. | Platforms supporting Genetic Algorithms (for flagellar fitting [81]) or Deep Learning frameworks (e.g., TensorFlow, PyTorch for image analysis [4]). |
| High-Speed Camera | Capturing high-frame-rate videos for detailed flagellar beating analysis. | A camera capable of >100 fps is necessary to resolve the rapid flagellar beat cycle for AI-driven motion dynamics [81]. |
Male infertility is a significant factor in approximately 50% of couples experiencing infertility worldwide. Traditional semen analysis, which assesses parameters like concentration, motility, and morphology, provides limited information and cannot fully reflect male fertility potential. In recent years, sperm DNA fragmentation index (DFI) has emerged as a promising biomarker for assessing sperm quality and predicting outcomes in assisted reproductive technology (ART). Concurrently, advanced computational imaging and kinematic analysis have enabled detailed assessment of sperm locomotion. This application note synthesizes current research to provide a validated clinical framework for correlating advanced sperm kinematic features with DNA fragmentation levels and their collective impact on live birth rates, providing researchers and clinicians with standardized protocols for enhanced male fertility assessment.
Quantitative Data Synthesis
Correlation Between Sperm DFI and Conventional Semen Parameters
The following table summarizes key correlations between sperm DNA fragmentation index and conventional semen parameters based on recent clinical studies:
Table 1: Correlation between Sperm DFI and Conventional Semen Parameters
| Parameter | Correlation Coefficient (r) | P-value | Clinical Significance |
|---|---|---|---|
| Sperm Motility | -0.44 | 3.32e-08 | Significant negative correlation |
| Forward Movement of Sperm | -0.46 | 3.25e-09 | Significant negative correlation |
| Normal Morphology of Sperm | -0.25 | 0.000 | Significant negative correlation |
| Male Age | 0.08 | 0.31 | No significant correlation |
| Semen Volume | -0.15 | 0.05 | No significant correlation |
| Sperm Concentration | -0.16 | 0.32 | No significant correlation |
| Male Body Mass Index (BMI) | 0.02 | 0.98 | No significant correlation |
Data derived from a retrospective propensity score matching study on 162 cycles of IVF/ICSI with fresh embryo transfer (2020-2024) [84].
Impact of Sperm DFI on ART Clinical Outcomes
Table 2: Comparison of ART Outcomes Between Normal and High DFI Groups
| Outcome Parameter | Normal DFI (DFI < 30%) | High DFI (DFI ≥ 30%) | P-value |
|---|---|---|---|
| 2PN Fertilization Rate | 64.98% | 67.18% | 0.362 |
| D3 High-Quality Embryo Rate | 28.34% | 23.91% | 0.107 |
| Biochemical Pregnancy Rate | 71.60% | 71.60% | 1 |
| Clinical Pregnancy Rate | 65.00% | 65.00% | 1 |
| Delivery Rate | 50.72% | 48.44% | 0.928 |
| Miscarriage Rate | 7.25% | 6.25% | 1 |
| Singleton Birth Weight | 3,350 g | 3,200 g | 0.599 |
Data from a retrospective PSM study (n=162 cycles) showing no significant differences in fresh IVF/ICSI-ET outcomes between normal and high DFI groups [84].
Cumulative Live Birth Rates Across DFI Strata
Table 3: Cumulative Live Birth Rates by Sperm DNA Fragmentation Levels
| DFI Group | DFI Range | Conservative cLBR (IVF) | Optimistic cLBR (IVF) | Conservative cLBR (ICSI) | Optimistic cLBR (ICSI) |
|---|---|---|---|---|---|
| Group 1 | ≤10% | Reference | Reference | Reference | Reference |
| Group 2 | >10% to ≤20% | NSD | NSD | Significant decrease | Significant decrease |
| Group 3 | >20% to ≤30% | NSD | NSD | Significant decrease | Significant decrease |
| Group 4 | >30% | NSD | NSD | Significant decrease | Significant decrease |
NSD = No Significant Difference compared to Group 1 (reference). Data adapted from a retrospective study of 5050 couples (2016-2022) [85]. The negative impact of elevated DFI was more pronounced in ICSI cycles, with cumulative live birth rates showing a significant decreasing trend as DFI increased (p=0.034), particularly with advanced female age.
Experimental Protocols
Protocol 1: Sperm DNA Fragmentation Index (DFI) Assessment
Principle: The Sperm Chromatin Structure Assay (SCSA) measures DNA fragmentation based on the susceptibility of sperm nuclear DNA to acid-induced denaturation. Damaged DNA denatures more readily, forming single-stranded regions that stain differentially with acridine orange compared to double-stranded DNA in normal sperm [84].
Materials:
- Sperm nuclear integrity staining kit (e.g., Zhejiang Xingbo Biotechnology)
- Flow cytometer (e.g., Beckman Coulter)
- Sterile plastic cups for semen collection
- Incubator at 37°C (e.g., JingHong)
- Centrifuge
- Phosphate-buffered saline (PBS)
- Acridine orange staining solution
Procedure:
- Sample Collection: After 2-7 days of sexual abstinence, collect semen through masturbation into a sterile plastic cup [84].
- Liquefaction: Allow semen to liquefy completely in an incubator at 37°C for 20-30 minutes.
- Sample Preparation: Adjust sperm concentration to 1×10^6–2×10^6/mL using PBS.
- Acid Denaturation: Mix 100 μL of sperm suspension with 200 μL of acid detergent solution (pH 1.2) for 30 seconds.
- Staining: Add 600 μL of acridine orange staining solution (6 μg/mL in phosphate-citrate buffer, pH 6.0).
- Flow Cytometry Analysis: Analyze samples within 3-5 minutes of staining using flow cytometry with 488 nm excitation.
- Data Interpretation: DFI is calculated as: DFI (%) = [Red fluorescent sperm count / (Green fluorescent sperm count + Red fluorescent sperm count)] × 100% [84].
Quality Control:
- Implement internal quality control (IQC) measures throughout testing
- Participate in external quality assessment (EQA) programs
- Use standardized protocols as per WHO Laboratory Manual for the Examination and Processing of Human Semen (6th edition)
Protocol 2: Advanced Kinematic Sperm Analysis
Principle: Computational imaging techniques capture and analyze sperm movement patterns to extract kinematic parameters that correlate with functional competence. Both conventional computer-aided sperm analysis (CASA) and emerging holographic on-chip imaging platforms can be utilized [22].
Materials:
- Conventional CASA system OR
- Lensfree on-chip holographic imaging platform (CMOS sensor, LED light source)
- Sperm analysis chambers (20 μm depth for conventional CASA)
- Temperature-controlled stage (37°C)
- Sperm preparation media
Procedure for Conventional CASA:
- Sample Preparation: Prepare semen sample using discontinuous density gradient centrifugation combined with swimming-up method [84].
- Chamber Loading: Load 5-10 μL of prepared sample into a pre-warmed analysis chamber (20 μm depth).
- Image Acquisition: Record sperm movement using a digital camera attached to a phase-contrast microscope (×10-×20 objective) at frame rate >60 fps for at least 1 second.
- Software Analysis: Use sperm analysis software with detection and tracking algorithms to identify sperm heads and connect trajectories across frames.
- Parameter Calculation: The software automatically computes key kinematic parameters [22].
Procedure for Holographic On-Chip Imaging:
- Sample Placement: Position semen sample <1 mm from CMOS image sensor chip.
- Illumination: Use LED light source with large diameter aperture (100 μm) placed 4-5 cm above sample.
- Hologram Capture: Capture lensfree holographic patterns generated by interference between background illumination and light scattered from sperm cells.
- Digital Reconstruction: Process holographic patterns using back-propagation algorithms to extract amplitude and phase information of spermatozoa.
- 3D Tracking: Utilize computational methods to track sperm locomotion in 3D with submicron positioning accuracy [22].
Kinematic Parameters Measured:
- Curvilinear velocity (VCL): Instantaneous velocity along the actual path
- Average path velocity (VAP): Velocity along a smoothed average path
- Straight-line velocity (VSL): Velocity along the straight line between start and end points
- Linearity (LIN): VSL/VCL × 100%
- Straightness (STR): VSL/VAP × 100%
- Wobble (WOB): VAP/VCL × 100%
- Amplitude of lateral head displacement (ALH): Maximum width of sperm head oscillation
- Beat-cross frequency (BCF): Frequency of sperm head crossing the average path
- Fractal dimension (D): Complexity of swimming trajectory [22]
Protocol 3: Integrated Analysis Workflow
Principle: Correlate advanced kinematic parameters with DFI values and clinical outcomes to establish predictive models for ART success.
Procedure:
- Sample Collection and Processing: Collect semen samples from patients undergoing ART treatment following standardized protocols.
- Parallel Analysis: Perform both DFI assessment and kinematic analysis on each sample.
- Data Integration: Create a comprehensive dataset linking kinematic parameters, DFI values, and clinical outcomes (fertilization rate, embryo quality, pregnancy rate, live birth rate).
- Statistical Analysis:
- Perform Spearman correlation analysis between kinematic parameters and DFI values
- Use multivariate regression to identify independent predictors of ART success
- Establish receiver operating characteristic (ROC) curves for significant parameters
- Validation: Validate predictive models using independent patient cohorts with prospective follow-up.
Visualization of Experimental Workflows
Integrated Sperm Analysis Pathway
Sperm Kinematic Parameter Relationships
The Scientist's Toolkit: Research Reagent Solutions
Table 4: Essential Reagents and Materials for Sperm DFI and Kinematic Analysis
| Item | Function/Application | Example Product/Specification |
|---|---|---|
| Sperm Nuclear Integrity Staining Kit | DFI assessment via SCSA | Zhejiang Xingbo Biotechnology Kit |
| Acridine Orange | Fluorescent staining of DNA | Molecular grade, suitable for flow cytometry |
| Density Gradient Medium | Sperm preparation for ART | Vitrolife Irvine Isolate |
| Sperm Analysis Chamber | CASA sample containment | 20 μm depth, disposable |
| Flow Cytometer | DFI measurement | Beckman Coulter systems |
| Computer-Aided Semen Analyzer | Kinematic parameter measurement | SSA systems with >60 fps capability |
| Holographic On-Chip Imaging Platform | Lens-free sperm tracking | Custom systems with CMOS sensor and LED |
| Sperm Freezing Medium | Cryopreservation for biobanking | With cryoprotectants |
| Anti-oxidant Supplements | Reduce DNA fragmentation during processing | Combinations of vitamins C/E, glutathione |
Discussion and Clinical Implications
The correlation analysis between sperm DNA fragmentation and kinematic parameters reveals significant negative relationships with sperm motility (r = -0.44), forward movement (r = -0.46), and normal morphology (r = -0.25) [84]. These findings suggest that DNA damage manifests in impaired sperm function measurable through both molecular and kinematic assessments.
Notably, the impact of elevated DFI on clinical outcomes appears more pronounced in ICSI cycles compared to conventional IVF. A comprehensive study of 5050 couples demonstrated that cumulative live birth rates significantly decreased as DFI increased in ICSI patients (p = 0.034), with these effects being more marked with advanced female age [85]. This has important clinical implications for ART treatment selection and sperm processing techniques.
Advanced computational methods, including deep learning algorithms for live sperm morphological analysis and holographic on-chip imaging, now enable non-invasive multidimensional assessment of sperm quality [86] [22]. These technologies provide high-throughput analysis while maintaining accuracy comparable to manual microscopy, with reported morphological accuracy of 90.82% when validated against experienced sperm physicians [86].
The integration of DFI assessment with advanced kinematic profiling offers a more comprehensive evaluation of male fertility potential than either parameter alone. This multidimensional approach may enhance patient stratification, inform ART protocol selection, and improve predictive models for live birth outcomes, ultimately advancing personalized treatment in reproductive medicine.
Traditional two-dimensional (2D) computer-aided sperm analysis (CASA) has long relied on velocity parameters as primary indicators of sperm health and fertility potential. However, emerging research demonstrates that the complex, three-dimensional (3D) nature of sperm motility contains richer diagnostic information that 2D analysis fails to capture. This application note examines the superior diagnostic value of 3D helical parameters—specifically helical period and radius—over conventional 2D speed measurements. By providing detailed protocols for 3D data acquisition, processing, and analysis, we equip researchers with the methodologies needed to leverage these more physiologically relevant motility descriptors. The transition to 3D motion analysis represents a paradigm shift in sperm assessment, offering enhanced predictive power for fertility outcomes and enabling more precise selection of gametes for assisted reproductive technologies.
Human spermatozoa navigate complex 3D environments within the female reproductive tract, yet conventional analysis has been largely confined to 2D assessments. Traditional CASA systems measure parameters like curvilinear velocity (VCL), straight-line velocity (VSL), and average path velocity (VAP) in restricted 2D planes [22]. While useful, these metrics provide an incomplete picture of sperm motility, as they cannot capture the crucial helical components of movement that are essential for successful navigation and fertilization.
The helical motion of sperm flagella generates propulsive forces through 3D space, creating characteristic swimming patterns with identifiable helical periods and radii. These 3D parameters are particularly valuable for identifying hyperactivated sperm—a motility pattern essential for fertilization characterized by increased asymmetry and amplitude of flagellar beating [12] [50]. Recent advances in multifocal imaging, computational holography, and agent-based modeling now enable researchers to quantify these 3D motility patterns with unprecedented precision [12] [22] [87].
This application note details methodologies for extracting and analyzing 3D helical parameters, establishing their superiority over conventional 2D speed measurements for predicting sperm functionality and fertilization competence.
Comparative Analysis: 2D Speed vs. 3D Helical Parameters
Limitations of Conventional 2D Speed Analysis
Traditional 2D CASA systems, while widely used, impose significant limitations on sperm motility assessment. These systems typically utilize chambered slides with depths of ~20μm, which artificially restrict sperm movement and force essentially 3D swimmers into predominantly 2D motion [22]. This confinement alters natural swimming behaviors and masks important motility patterns critical for assessing sperm function.
The most commonly measured 2D parameters—VCL, VSL, VAP, linearity (LIN), and amplitude of lateral head displacement (ALH)—provide limited information about the flagellar beating patterns that generate propulsion. Furthermore, 2D analysis struggles to distinguish hyperactivated sperm, which display characteristically wide, asymmetric flagellar beats in 3D space, from other motility patterns [50]. This limitation has clinical significance, as hyperactivation is a crucial biological process marking the sperm's final maturation steps and preparing it for potential fertilization [12].
Table 1: Comparison of 2D Speed and 3D Helical Motion Analysis
| Parameter | 2D Speed Analysis | 3D Helical Motion Analysis |
|---|---|---|
| Spatial Context | Restricted to 2D plane | Volumetric, reflecting natural swimming environment |
| Key Metrics | VCL, VSL, VAP, LIN, ALH | Helical period, helical radius, rotational speed |
| Hyperactivation Detection | Limited, based on derived parameters | Direct identification via characteristic wide, asymmetric beats |
| Flagellar Assessment | Indirect inference from head movement | Direct 3D flagellar kinematics and beating patterns |
| Environmental Relevance | Low (artificially confined) | High (reflects complex female reproductive tract) |
| Predictive Value for Fertility | Moderate | Enhanced, enables identification of functional subpopulations |
Diagnostic Superiority of 3D Helical Parameters
Three-dimensional analysis of sperm motility captures the essential helical components of movement that are invisible in 2D assessment. The helical period (time for one complete rotation) and helical radius (amplitude of the helical path) provide direct insights into flagellar function and energy efficiency [12]. These parameters are particularly valuable for identifying hyperactivated sperm, which exhibit significantly larger helical radii and altered helical periods compared to progressively motile sperm.
Research using the 3D-SpermVid dataset—a repository of 121 multifocal video-microscopy hyperstacks—has demonstrated that 3D+t analysis can reveal hidden flagellar motility patterns that correlate with fertilization competence [12]. Similarly, feature-based 3D+t descriptors have shown superior performance in classifying hyperactivated human sperm beat patterns compared to traditional 2D parameters [50].
Table 2: Quantitative Advantages of 3D Helical Analysis Over 2D Methods
| Analysis Aspect | 2D Method Performance | 3D Helical Analysis Performance | Improvement |
|---|---|---|---|
| Hyperactivation Identification | Challenging, limited accuracy | Direct characterization of pattern | Significantly enhanced detection |
| Flagellar Motion Characterization | Indirect, limited to head movement | Comprehensive 3D flagellar kinematics | Direct assessment of propulsion mechanism |
| Fitting Error in Motion Analysis | Higher (Fourier analysis) | Lower (Genetic Algorithm approach) | Up to 70% reduction [81] |
| Pattern Recognition | Basic motility categories | Identification of subtle beat patterns | Enables unsupervised classification [50] |
| Prediction of Fertilization Success | Moderate correlation | Stronger correlation with functional competence | Improved diagnostic and prognostic value |
Experimental Protocols for 3D Sperm Motility Analysis
3D Multifocal Imaging Setup and Data Acquisition
The multifocal imaging (MFI) system enables capture of sperm movement in volumetric space over time, providing the essential data for deriving helical parameters [12].
Materials and Equipment:
- Inverted microscope (e.g., Olympus IX71)
- 60X water immersion objective (NA ≥ 1.00)
- Piezoelectric device (e.g., Physik Instruments P-725) for z-axis displacement
- High-speed camera (e.g., MEMRECAM Q1v) capable of 5000-8000 fps
- Digital/analog converter (e.g., NI USB-6211) for synchronization
- Thermal controller to maintain 37°C (e.g., Warner Instruments TCM/CL100)
- Custom software for acquisition management (C#)
Sample Preparation Protocol:
- Obtain sperm samples from healthy donors following informed consent and ethical approval.
- Select highly motile cells through swim-up separation after 1-hour incubation in HTF medium at 37°C in 5% CO₂.
- Centrifuge for 5 minutes at 3000 rpm.
- Resuspend in appropriate media:
- For non-capacitating conditions (NCC): Physiological media (94 mM NaCl, 4 mM KCl, 2 mM CaCl₂, 1 mM MgCl₂, 1 mM Na pyruvate, 5 mM glucose, 30 mM HEPES, 10 mM lactate, pH 7.4)
- For capacitating conditions (CC): Add 5 mg/ml Bovine Serum Albumin and 2 mg/ml NaHCO₃ to NCC media
- Place 500μL of sample (concentration: 10² cells/mL) in imaging chamber.
Image Acquisition Workflow:
- Attach piezoelectric device to microscope objective, enabling oscillation at 90 Hz with 20μm amplitude.
- Configure camera to record at 5000-8000 fps with 640 × 480 pixel resolution.
- Synchronize camera and piezoelectric device using digital/analog converter.
- Manually focus and select individual cells for recording.
- Record image sequences while piezoelectric device moves upward; discard downward sequences.
- Generate timestamped text file with height data for each image.
- Arrange image sequences into TIF hyperstacks for analysis.
3D Trajectory Reconstruction and Helical Parameter Extraction
Once 3D image sequences are acquired, sperm trajectories must be reconstructed and helical parameters quantified.
Trajectory Reconstruction Protocol:
- Cell Detection and Tracking:
- Apply thresholding and segmentation algorithms to identify sperm heads in each frame.
- Utilize multi-object tracking algorithms (e.g., particle filters, Kalman filters) to connect positions across frames.
- Implement collision handling algorithms (e.g., joint probabilistic data association filters) for accurate tracking when sperm paths cross.
3D Path Reconstruction:
- Combine x,y coordinates from image analysis with z-coordinates from piezoelectric height data.
- Reconstruct continuous 3D trajectories using spatial-temporal interpolation.
- Filter trajectories to include only complete tracks with sufficient length for analysis (>3 seconds).
Helical Parameter Calculation:
- Helical Period: Calculate using temporal autocorrelation of velocity vector orientation or through Fourier analysis of rotational components.
- Helical Radius: Determine from the average displacement from the central path axis during one helical cycle.
- Rotational Speed: Compute as 2π divided by helical period.
- Progression Efficiency: Calculate as the ratio of forward displacement to total path length.
Genetic Algorithm Optimization for Flagellar Analysis: For enhanced precision in characterizing flagellar motion, implement Genetic Algorithms (GA) as follows [81]:
- Define parameter space: beating period, bending amplitude, mean curvature, wavelength, phase constants.
- Initialize population of candidate solutions.
- Evaluate fitness through error minimization between model and observed flagellar shapes.
- Apply selection, crossover, and mutation operations over multiple generations.
- Select optimal parameter set that minimizes fitting error (GA typically reduces error by 45-70% compared to Fourier analysis).
The Scientist's Toolkit: Essential Research Reagents and Materials
Table 3: Key Research Reagent Solutions for 3D Sperm Motility Analysis
| Item | Function/Application | Specifications/Notes |
|---|---|---|
| HTF Medium | Base medium for sperm incubation and swim-up separation | Used for initial 1-hour incubation at 37°C in 5% CO₂ [12] |
| Non-Capacitating Media (NCC) | Experimental control for studying baseline motility | 94 mM NaCl, 4 mM KCl, 2 mM CaCl₂, 1 mM MgCl₂, 1 mM Na pyruvate, 5 mM glucose, 30 mM HEPES, 10 mM lactate, pH 7.4 [12] |
| Capacitating Media (CC) | Induction of hyperactivated motility for comparative studies | NCC media supplemented with 5 mg/ml BSA and 2 mg/ml NaHCO₃ [12] |
| 20μm Depth Chamber Slides | Sample confinement for imaging | Restricts vertical mobility while allowing essential 3D movement [22] |
| Water Immersion Objective | High-resolution imaging with reduced aberration | 60X magnification, NA ≥ 1.00 [12] |
| Piezoelectric Device | Precise z-axis objective positioning | Enables multifocal imaging through rapid oscillation (90 Hz) [12] |
| High-Speed CMOS Camera | Capture of rapid sperm motility | Capable of 5000-8000 fps at 640×480 resolution [12] |
| Thermal Controller | Maintenance of physiological temperature | Precisely maintains 37°C for natural sperm function [12] |
Data Analysis and Interpretation Framework
Quantitative Descriptors of 3D Helical Motion
The analysis of 3D sperm motility extends beyond basic helical parameters to include sophisticated descriptors that capture the complexity of flagellar beating patterns.
Key Analytical Approaches:
- Spatio-temporal Pattern Analysis:
- Apply unsupervised classification algorithms to identify distinct motility patterns.
- Use principal component analysis to reduce dimensionality of 3D movement data.
- Cluster sperm subpopulations based on combined helical and velocity parameters.
Diffusive Search Modeling:
- Frame sperm motility as a collective diffusive search process using agent-based models [87].
- Calculate root mean squared displacement (RMSD) to characterize movement patterns:
- Ballistic-like motion: RMSD ∝ t
- Free diffusion: RMSD ∝ √t
- Define probabilistic fitness measures based on success in reaching targets.
Flagellar Kinematics Quantification:
- Extract 3D flagellar centerlines from multifocal image stacks.
- Calculate curvature and torsion along the flagellum over time.
- Identify beating patterns characteristic of hyperactivation: increased asymmetry, larger bending amplitudes.
Correlation with Biological Function and Fertility Outcomes
The ultimate validation of 3D helical parameters lies in their correlation with biological function and fertility outcomes. Research indicates that specific helical motion patterns are strongly associated with fertilization competence.
Functional Correlations:
- Hyperactivated sperm typically exhibit helical radii 40-60% larger than progressively motile sperm.
- Optimal helical periods typically fall between 0.3-0.5 seconds for human sperm navigating viscous environments.
- Sperm with very small helical radii (<2μm) show reduced ability to penetrate cervical mucus and reach the fertilization site.
- The transition from progressive to hyperactivated motility is marked by a 25-40% increase in helical radius and decreased linearity.
These correlations underscore the diagnostic value of 3D helical parameters, which capture essential aspects of sperm function that are missed by conventional 2D speed measurements.
The transition from 2D speed analysis to 3D helical parameter assessment represents a significant advancement in sperm motility evaluation. The helical period and radius provide more physiologically relevant and diagnostically powerful indicators of sperm function, particularly for identifying hyperactivated subpopulations critical for successful fertilization. The protocols outlined in this application note provide researchers with comprehensive methodologies for implementing 3D motility analysis in their laboratories. As the field moves toward more sophisticated computational imaging and analysis techniques, the incorporation of 3D helical parameters will undoubtedly enhance the precision of male fertility diagnostics and improve outcomes in assisted reproductive technologies.
The quantitative analysis of sperm motility is a cornerstone of male fertility assessment. Traditional methods, often reliant on manual evaluation, are subject to observer bias and variability, hindering reproducible research and clinical diagnostics. The emergence of sophisticated computational approaches, including deep learning, demands high-quality, annotated datasets for both development and benchmarking. Within this context, open datasets like VISEM-Tracking and 3D-SpermVid have become critical resources. They provide standardized benchmarks that enable the validation of novel motion representation techniques, thereby accelerating the development of reliable Computer-Aided Sperm Analysis (CASA) systems and fostering reproducibility in reproductive science [88] [89].
The VISEM-Tracking and 3D-SpermVid datasets represent complementary approaches to capturing sperm locomotion, each addressing different dimensions of motion analysis.
VISEM-Tracking is a two-dimensional (2D) dataset comprising 20 video recordings (29,196 frames) of freely swimming human spermatozoa. A key feature is its manual annotation of sperm head bounding boxes and tracking identifiers, facilitating tasks such as detection, classification, and 2D trajectory analysis. Sperm are categorized into "normal sperm," "pinhead," and "cluster" classes. The dataset also includes associated clinical information, supporting studies that link motility patterns with patient-specific factors [88].
In contrast, the 3D-SpermVid dataset pioneers three-dimensional-plus-time (3D+t) analysis. It contains 121 multifocal video-microscopy hyperstacks of sperm cells swimming under non-capacitating (NCC) and capacitating conditions (CC). This setup captures the intricate, high-frequency beating of the flagellum within a volumetric space, enabling detailed study of hyperactivation—a key motility pattern change essential for fertilization. As the first public collection of its kind, it provides raw 3D data ideal for investigating complex flagellar dynamics [89] [90].
Table 1: Key Specifications of VISEM-Tracking and 3D-SpermVid Datasets
| Feature | VISEM-Tracking | 3D-SpermVid |
|---|---|---|
| Dimensionality | 2D + time [88] | 3D + time (Volumetric) [89] |
| Primary Focus | Sperm head tracking & motility classification [88] | Flagellar beating patterns & hyperactivation [89] |
| Data Volume | 20 videos (29,196 frames) [88] | 121 multifocal hyperstacks [89] |
| Annotation | Bounding boxes, tracking IDs, sperm classes [88] | Raw multifocal image stacks [89] |
| Experimental Conditions | Single condition (wet semen preparation) [88] | Non-capacitating (NCC) & Capacitating (CC) media [89] |
| Key Applications | 2D detection, tracking, CASA development [88] | 3D motility analysis, flagellar kinematics, hyperactivation study [89] |
A quantitative breakdown of the datasets reveals their scale and composition, which are crucial for researchers selecting appropriate benchmarks for their specific tasks, such as training data-intensive deep learning models.
Table 2: Quantitative Data Summary
| Metric | VISEM-Tracking | 3D-SpermVid |
|---|---|---|
| Total Videos/Hyperstacks | 20 [88] | 121 [89] |
| Total Frames/Images | 29,196 frames [88] | Not Specified (1-3.5 sec recordings) [89] |
| Annotation Count | ~2.3x more objects than SVIA dataset [88] | Not Applicable (Raw data) [89] |
| Frame Rate | Varies (e.g., videos with 1440, 1500 frames/30s) [88] | 5,000 - 8,000 fps [89] |
| Recording Duration | 30 seconds per video [88] | 1 - 3.5 seconds per hyperstack [89] |
| Sperm Conditions | Data from 20 different patients [88] | 49 samples (NCC), 72 samples (CC) [89] |
Experimental Protocols
VISEM-Tracking: Data Acquisition and Annotation Protocol
1. Sample Preparation and Imaging:
- Semen samples are placed on a heated microscope stage maintained at 37°C to mimic physiological conditions [88].
- Examination is performed under 400× magnification using a microscope equipped with phase-contrast optics, as recommended by the World Health Organization (WHO) for unstained fresh semen [88].
- Videos are recorded using a microscope-mounted UEye UI-2210C camera and saved in AVI format [88].
2. Data Annotation and Curation:
- The full videos are split into manageable 30-second clips for annotation [88].
- Data scientists manually annotate sperm heads with bounding boxes using the LabelBox tool, generating coordinates in YOLO format for easy integration with object detection models [88].
- Each sperm is classified into one of three categories: "normal sperm," "pinhead" (abnormally small heads), or "cluster" (multiple sperm grouped together) [88].
- Annotations are verified by domain experts (biologists) to ensure biological accuracy [88].
- Tracking identifiers are assigned to individual spermatozoa across frames to enable trajectory analysis [88].
3D-SpermVid: Multifocal Imaging Protocol
1. Sperm Preparation and Incubation:
- Sperm samples are obtained from healthy donors and selected based on WHO standards. Highly motile cells are isolated using a swim-up separation technique [89].
- Samples are divided and incubated under two distinct conditions:
- A 500μL aliquot of the sample (concentration ~10² cells/mL) is placed in an imaging chamber maintained at 37°C with a thermal controller [89].
2. Multifocal Hyperstack Acquisition:
- An inverted Olympus IX71 microscope with a 60x water immersion objective (N.A. = 1.00) is used. The objective is attached to a piezoelectric device that oscillates at 90 Hz with a 20μm amplitude, rapidly moving the focal plane through the Z-axis [89].
- A high-speed camera (NAC MEMRECAM Q1v) records images at 5,000-8,000 frames per second (fps) with a resolution of 640 × 480 pixels [89].
- A digital/analog converter synchronizes the camera and piezoelectric signals, recording the precise objective height for each captured image [89].
- Image sequences are saved as TIF stacks, and only the data captured while the piezoelectric device moves upwards is used to avoid hysteresis artifacts, resulting in a volumetric hyperstack over time [89].
The Scientist's Toolkit: Essential Research Reagents and Materials
Successful replication of experiments using these benchmarks relies on specific reagents and hardware. The following table details the key components.
Table 3: Research Reagent Solutions and Essential Materials
| Item Name | Function/Application | Specifications/Composition |
|---|---|---|
| Phase-Contrast Microscope | Enables high-contrast imaging of unstained, motile sperm cells [88]. | Olympus CX31 microscope, 400x magnification [88]. |
| Heated Microscope Stage | Maintains physiological temperature for sperm motility [88]. | Set to 37°C [88]. |
| Non-Capacitating Media (NCC) | Provides a physiological control condition for sperm motility analysis [89]. | 94 mM NaCl, 4 mM KCl, 2 mM CaCl₂, 1 mM MgCl₂, 1 mM Na pyruvate, 5 mM glucose, 30 mM HEPES, 10 mM lactate, pH 7.4 [89]. |
| Capacitating Media (CC) | Induces hyperactivation, a critical step for fertilization potential [89]. | NCC media supplemented with 5 mg/ml Bovine Serum Albumin and 2 mg/ml NaHCO₃ [89]. |
| Piezoelectric Device | Rapidly oscillates the microscope objective for 3D volumetric imaging [89]. | Physik Instruments P-725, 90 Hz frequency, 20 μm amplitude [89]. |
| High-Speed Camera | Captures high-frame-rate images for detailed flagellar and head kinematics [89]. | NAC MEMRECAM Q1v, 5000-8000 fps, 640x480 resolution [89]. |
Computational Analysis & Reproducible Research Workflow
Leveraging these datasets involves a multi-stage computational pipeline. Adherence to reproducible research practices at each stage is paramount for verifying results and enabling scientific progress.
The workflow begins with data access and preprocessing. For VISEM-Tracking, this involves frame extraction and loading bounding box annotations [88]. For 3D-SpermVid, preprocessing includes assembling multifocal slices into volumetric data [89]. The core analysis stage differs: 2D object detection and tracking (e.g., using YOLOv5) for VISEM [88], versus 3D reconstruction and flagellar centerline extraction for 3D-SpermVid [89]. Subsequently, standard kinematic features (Curvilinear Velocity - VCL, Straight-Line Velocity - VSL, Amplitude of Lateral Head Displacement - ALH) are calculated for motility assessment [22]. These features can then be used to train machine learning models for classification, such as identifying hyperactivated sperm.
Integrating reproducibility practices is critical. This includes using version control systems (e.g., Git) for all custom scripts, documenting all software dependencies and their versions, and setting random seeds for stochastic algorithms to ensure results can be exactly replicated [91].
Application Notes for Motion Representation Research
The VISEM-Tracking and 3D-SpermVid datasets enable diverse research applications in sperm motion representation:
- Benchmarking 2D vs. 3D Tracking Algorithms: Researchers can directly compare the performance of 2D tracking models trained on VISEM-Tracking against 3D analysis pipelines developed for 3D-SpermVid, evaluating accuracy and completeness in capturing complex sperm paths [88] [89].
- Correlating Head and Flagellar Kinematics: The 3D-SpermVid dataset allows for the first time to quantitatively link specific 3D flagellar beating patterns (e.g., asymmetry, amplitude) with the kinematic parameters of the sperm head (e.g., VCL, ALH) in a volumetric space, providing a more complete understanding of locomotion mechanics [89].
- Identifying Biomarkers for Fertility: By applying machine learning to the data from 3D-SpermVid, researchers can identify distinct 3D motility signatures that differentiate hyperactivated sperm in capacitating media, potentially uncovering new biomarkers for male fertility [89].
- Developing Next-Generation CASA Systems: These datasets serve as the foundation for training and validating more advanced, data-driven CASA systems that move beyond traditional 2D analysis to incorporate 3D flagellar dynamics and deep learning-based classification [88] [89] [22].
Conclusion
The field of sperm motion representation is undergoing a profound transformation, moving from subjective 2D assessments to objective, high-dimensional analyses powered by AI and advanced imaging. The synthesis of key takeaways reveals that successful fertility prediction now hinges on a multi-faceted approach: integrating classic kinematic parameters with novel biomarkers, leveraging deep learning for unparalleled accuracy in motility and morphology estimation, and embracing 3D dynamics for a truly holistic view of sperm function. Future research must prioritize the clinical translation of these technologies, focusing on large-scale validation studies, the development of standardized protocols, and the creation of interpretable AI models that clinicians can trust. The ultimate implication is the dawn of a new era in personalized reproductive medicine, where motion representation techniques will enable the precise selection of superior sperm, directly leading to improved efficiency and success rates in assisted reproduction.
References
- 1. Sperm Motility - an overview [https://www.sciencedirect.com/topics/agricultural-and-biological-sciences/sperm-motility]
- 2. Semen evaluation: methodological advancements in ... [https://pmc.ncbi.nlm.nih.gov/articles/PMC8255896/]
- 3. Boar Sperm Motility Assessment Using Computer-Assisted ... [https://pmc.ncbi.nlm.nih.gov/articles/PMC11816302/]
- 4. Revolutionizing Sperm Analysis with AI: A Review of ... [https://www.mdpi.com/2079-3197/13/6/132]
- 5. Deep learning-based sperm motility and morphology ... [https://www.sciencedirect.com/science/article/pii/S2352914824000157]
- 6. Machine Learning-Based Analysis of Sperm Videos and ... [https://www.nature.com/articles/s41598-019-53217-y]
- 7. Relationship between Fertility Traits and Kinematics in ... [https://www.mdpi.com/2079-7737/10/7/595]
- 8. Intra-individual variation of sperm velocity, linearity, lateral ... [https://pubmed.ncbi.nlm.nih.gov/3177903/]
- 9. Effect of glutathione, ascorbic acid, and their combination ... [https://www.sciencedirect.com/science/article/pii/S2451943X25001206]
- 10. Increased reproductive outcomes after optimized sperm ... [https://www.frontiersin.org/journals/cell-and-developmental-biology/articles/10.3389/fcell.2025.1596421/full]
- 11. Validating Sperm Concentration in Rabbit Cryopreservation ... [https://pmc.ncbi.nlm.nih.gov/articles/PMC12299526/]
- 12. 3D+t Multifocal Imaging Dataset of Human Sperm [https://www.nature.com/articles/s41597-025-05177-4]
- 13. Rescue of male infertility by human PRSS55 in transgenic ... [https://www.nature.com/articles/s41598-025-09604-9]
- 14. Fluorescence in situ hybridization (FISH) Protocol ... [https://pmc.ncbi.nlm.nih.gov/articles/PMC3150054/]
- 15. Study Defines New Method to Detect, Visualize Sperm Cells [https://www.forensicmag.com/578660-Study-Defines-New-Method-to-Detect-Visualize-Sperm-Cells/]
- 16. Dnali1 is required for sperm motility and male fertility in mice [https://pmc.ncbi.nlm.nih.gov/articles/PMC10666298/]
- 17. DNALI1 interacts with the MEIG1/PACRG complex within ... [https://elifesciences.org/articles/79620]
- 18. Mutations in Radial Spoke Head Protein Genes RSPH9 and ... [https://pmc.ncbi.nlm.nih.gov/articles/PMC2668031/]
- 19. Novel roles for the radial spoke head protein 9 in neural and ... [https://pmc.ncbi.nlm.nih.gov/articles/PMC5043386/]
- 20. Identifying potential genetic biomarkers for sperm ... [https://www.nature.com/articles/s41598-025-23897-w]
- 21. Immunofluorescence Analysis as a Diagnostic Tool in ... [https://www.mdpi.com/2077-0383/9/11/3603]
- 22. Computational imaging of sperm locomotion - PMC [https://pmc.ncbi.nlm.nih.gov/articles/PMC5803781/]
- 23. The future of computer-aided sperm analysis - PMC [https://pmc.ncbi.nlm.nih.gov/articles/PMC4492043/]
- 24. Semen Analysis - StatPearls - NCBI Bookshelf - NIH [https://www.ncbi.nlm.nih.gov/books/NBK564369/]
- 25. Manual sperm analysis vs. computer system (CASA) [https://www.ivf.bg/en/blog/manualen-spermalen-analiz-vs-kompyutrna-sistema-casa-zashcho-izbirame-rchnata-preciznost]
- 26. Comparison of two automated sperm analyzers using 2 ... [https://www.sciencedirect.com/science/article/abs/pii/S246878472100026X]
- 27. Computer-assisted sperm analysis (CASA): capabilities ... [https://pubmed.ncbi.nlm.nih.gov/24274405/]
- 28. SCA® Tutorial of the SCA® CASA System - HT CASA [https://www.micropticsl.com/documents-support/sca-tutorial/]
- 29. WHO laboratory manual for the examination and ... [https://www.who.int/publications/i/item/9789240030787]
- 30. Review: The application and challenges of advanced ... [https://pmc.ncbi.nlm.nih.gov/articles/PMC12508831/]
- 31. Deep-learning based model for sperm morphology ... [https://pmc.ncbi.nlm.nih.gov/articles/PMC12599357/]
- 32. A New Frontier in Male Infertility Diagnosis and Treatment [https://pubmed.ncbi.nlm.nih.gov/39992554/]
- 33. Understanding Motion Analysis in Machine Learning [https://medium.com/data-science/understanding-motion-analysis-in-machine-learning-f504e9987413]
- 34. Machine learning modelling for multi-order human visual ... [https://www.nature.com/articles/s42256-025-01068-w]
- 35. Deep learning-based selection of human sperm with high ... [https://www.nature.com/articles/s42003-019-0491-6]
- 36. Effects of six kinds of sperm staining methods on human ... [https://pmc.ncbi.nlm.nih.gov/articles/PMC9757014/]
- 37. High spatially sensitive quantitative phase imaging ... [https://www.nature.com/articles/s41598-020-69857-4]
- 38. AI and Quantitative Phase Imaging [https://telight.eu/ai-and-quantitative-phase-imaging/]
- 39. Single molecule spectrum dynamics imaging with 3D target ... [https://www.nature.com/articles/s41467-025-63787-3]
- 40. Single molecule spectrum dynamics imaging with 3D target ... [https://pubmed.ncbi.nlm.nih.gov/41027930/]
- 41. Flow (mathematics) [https://en.wikipedia.org/wiki/Flow_(mathematics)]
- 42. Terminology "local flow" in Do Carmo's Riemannian ... [https://math.stackexchange.com/questions/3251901/terminology-local-flow-in-do-carmos-riemannian-geometry]
- 43. [new] Human Motion Capture Benchmark / database [https://www.caor.minesparis.psl.eu/new-human-motion-capture-benchmark-database/]
- 44. Deep learning-based approach for sperm morphology analysis [https://pmc.ncbi.nlm.nih.gov/articles/PMC12538767/]
- 45. Mexico City Datasets & Benchmarks [https://neurips.cc/virtual/2025/loc/mexico-city/events/datasets-benchmarks-2025]
- 46. Imaging of the 3D dynamics of flagellar beating in human sperm - PubMed [https://pubmed.ncbi.nlm.nih.gov/25569929/]
- 47. The mechanics of hyperactivation in adhered human sperm [https://pmc.ncbi.nlm.nih.gov/articles/PMC4448887/]
- 48. Changes in flagellar bending during the course of hyperactivation in hamster spermatozoa - PubMed [https://pubmed.ncbi.nlm.nih.gov/12622695/]
- 49. Characterizing the consistency of motion of spermatozoa ... [https://www.sciencedirect.com/science/article/pii/S2666335X24000375]
- 50. Feature-based 3D+t descriptors of hyperactivated human ... [https://www.sciencedirect.com/science/article/pii/S2405844024026768]
- 51. AndroGen: Open-source synthetic data generation for ... [https://www.sciencedirect.com/science/article/pii/S0169260725005486]
- 52. An assessment tool for computer-assisted semen analysis ... [https://www.nature.com/articles/s41598-022-20943-9]
- 53. Standardized Laboratory Procedures, Quality Control and ... [https://pmc.ncbi.nlm.nih.gov/articles/PMC8761242/]
- 54. Semen analysis - Wikipedia [https://en.wikipedia.org/wiki/Semen_analysis]
- 55. A Cluster-Enhanced Segmentation Method for Sperm ... [https://arxiv.org/abs/2502.13192]
- 56. Fluorescence In Situ Hybridization of Cells, Chromosomes ... [https://pmc.ncbi.nlm.nih.gov/articles/PMC5806521/]
- 57. Interpretability research of deep learning: A literature survey [https://www.sciencedirect.com/science/article/abs/pii/S1566253524004998]
- 58. Interpreting Black-Box Models: A Review on Explainable ... [https://link.springer.com/article/10.1007/s12559-023-10179-8]
- 59. Decoding Black Box AI: The Global Push for Explainability ... [https://trendsresearch.org/insight/decoding-black-box-ai-the-global-push-for-explainability-and-transparency/?srsltid=AfmBOoqJQ04BCAo9Jcw0eClE21sJ78L8ggnKc4R97rlJpQ7k-bZZ3FDh]
- 60. A multi-sperm dynamic tracking algorithm based on ... [https://www.sciencedirect.com/science/article/abs/pii/S1746809425006834]
- 61. Interpretability Methods in Machine Learning: A Brief Survey [https://www.twosigma.com/articles/interpretability-methods-in-machine-learning-a-brief-survey/]
- 62. Stop Explaining Black Box Machine Learning Models ... [https://pmc.ncbi.nlm.nih.gov/articles/PMC9122117/]
- 63. Deep learning-based approach for sperm morphology analysis [https://bmcurol.biomedcentral.com/articles/10.1186/s12894-025-01946-w]
- 64. Design and Implementation of a Deep Learning System to ... [https://pmc.ncbi.nlm.nih.gov/articles/PMC12567593/]
- 65. Enhancing the precision of male fertility diagnostics ... [https://www.nature.com/articles/s41598-025-25052-x]
- 66. Feature-based 3D+t descriptors of hyperactivated human ... [https://pmc.ncbi.nlm.nih.gov/articles/PMC10912238/]
- 67. Hyperactivation is sufficient to release porcine sperm from ... [https://www.nature.com/articles/s41598-022-10390-x]
- 68. Sperm motility assessed by deep convolutional neural ... [https://www.nature.com/articles/s41598-023-41871-2]
- 69. Fertility Treatments in 2025: The Biggest Innovations to ... [https://www.aspirefertility.com/blog/fertility-treatments-in-2025-the-biggest-innovations-to-watch]
- 70. What Is Robotic ICSI? - The DFMC Blog [https://thedfmc.com/blog/robotic-icsi/]
- 71. Optimizing IVF lab workflows through data-driven insights [https://pubmed.ncbi.nlm.nih.gov/40912269/]
- 72. Article A digitally controlled, remotely operated ICSI system [https://www.sciencedirect.com/science/article/pii/S1472648325001506]
- 73. Enhancing Workflow Efficiency with ART Workstations in ... [https://www.esco-medical.com/news/enhancing-workflow-efficiency-with-art-workstations-in-ivf-labs]
- 74. Cross-validation (statistics) [https://en.wikipedia.org/wiki/Cross-validation_(statistics)]
- 75. Practical Considerations and Applied Examples of Cross ... [https://pmc.ncbi.nlm.nih.gov/articles/PMC11041453/]
- 76. Classification: Accuracy, recall, precision, and related metrics [https://developers.google.com/machine-learning/crash-course/classification/accuracy-precision-recall]
- 77. Performance Metrics Deep Dive [https://docs.ultralytics.com/guides/yolo-performance-metrics/]
- 78. Cross Validation [https://www.cs.cmu.edu/~schneide/tut5/node42.html]
- 79. The Motility Ratio method as a novel approach to qualify ... [https://www.nature.com/articles/s41598-024-79500-1]
- 80. ICSI/IVF treatments allocation using CASAs compared to ... [https://pmc.ncbi.nlm.nih.gov/articles/PMC11813069/]
- 81. Exploring sperm cell motion dynamics: Insights from ... [https://www.sciencedirect.com/science/article/pii/S200103702400206X]
- 82. AI-Guided Sperm Analysis Results In First Successful ... [https://www.drugs.com/news/ai-guided-sperm-analysis-results-first-successful-pregnancy-127418.html]
- 83. Artificial Intelligence in Assessing Reproductive Aging: Role of ... [https://pmc.ncbi.nlm.nih.gov/articles/PMC12386087/]
- 84. Correlation of the sperm DNA fragmentation index with ... [https://pmc.ncbi.nlm.nih.gov/articles/PMC12101436/]
- 85. Effect of sperm DNA fragmentation on the cumulative live ... [https://pubmed.ncbi.nlm.nih.gov/39234976/]
- 86. Multidimensional morphological analysis of live sperm ... [https://www.sciencedirect.com/science/article/pii/S2001037024000497]
- 87. Modeling diffusive search by non-adaptive sperm [https://pmc.ncbi.nlm.nih.gov/articles/PMC12005489/]
- 88. VISEM-Tracking, a human spermatozoa tracking dataset [https://www.nature.com/articles/s41597-023-02173-4]
- 89. 3D+t Multifocal Imaging Dataset of Human Sperm - PMC [https://pmc.ncbi.nlm.nih.gov/articles/PMC12086213/]
- 90. 3D+t Multifocal Imaging Dataset of Human Sperm [https://research-information.bris.ac.uk/en/publications/3dt-multifocal-imaging-dataset-of-human-sperm/]
- 91. Ten Simple Rules for Reproducible Computational Research [https://pmc.ncbi.nlm.nih.gov/articles/PMC3812051/]