Array-CGH vs. NGS in POI Genetic Diagnosis: A Comparative Analysis for Researchers and Drug Developers
Premature Ovarian Insufficiency (POI), affecting 1-2% of women under 40, has a significant genetic component, with nearly 70% of cases historically unexplained.
Array-CGH vs. NGS in POI Genetic Diagnosis: A Comparative Analysis for Researchers and Drug Developers
Abstract
Premature Ovarian Insufficiency (POI), affecting 1-2% of women under 40, has a significant genetic component, with nearly 70% of cases historically unexplained. This article provides a comprehensive analysis for researchers and drug development professionals on the evolving roles of Array-Based Comparative Genomic Hybridization (array-CGH) and Next-Generation Sequencing (NGS) in elucidating the genetic architecture of POI. We explore the foundational principles of each technology, detail their methodological workflows in a research and clinical context, and address key challenges in data interpretation and optimization. A critical, evidence-based comparison evaluates their respective diagnostic yields, limitations, and complementarity, including recent data showing a combined diagnostic approach identifying causal variants in over 57% of idiopathic POI patients. The review concludes with future directions, emphasizing the potential of integrated multi-omics and AI-driven analysis to accelerate discovery and pave the way for targeted therapeutic interventions.
Unraveling POI Genetics: From Unexplained Etiology to Genomic Discovery
The Clinical and Genetic Landscape of Premature Ovarian Insufficiency (POI)
Premature Ovarian Insufficiency (POI) is a clinically heterogeneous disorder characterized by the loss of ovarian function before the age of 40, presenting with menstrual disturbances (amenorrhea or oligomenorrhea for ≥4 months) and elevated follicle-stimulating hormone (FSH) levels (>25 IU/L on two occasions or >25 IU/L once according to newer guidelines) [1] [2]. This condition affects approximately 1-3.7% of women, with recent meta-analyses suggesting a higher prevalence than previously recognized [1] [3] [2]. POI poses significant challenges to women's health, leading to infertility, compromised bone health, increased cardiovascular risk, and psychological distress. The etiological landscape of POI encompasses genetic, autoimmune, iatrogenic, and environmental factors, yet a substantial proportion (initially up to 70%) remained idiopathic until recently [4] [3]. Advancements in genetic technologies, particularly array-CGH and next-generation sequencing (NGS), have dramatically improved the identification of underlying genetic causes, reducing the percentage of idiopathic cases to approximately 37-67% [3] [2]. This application note delineates the clinical and genetic architecture of POI and provides detailed protocols for comprehensive genetic investigation within the context of comparing array-CGH versus NGS for POI genetic diagnosis research.
Clinical Presentation and Etiological Spectrum
Diagnostic Criteria and Clinical Manifestations
POI diagnosis requires the presence of menstrual disturbance (primary amenorrhea, secondary amenorrhea, or oligomenorrhea) for at least four months in women under 40 years, coupled with elevated FSH levels [1] [2]. Patients may present with a spectrum of symptoms related to estrogen deficiency, including vasomotor symptoms, urogenital atrophy, and psychological manifestations. The condition significantly impacts long-term health, with increased risks of osteoporosis, cardiovascular disease, cognitive decline, and reduced life expectancy [3] [2].
Evolving Etiological Distribution
The etiological classification of POI has shifted substantially over recent decades, with a notable increase in identified causes and a corresponding decrease in idiopathic cases.
Table 1: Etiological Distribution of POI Across Historical and Contemporary Cohorts
| Etiology | Historical Cohort (1978-2003) | Contemporary Cohort (2017-2024) | Change | P-value |
|---|---|---|---|---|
| Genetic | 11.6% | 9.9% | -1.7% | Not Significant |
| Autoimmune | 8.7% | 18.9% | +10.2% | <0.05 |
| Iatrogenic | 7.6% | 34.2% | +26.6% | <0.05 |
| Idiopathic | 72.1% | 36.9% | -35.2% | <0.05 |
Data adapted from [2]
This shift reflects improved diagnostic capabilities and changing clinical practices, including increased survival following oncological treatments and more frequent gynecologic surgeries [2]. Iatrogenic causes now represent the largest identifiable etiological group, primarily due to chemotherapy (especially alkylating agents) and radiotherapy that damage the ovarian follicular pool [2].
Genetic Architecture of POI
Established Genetic Causes
POI has a strong heritable component, with familial clustering observed in approximately 12-31% of cases [4] [3]. First-degree relatives of women with POI demonstrate an 18-fold increased risk compared to the general population [3]. The genetic architecture encompasses chromosomal abnormalities, single gene mutations, and complex genetic associations.
Table 2: Major Genetic Causes of Premature Ovarian Insufficiency
| Genetic Category | Specific Causes | Prevalence/Notes | Key Genes/Regions |
|---|---|---|---|
| Chromosomal Abnormalities | X-chromosome anomalies, Turner syndrome | 12-13% of POI cases; more common in primary amenorrhea (21.4%) | Xq, Xp deletions; 45,X and mosaic variants |
| FMR1 Premutations | CGG repeat expansion (55-200 repeats) | 20-30% of carriers develop FXPOI; highest risk with 70-100 repeats | FMR1 gene |
| Single Gene Disorders | Syndromic and non-syndromic forms | >75 genes implicated; most involved in meiosis, DNA repair, folliculogenesis | BMP15, GDF9, NOBOX, FIGLA, FOXL2 |
| Metabolic Disorders | Galactosemia (GALT deficiency) | Rare; mechanism involves toxic metabolite accumulation | GALT gene |
| Autoimmune Associations | APS-1 (Autoimmune Polyglandular Syndrome Type 1) | Rare monogenic autoimmune form | AIRE gene |
Data compiled from [3] [2] [5]
Genetic Investigation Yield
Contemporary studies utilizing comprehensive genetic screening demonstrate remarkable diagnostic yields. A 2025 study combining array-CGH and NGS in 28 idiopathic POI patients identified genetic anomalies in 57.1% (16/28) of cases [4] [6]. This included:
- One patient (3.6%) with a causal copy number variation (CNV) detected by array-CGH
- Eight patients (28.6%) with causal single nucleotide variations (SNVs) or indel variations detected by NGS
- Seven patients (25%) with variants of uncertain significance (VUS) [4]
Another study employing targeted NGS of 31 POI-associated genes in 48 Hungarian patients identified monogenic defects in 16.7% (8/48), with potential genetic risk factors in an additional 29.2% (14/48) [5]. These findings underscore the substantial genetic heterogeneity of POI and the value of comprehensive genetic screening.
Comparative Diagnostic Approaches: Array-CGH versus NGS
Array Comparative Genomic Hybridization (array-CGH) is a high-resolution molecular technique that detects copy number variations (CNVs) across the entire genome. It is particularly valuable for identifying chromosomal microdeletions and microduplications that may be missed by conventional karyotyping [4].
Next-Generation Sequencing (NGS) encompasses various sequencing approaches that enable parallel sequencing of multiple genomic regions. For POI investigation, both targeted gene panels (focusing on known POI-associated genes) and whole-exome sequencing approaches are utilized to identify single nucleotide variants (SNVs), small insertions/deletions (indels), and other sequence-level variations [4] [5].
Performance Characteristics in POI Diagnosis
The complementary nature of array-CGH and NGS is evident in their differential detection of various genetic anomaly types in POI:
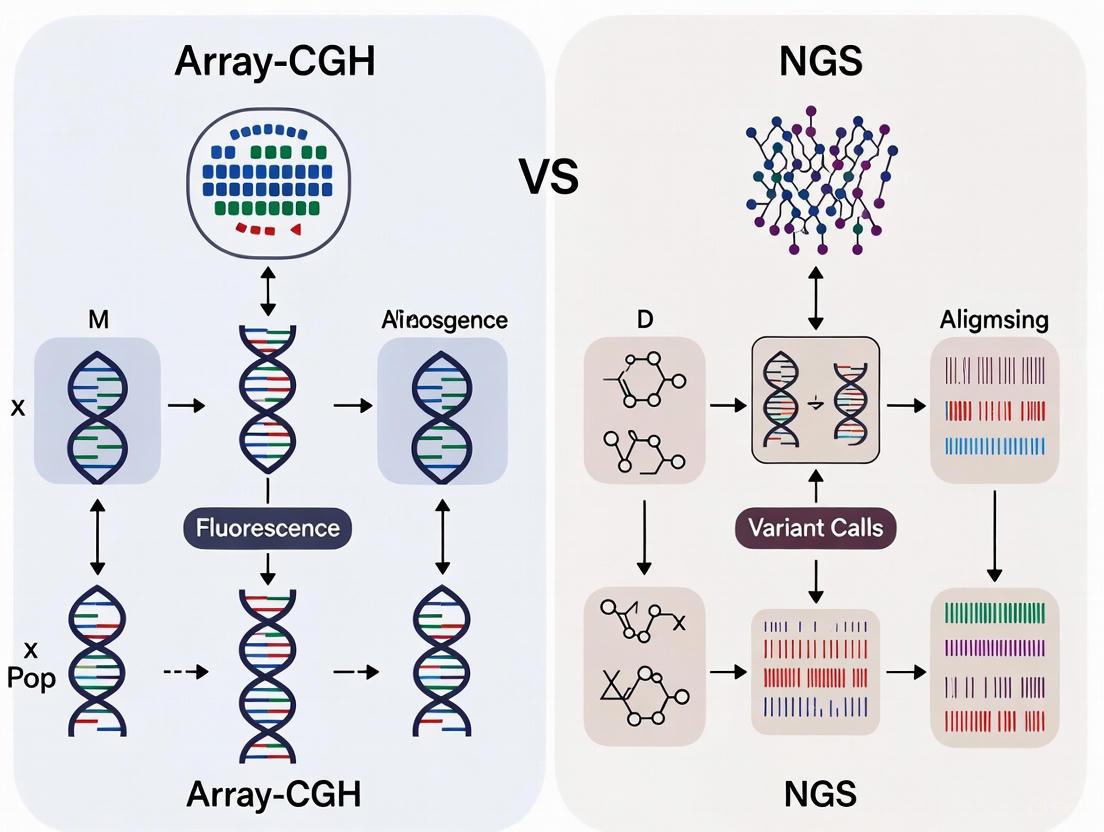
Diagram 1: POI Genetic Testing Technologies and Anomaly Detection. Array-CGH and NGS provide complementary approaches for detecting different types of genetic anomalies in POI.
The diagnostic yield of each technology varies depending on patient selection criteria and the specific genes included in NGS panels. The combined approach of array-CGH and NGS demonstrates superior diagnostic performance compared to either technology alone [4].
Application Notes: Integrated Genetic Testing Protocol for POI
Sample Preparation and Quality Control
Patient Selection Criteria:
- Women aged <40 years with ≥4 months of amenorrhea/oligomenorrhea and elevated FSH (>25 IU/L)
- Exclusion of known iatrogenic, autoimmune, or chromosomal causes (normal karyotype and FMR1 premutation screening)
- Special consideration for patients with primary amenorrhea or strong family history
DNA Extraction:
- Obtain peripheral blood samples in EDTA tubes
- Extract genomic DNA using validated kits (e.g., QIAsymphony DNA Midi Kits on QIAsymphony system)
- Assess DNA quality and quantity: A260/A280 ratio of 1.8-2.0, minimum concentration 50 ng/μL
- Store DNA at -20°C until analysis
Array-CGH Protocol
Materials and Equipment:
- SurePrint G3 Human CGH Microarray 4×180K (Agilent Technologies)
- Hybridization oven, microarray scanner, and associated reagents
- CytoGenomics software v5.0 (Agilent Technologies) for data analysis
- Cartagenia Bench Lab CNV software v5.1 (Agilent Technologies) for CNV interpretation
Procedure:
- DNA Labeling: Label test and reference DNA with Cy5 and Cy3 fluorescent dyes respectively using random priming method
- Hybridization: Combine labeled DNA, co-hybridize to microarray slide, and incubate at 65°C for 24 hours with rotation
- Washing: Perform sequential washes per manufacturer's protocol to remove non-specific binding
- Scanning: Acquire fluorescence images using microarray scanner at 3μm resolution
- Data Analysis:
- Process raw images with Feature Extraction software
- Import data into CytoGenomics software for CNV detection
- Set minimum CNV detection threshold of 60 kb
- Annotate identified CNVs using database resources (DECIPHER, ClinGen, DGV)
- Classify CNVs according to ACMG standards and guidelines
Next-Generation Sequencing Protocol
Materials and Equipment:
- Custom capture design targeting 163 POI-associated genes (SureSelect XT-HS, Agilent Technologies)
- Magnis system (Agilent Technologies) for library preparation
- NextSeq 550 system (Illumina) for sequencing
- Alissa Align&Call v1.1 and Alissa Interpret v5.3 (Agilent Technologies) for bioinformatics analysis
Procedure:
- Library Preparation:
- Fragment genomic DNA to 150-200 bp
- Perform end-repair, A-tailing, and adapter ligation using SureSelect XT-HS reagents
- Amplify library with index primers for sample multiplexing
- Assess library quality and quantity (Agilent Bioanalyzer)
Target Capture:
- Hybridize library to custom biotinylated RNA baits (163 POI-associated genes)
- Capture hybridized fragments using streptavidin-coated magnetic beads
- Perform post-capture PCR amplification
Sequencing:
- Pool multiplexed libraries at equimolar concentrations
- Load onto NextSeq 550 flow cell
- Sequence using 2×150 bp paired-end chemistry
- Target minimum coverage of 100x with >95% of bases covered at 20x
Bioinformatics Analysis:
- Demultiplex raw sequencing data
- Align reads to reference genome (GRCh37/hg19) using Burrows-Wheeler Aligner
- Perform variant calling (SNVs, indels) following GATK best practices
- Annotate variants using population databases (gnomAD), prediction algorithms, and clinical databases (ClinVar, HGMD)
- Filter and prioritize variants based on population frequency (<1%), predicted pathogenicity, and clinical relevance
- Classify variants according to ACMG/AMP guidelines
Diagram 2: Comprehensive Genetic Testing Workflow for POI. The stepwise approach to genetic testing in POI begins with standard tests and progresses to advanced genomic technologies for idiopathic cases.
Variant Interpretation and Clinical Reporting
Variant Classification Framework:
- Class 1: Benign
- Class 2: Likely Benign
- Class 3: Variant of Uncertain Significance (VUS)
- Class 4: Likely Pathogenic
- Class 5: Pathogenic
Evidence Integration:
- Combine population frequency, computational predictions, functional data, segregation evidence, and database entries
- Correlate genetic findings with clinical presentation (primary vs. secondary amenorrhea, family history)
- Consider potential oligogenic inheritance when multiple variants are identified
Clinical Reporting:
- Report pathogenic and likely pathogenic variants with clinical correlation
- Document VUS with recommendation for family studies and future reclassification
- Provide genetic counseling for patients and at-risk relatives
- Offer familial testing for identified pathogenic variants
The Scientist's Toolkit: Essential Research Reagents and Materials
Table 3: Essential Research Reagents and Materials for POI Genetic Investigation
| Category | Specific Product/Kit | Manufacturer | Application in POI Research |
|---|---|---|---|
| DNA Extraction | QIAsymphony DNA Midi Kits | Qiagen | High-quality genomic DNA extraction from peripheral blood |
| Array-CGH Platform | SurePrint G3 Human CGH Microarray 4×180K | Agilent Technologies | Genome-wide CNV detection with high resolution |
| NGS Target Capture | SureSelect XT HS Custom Panels | Agilent Technologies | Targeted enrichment of POI-associated genes |
| NGS Sequencing | NextSeq 550 System | Illumina | High-throughput sequencing of targeted regions |
| Bioinformatics Analysis | Alissa Align&Call / Alissa Interpret | Agilent Technologies | Variant calling, annotation, and interpretation |
| CNV Analysis Software | CytoGenomics with Cartagenia Bench Lab CNV | Agilent Technologies | CNV detection, visualization, and interpretation |
| Variant Interpretation | Ion Reporter Software | Thermo Fisher | NGS data analysis and variant prioritization |
| Reference Databases | gnomAD, ClinVar, DECIPHER, OMIM | Multiple | Variant filtering and pathogenicity assessment |
Discussion and Future Directions
The integrated application of array-CGH and NGS technologies has substantially improved the diagnostic yield in idiopathic POI, identifying genetic anomalies in up to 57% of previously unexplained cases [4]. This combined approach captures the full spectrum of genetic variation, from chromosomal rearrangements to single nucleotide changes, providing a comprehensive genetic diagnosis. The complementary nature of these technologies is evident in their ability to detect different types of variants: array-CGH effectively identifies CNVs, while NGS excels at detecting SNVs and small indels in known POI-associated genes.
Recent evidence suggests an oligogenic etiology in a subset of POI cases, where combinations of variants in multiple genes contribute to the phenotype [5]. This complexity underscores the need for comprehensive genetic screening approaches that extend beyond single-gene analysis. The expanding list of POI-associated genes—involved in diverse biological processes including meiosis, DNA repair, folliculogenesis, and hormone signaling—highlights the genetic heterogeneity of this condition and the importance of broad genetic investigation.
Future directions in POI genetic research include:
- Expansion of gene panels to include newly discovered POI-associated genes
- Integration of whole-exome and whole-genome sequencing for novel gene discovery
- Functional validation of VUS using in vitro and in vivo models
- Implementation of RNA sequencing to detect splicing defects and expression abnormalities
- Long-term studies correlating genetic findings with clinical outcomes and treatment responses
The progressive elucidation of POI's genetic architecture holds promise for improved genetic counseling, personalized management strategies, and the development of targeted interventions. As genetic testing technologies continue to advance and become more accessible, comprehensive genetic diagnosis is poised to become standard of care in the management of women with premature ovarian insufficiency.
Premature Ovarian Insufficiency (POI) is a clinically heterogeneous disorder characterized by the loss of ovarian function before age 40, affecting approximately 1-3.7% of the female population [4] [7] [3]. It presents with primary or secondary amenorrhea, elevated gonadotropins, and estrogen deficiency, leading to infertility and increased long-term health risks [4] [8]. Despite thorough investigation, the etiology remains unknown in a significant proportion of cases, classified as idiopathic POI [4] [7].
The genetic architecture of POI is remarkably complex, involving chromosomal abnormalities, single gene disorders, and emerging oligogenic patterns [9] [8]. Traditional genetic assessment including karyotype and FMR1 premutation testing identifies causes in only 20-25% of cases [7] [8]. This diagnostic gap underscores the imperative for advanced genetic testing technologies—specifically array Comparative Genomic Hybridization (array-CGH) and Next-Generation Sequencing (NGS)—to resolve the unexplained majority of POI cases [4] [10].
The Genetic Landscape of POI
Etiological Spectrum and Diagnostic Yield
POI represents the final common pathway for various genetic, autoimmune, iatrogenic, and environmental insults to ovarian function. Genetic causes account for 20-25% of cases and can be broadly categorized as follows:
- Chromosomal abnormalities (10-13% of cases): Including X-chromosome aneuploidies (Turner syndrome), structural X-chromosome rearrangements, and autosomal abnormalities [7] [8]
- Single gene disorders: Involving genes critical for ovarian development, folliculogenesis, meiosis, and DNA repair [5] [8]
- FMR1 premutations: Responsible for approximately 20% of familial cases [7]
- Oligogenic/Polygenic inheritance: Emerging evidence suggests combined effects of variants in multiple genes [9]
Table 1: Current Genetic Diagnostic Yield in POI
| Investigation Method | Diagnostic Yield | Key Limitations |
|---|---|---|
| Karyotype | 10-13% | Limited to abnormalities >5-10 Mb |
| FMR1 Premutation Testing | ~20% (in familial cases) | Specific to one gene |
| Array-CGH | 3.5-32% (for CNVs) | Cannot detect balanced rearrangements or SNVs |
| Targeted NGS Panels | 16.7-75% (varies by panel size) | Limited to predefined genes |
| Combined Array-CGH + NGS | 57.1% [4] | Comprehensive but resource-intensive |
The Unexplained Majority: Idiopathic POI
Approximately 39-67% of POI cases remain idiopathic despite standard investigation [3]. This diagnostic gap has significant clinical implications:
- Reproductive counseling: Unknown recurrence risk limits accurate family planning guidance
- Complication management: inability to anticipate associated features in syndromic forms
- Therapeutic development: Poor understanding of pathophysiological mechanisms
The strong heritable component of POI—with first-degree relatives having a 4.6 to 18-fold increased risk—underscores the importance of genetic diagnosis [3]. Recent advances in genomic technologies now enable researchers to resolve a substantial portion of these idiopathic cases.
Advanced Genetic Technologies: Array-CGH versus NGS
Technical Principles and Capabilities
Array-CGH utilizes thousands of oligonucleotide probes spaced throughout the genome to detect copy number variations (CNVs) by comparing patient DNA to reference DNA [11] [10]. The resolution depends on probe density, with modern arrays detecting variants as small as 60 kb [4]. Key applications in POI include identifying deletions/duplications in known POI-associated regions, particularly on the X chromosome [10].
Next-Generation Sequencing employs massively parallel sequencing to simultaneously analyze millions of DNA fragments. For POI research, two primary approaches are used:
- Targeted gene panels: Focus on known POI-associated genes (31-295 genes in current panels) [4] [9] [5]
- Whole exome sequencing (WES): Captures all protein-coding regions, enabling novel gene discovery
Table 2: Technical Comparison of Genetic Testing Platforms for POI
| Parameter | Array-CGH | Targeted NGS | Whole Exome Sequencing |
|---|---|---|---|
| Genomic Coverage | Genome-wide for CNVs | Predefined gene sets | All protein-coding regions |
| Variant Types Detected | CNVs (deletions/duplications) | SNVs, indels, small CNVs | SNVs, indels, small CNVs |
| Resolution | 60 kb - 5 Mb [4] [10] | Single nucleotide | Single nucleotide |
| POI-Specific Utility | X-chromosome CNVs, autosomal CNVs | Known POI genes, oligogenic hits | Novel gene discovery |
| Limitations | Misses balanced rearrangements, SNVs | Limited to panel genes | Lower coverage for CNVs |
| Cost & Infrastructure | Moderate | Moderate | Higher |
Complementary Diagnostic Value
Recent studies demonstrate the complementary nature of array-CGH and NGS in POI investigation:
- A 2025 study of 28 idiopathic POI patients utilizing both technologies identified genetic anomalies in 57.1% (16/28 patients): 3.6% had causal CNVs only, 28.6% had causal SNVs/indels only, and 25% had variants of uncertain significance [4]
- Another study using a 295-gene NGS panel found at least one genetic variant in 75% of 64 early-onset POI patients, with 34% having ≥3 variants—supporting an oligogenic etiology [9]
- Research highlights that each method identifies distinct aspects of POI genetic architecture, with minimal overlap in detectable variants [4] [11]
Figure 1: Comprehensive Genetic Testing Strategy for Idiopathic POI. The sequential application of array-CGH and NGS technologies maximizes diagnostic yield in idiopathic POI cases.
Research Protocols for Genetic Investigation of POI
Integrated Array-CGH and NGS Workflow
Objective: To comprehensively identify genetic variants (CNVs, SNVs, indels) in idiopathic POI patients using combined array-CGH and NGS approaches.
Sample Requirements:
- Peripheral blood collected in EDTA tubes (3-5 ml)
- Minimum DNA quantity: 50 ng for array-CGH, 10-50 ng for NGS
- DNA quality: A260/A280 ratio of 1.8-2.0
Array-CGH Protocol (adapted from [4] [10]):
- DNA Extraction: Use automated systems (e.g., QIAsymphony) with commercial kits (e.g., QIAsymphony DNA Midi Kits)
- Quality Control: Verify DNA integrity and purity via spectrophotometry and agarose gel electrophoresis
- Labeling and Hybridization:
- Digest 500 ng patient and reference DNA with restriction enzymes
- Label patient DNA with Cy5-dUTP and reference DNA with Cy3-dUTP using random priming
- Hybridize labeled DNA onto 180K-400K oligonucleotide arrays (e.g., Agilent SurePrint G3) for 24-40 hours at 65°C with rotation
- Washing and Scanning:
- Wash arrays with increasing stringency buffers
- Scan using microarray scanner (e.g., Agilent G2565BA)
- Data Analysis:
- Process images with Feature Extraction software
- Analyze CNVs using bioinformatics tools (e.g., Agilent CytoGenomics, Cartagenia Bench Lab)
- Interpret variants using databases (DGV, DECIPHER, ClinGen)
Targeted NGS Protocol (adapted from [4] [9] [5]):
- Library Preparation:
- Use custom capture designs (e.g., Agilent SureSelect XT-HS) targeting 163-295 POI-associated genes
- Perform enzymatic fragmentation of 10-50 ng DNA
- Ligate adapter sequences and amplify with index primers
- Target Enrichment:
- Hybridize library to biotinylated RNA baits covering target regions
- Capture using streptavidin-coated magnetic beads
- Sequencing:
- Load onto NGS platforms (e.g., Illumina NextSeq 550, Ion Torrent S5)
- Sequence with minimum 100x coverage, 90% of targets ≥50x
- Bioinformatic Analysis:
- Align reads to reference genome (GRCh37/hg19) using BWA-MEM or TMAP
- Call variants with GATK UnifiedGenotyper or Torrent Variant Caller
- Annotate variants using Ion Reporter, Varsome, or custom pipelines
- Variant Interpretation:
- Filter against population databases (gnomAD)
- Classify according to ACMG/AMP guidelines
- Correlate with clinical and familial data
Key Methodological Considerations
- Quality Metrics: For array-CGH, derivative log ratio spread (DLRS) <0.25 indicates high-quality data [10]. For NGS, >90% of target bases should have ≥50x coverage [4]
- CNV Detection from NGS: Utilize read-depth based algorithms to identify exon-level CNVs from NGS data [11]
- Validation: Confirm pathogenic CNVs by FISH or MLPA; validate likely pathogenic SNVs by Sanger sequencing
Essential Research Reagents and Solutions
Table 3: Key Research Reagents for POI Genetic Investigation
| Reagent/Solution | Application | Function | Example Products |
|---|---|---|---|
| DNA Extraction Kits | Nucleic acid purification | High-quality DNA isolation from blood/tissue | QIAsymphony DNA Midi Kits [4] |
| CGH Microarray Kits | CNV detection | Genome-wide copy number analysis | Agilent SurePrint G3 Human CGH Microarray 4×180K [4] |
| NGS Library Prep Kits | Targeted sequencing | Library construction for NGS | Agilent SureSelect XT-HS [4], Ion AmpliSeq Library Kit Plus [5] |
| Target Enrichment Panels | Gene-specific capture | POI gene selection and enrichment | Custom designs (163-295 genes) [4] [9] |
| Sequence Adaptors & Barcodes | Sample multiplexing | Library indexing for pooled sequencing | Illumina Nextera, Ion Xpress Barcode Adapters [9] [5] |
| Hybridization Buffers & Cot-1 DNA | Array-CGH/NGS capture | Blocking repetitive sequences during hybridization | Agilent SureHyb, Human Cot-1 DNA [10] |
| Bioinformatics Software | Data analysis | Variant calling, annotation, and interpretation | CytoGenomics [4], Alissa Interpret [4], Ion Reporter [5] |
Biological Pathways and Mechanisms
POI-associated genes cluster in specific biological pathways essential for ovarian function:
Figure 2: Biological Pathways Implicated in POI Pathogenesis. Genetic variants associated with POI disrupt critical processes in ovarian development, DNA integrity maintenance, and cellular metabolism.
The oligogenic nature of POI is increasingly recognized, where combinations of variants across multiple pathways cumulatively contribute to disease pathogenesis [9]. Gene ontology analysis of POI-associated variants identifies enrichment in:
- Cell cycle, meiosis, and DNA repair
- Extracellular matrix remodeling
- Reproduction-specific processes
- Cell metabolism and proliferation
- NOTCH and WNT signaling pathways [9]
The integration of array-CGH and NGS technologies represents a transformative approach to resolving the unexplained majority of POI cases. The combined diagnostic yield of 57.1% demonstrated in recent studies substantially improves upon traditional testing strategies [4]. This enhanced genetic resolution has profound implications:
- Clinical management: Enables personalized surveillance for associated comorbidities
- Reproductive counseling: Provides accurate recurrence risk assessment
- Therapeutic development: Identifies potential targets for intervention
- Preventive strategies: Facilitates fertility preservation in at-risk relatives
Future directions should focus on standardizing gene panels, refining CNV detection from NGS data, establishing functional validation pipelines, and exploring non-coding variants through whole-genome sequencing. As our understanding of POI genetics evolves, so too will our ability to provide precise diagnoses and develop targeted interventions for this complex disorder.
Array Comparative Genomic Hybridization (array-CGH) is a high-resolution molecular cytogenetic technique that has revolutionized the detection of genomic copy number variations (CNVs). This technology enables researchers and clinicians to identify chromosomal imbalances across the entire genome, providing crucial insights into the genetic basis of various diseases and disorders. In the context of Premature Ovarian Insufficiency (POI) research, accurate CNV detection is paramount, as genetic alterations play a significant role in its etiology. This application note details the fundamental principles, experimental protocols, and analytical frameworks of array-CGH, positioning it within the broader comparative landscape with Next-Generation Sequencing (NGS) for POI genetic diagnosis. Array-CGH remains a powerful tool in clinical diagnostics, having detected pathogenic CNVs in up to 20% of individuals with developmental delay or intellectual disability [12], and continues to provide critical data for understanding genetic disorders.
Core Principles of Array-CGH
Array-CGH operates on the fundamental principle of competitive hybridization to detect relative changes in DNA copy number between test and reference samples. The methodology involves the simultaneous hybridization of fluorescently labeled test and reference DNA samples to a microarray containing thousands of immobilized DNA probes that target specific genomic regions.
The core detection mechanism relies on fluorescence ratio analysis. Test DNA is typically labeled with one fluorescent dye (e.g., Cy3, generating a green signal), while reference DNA from a healthy individual with normal copy number is labeled with a different fluorescent dye (e.g., Cy5, generating a red signal). The two samples are mixed in equal quantities and hybridized to the array platform. Following hybridization, the array is scanned to measure fluorescence intensity at each probe location [13].
The resulting fluorescence ratios provide a quantitative measure of copy number differences. When a genomic region in the test sample has a normal copy number (diploid), the test and reference DNA bind equally, resulting in a balanced fluorescence signal that appears yellow (equal combination of red and green). If a deletion is present in the test sample, the region shows reduced test DNA binding, resulting in a predominant red signal. Conversely, if a duplication or amplification is present, the region shows increased test DNA binding, resulting in a predominant green signal [11] [13].
The fluorescence intensity data is converted to log2 ratios for analytical purposes. For each probe, the log2 ratio of test to reference signal intensity is calculated. A ratio of zero indicates equal copy number (normal diploid), positive values indicate copy number gains, and negative values indicate copy number losses. The resolution of array-CGH is determined by multiple factors including probe type, density, and genomic distribution, with higher-density arrays capable of detecting smaller CNVs [11] [12].
Figure 1: Array-CGH Workflow from Sample Preparation to CNV Detection
Experimental Protocol
The array-CGH protocol involves multiple critical steps that require precise execution to generate high-quality, reproducible data. The following detailed methodology has been optimized for reliable CNV detection in genetic research applications.
DNA Preparation and Labeling
High-quality DNA is essential for successful array-CGH analysis. Extract genomic DNA from patient and reference samples using validated methods, ensuring minimal degradation and protein contamination. Quantify DNA using fluorometric methods for accuracy, and verify quality by gel electrophoresis or similar approaches [14].
Labeling Reaction Protocol:
- Thaw nucleotides and primers at 4°C protected from light for approximately one hour, then equilibrate at room temperature for 30 minutes.
- Equilibrate DNA samples (1 μg per reaction) for 15 minutes at 60°C.
- Dispense nuclease-free water into a 96-well plate, then transfer DNA samples to appropriate wells.
- Add 20 μL of equilibrated nucleotides and primers to each DNA sample.
- Seal the plate with strip caps, ensuring a tight seal to prevent evaporation.
- Denature DNA at 99°C for 10 minutes in a PCR machine with heated lid, then snap-cool on ice for 5 minutes to anneal primers.
- Add 10 μL of clean-up exo DNA polymerase enzyme to each sample, mix by pipetting, and incubate at 37°C for 16 hours [14].
Purification of Labeled DNA:
- Terminate the labeling reaction by adding 5 μL of stop buffer per well.
- Transfer contents to pre-labeled 2 mL tubes and purify using DNA purification spin columns.
- Bind labeled DNA to silica membrane using 250 μL of high-salt DNA binding buffer.
- Wash membranes twice with 500 μL of wash buffer each to remove impurities.
- Elute purified labeled DNA with 15 μL of low-salt elution buffer, recovering approximately 12 μL of purified product [14].
Hybridization and Washing
Hybridization Mix Preparation:
- Preheat hybridization oven to 65°C and pre-warm backing slides and hybridization chambers.
- Prepare hybridization mix by combining:
- 1.1 μL of Cot-1 DNA
- 4.95 μL of manufacturer-supplied blocking mix
- 24.75 μL of hybridization buffer
- Allocate this mix into each well of a new 96-well plate using a liquid handling robot, pre-wetting tips to enhance transfer accuracy.
- Add 9.35 μL of Cy3-labeled test DNA and 9.35 μL of Cy5-labeled reference DNA to each well.
- Seal the plate, vortex for one minute, and centrifuge briefly to collect contents.
- Denature labeled DNA at 95°C for 3 minutes, followed by 30 minutes at 37°C [14].
Array Assembly and Hybridization:
- Working on a 42°C heated platform, place the backing slide into the hybridization chamber, ensuring the transparent gasket aligns with the window.
- Slowly pipette 42 μL of hybridization mix into the center of each position on the array backing slide, avoiding contact with rubber ring boundaries.
- Carefully lower the array slide onto the backing slide and assemble the hybridization chamber, ensuring the side with writing faces the backing slide.
- Tighten the hybridization chamber screw fully and inspect for leakage.
- Verify that air bubbles (approximately 4mm in height) move freely when rotating the chamber.
- Place hybridization chambers in a rotating oven at 65°C for 24 hours [14].
Post-Hybridization Washing:
- Submerge hybridization chambers in wash buffer one and carefully pry slides apart using plastic forceps.
- Discard gasket slides and place array slides in a rack submerged in fresh wash buffer one.
- Wash array slides in approximately 700 mL of wash buffer one for 1-5 minutes with vigorous stirring.
- Transfer array slides to approximately 700 mL of wash buffer two for 90 seconds with vigorous stirring.
- Gently lift array slides from buffer – they should emerge dry.
- Load array slides into scanner holders with protectors and scan according to manufacturer's instructions [14].
Data Analysis and Interpretation
Array-CGH data analysis transforms raw fluorescence measurements into meaningful biological insights through a multi-step computational process. The initial scanner data provides fluorescence intensity values for each probe, which are processed to identify statistically significant CNVs while accounting for technical variability.
The primary analytical transformation involves calculating log2 ratios for each probe. The log2 ratio of test to reference signal intensity provides a normalized measure of copy number variation, where values cluster around zero for normal diploid regions, show positive values for gains, and negative values for losses. For example, a single-copy gain typically produces a log2 ratio of approximately 0.58, while a single-copy loss produces a ratio of approximately -1.0 [15] [13].
Advanced statistical methods are required to distinguish true CNVs from background noise. Early approaches used moving window thresholds, but these were prone to false positives and negatives. Contemporary methods employ sophisticated algorithms such as Conditional Random Fields (CRFs), which effectively combine data smoothing, segmentation, and copy number state decoding into a unified framework. CRFs outperform traditional Hidden Markov Models by capturing long-range spatial dependencies in the data through flexible feature functions that integrate information from genomic regions rather than individual data points [15].
Segmentation algorithms identify genomic regions with consistent log2 ratios, defining CNV boundaries. Post-segmentation, segments are classified as single-copy gain, single-copy loss, normal, or multiple gains/losses based on their mean log2 ratio values and size. Interpretation requires careful consideration of probe density, signal-to-noise ratio, and known copy number polymorphisms in reference databases [12] [15].
Figure 2: Array-CGH Data Analysis Workflow from Raw Data to Biological Interpretation
The Scientist's Toolkit: Essential Research Reagents
Successful array-CGH experiments require specific, high-quality reagents and materials at each processing stage. The following table details essential research reagent solutions for array-CGH workflows.
Table 1: Essential Research Reagents for Array-CGH Experiments
| Reagent/Material | Function | Application Notes |
|---|---|---|
| High-Quality Genomic DNA | Source of genetic material for CNV analysis | Minimal degradation; protein contamination <1%; concentration ≥50 ng/μL [14] |
| Fluorescent Nucleotides (Cy3, Cy5) | Differential labeling of test and reference DNA | Light-sensitive; equal incorporation efficiency critical [14] [13] |
| Cot-1 DNA | Blocks repetitive sequences | Reduces non-specific hybridization; improves signal-to-noise [14] |
| Hybridization Buffer | Provides optimal hybridization conditions | Maintains pH and stringency; composition varies by platform [14] |
| Microarray Slides | Platform for probe immobilization | Probe density determines resolution; various platforms available (60K-1M+) [11] |
| Wash Buffers | Remove non-specifically bound DNA | Stringency controls specificity; typically two buffers with different ionic strengths [14] |
| Scanning Solution | Enables fluorescence detection | Must be compatible with scanner and fluorophores [14] |
Array-CGH in POI Research: Comparison with NGS Approaches
In Premature Ovarian Insufficiency research, the selection of genomic analysis platforms requires careful consideration of technical capabilities and clinical requirements. Array-CGH and NGS represent complementary approaches with distinct strengths for CNV detection in POI genetic diagnosis.
Array-CGH provides comprehensive genome-wide coverage for detecting larger CNVs with high sensitivity and specificity. It has been established as a first-tier clinical test for individuals with developmental disorders, detecting pathogenic CNVs in up to 20% of cases with intellectual disability or developmental delay [12] [16]. The technology is particularly valuable for identifying known microdeletion and microduplication syndromes relevant to POI, with well-established interpretation guidelines and lower computational requirements compared to NGS approaches.
NGS-based CNV detection utilizes four primary methods: read-pair, split-read, read-depth, and assembly approaches. Read-depth methods, which analyze coverage depth differences between genomic regions, are most commonly used for CNV detection from exome sequencing data. These approaches can detect smaller CNVs than array-CGH, with resolutions down to hundreds of bases depending on coverage depth [11] [17]. A 2025 study demonstrated that integrating CNV analysis with exome sequencing data increased diagnostic yield by 4.6% in a diverse pediatric cohort, highlighting the complementary value of both SNV and CNV detection from a single platform [18].
Table 2: Comparison of Array-CGH and NGS for CNV Detection in POI Genetic Diagnosis
| Parameter | Array-CGH | NGS-Based CNV Detection |
|---|---|---|
| Optimal CNV Size Range | >50 kb [18] | Hundreds of bases to Mb+ [17] |
| Resolution Limit | Determined by probe density [11] | Limited by read depth and coverage [19] |
| Breakpoint Precision | Limited to probe spacing [11] | Single base-pair for split-read methods [17] |
| Coding Region Focus | No - covers entire genome [12] | Yes - for exome sequencing [11] |
| SNV Detection | No | Yes - simultaneous detection [18] |
| Throughput | Moderate | High [20] |
| Cost per Sample | $$ [11] | $$-$$$ [20] |
| Data Complexity | Moderate | High - requires specialized bioinformatics [19] |
| Diagnostic Yield | 5.7-20% in neurodevelopmental disorders [11] | Additional 4.6% yield over SNV-only analysis [18] |
The integration of both technologies offers a powerful approach for POI genetic diagnosis. Array-CGH serves as an excellent first-line test for detecting larger pathogenic CNVs, while NGS provides comprehensive variant detection including SNVs, indels, and smaller CNVs. A 2025 study highlighted that CNV analysis improved diagnostic yield across multiple phenotypes, referral sources, and ancestries, demonstrating its broad utility in genetic diagnosis [18]. As genomic technologies evolve, the combination of these approaches will continue to enhance our understanding of the genetic architecture of POI and other complex disorders.
Next-generation sequencing (NGS) represents a revolutionary technology for DNA and RNA sequencing that enables massive parallel sequencing of hundreds to thousands of genes or entire genomes within a relatively short timeframe [21]. This technology has fundamentally transformed the approach to genetic diagnosis in complex conditions such as premature ovarian insufficiency (POI), where genetic heterogeneity has traditionally challenged diagnostic efforts. As we frame this discussion within the broader comparison of array-based comparative genomic hybridization (array-CGH) versus NGS for POI genetic diagnosis research, it is crucial to understand that each technology offers distinct advantages and limitations. Array-CGH has served as a valuable tool for detecting copy number variations (CNVs) and has been considered a first-tier test for various neurodevelopmental disorders [22] [23]. However, emerging evidence suggests that NGS approaches may offer superior diagnostic yield in many clinical scenarios, particularly for conditions with significant genetic heterogeneity [11] [23].
The implementation of NGS in clinical diagnostics has created a paradigm shift, enabling researchers and clinicians to move beyond targeted analysis to comprehensive genomic assessment. For POI research, this transition is particularly relevant given the complex genetic architecture underlying the condition, which involves single nucleotide variants (SNVs), small insertions-deletions (indels), and CNVs across numerous genes. This application note provides a comprehensive overview of NGS fundamentals, from targeted panels to whole exome/genome sequencing, with specific consideration of their application in POI genetic diagnosis research compared to array-CGH methodologies.
Comparative Diagnostic Performance: NGS vs. Array-CGH
The selection of appropriate genomic analysis techniques requires careful consideration of their respective diagnostic capabilities. Recent studies directly comparing array-CGH and NGS approaches demonstrate significant differences in their diagnostic yields across various conditions.
Table 1: Comparative Diagnostic Yields of Array-CGH and NGS in Neurodevelopmental Disorders
| Phenotype Category | Array-CGH Diagnostic Yield | NGS Diagnostic Yield | Relative Improvement |
|---|---|---|---|
| Global Developmental Delay/Intellectual Disability (GDD/ID) | 5.7% | 20% | 3.5-fold |
| Autism Spectrum Disorder (ASD) | 3% | 6.1% | 2-fold |
| Other NDDs | 1.4% | 7.1% | 5-fold |
| Overall | 5.7% | 20% | 3.5-fold |
Data adapted from a study of 1,412 patients with neurodevelopmental disorders, 245 of whom underwent subsequent clinical exome sequencing [23]. This demonstrated NGS's significantly higher diagnostic yield across all categories except isolated ASD.
The diagnostic superiority of NGS is particularly evident in conditions with high genetic heterogeneity. In a study of patients with neurodevelopmental disorders, clinical exome sequencing solved 20% of cases compared to only 5.7% by array-CGH [23]. This trend extends to POI research, where the genetic heterogeneity similarly benefits from NGS's comprehensive approach. Array-CGH remains limited to detecting quantitative abnormalities (deletions or duplications) through fluorescence intensity comparisons between patient and control samples [11], while NGS can identify multiple variant types simultaneously.
Table 2: Technical Comparison of Genomic Analysis Methods for POI Research
| Parameter | Array-CGH | Targeted NGS Panels | Whole Exome Sequencing | Whole Genome Sequencing |
|---|---|---|---|---|
| Variant Types Detected | CNVs only | SNVs, indels, limited CNVs | SNVs, indels, some CNVs | SNVs, indels, CNVs, structural variants |
| Resolution | Limited by probe density | Single nucleotide | Single nucleotide | Single nucleotide |
| Coverage of Non-coding Regions | No | No | Limited | Comprehensive |
| POI-Relevant Genes Covered | Limited to known targets | Curated gene set (~50-100 genes) | ~4,000-5,000 disease-associated genes | All genomic regions |
| Turnaround Time | 5-10 days | 2-4 weeks | 4-8 weeks | 8-12 weeks |
| Cost | $$ | $$ | $$$ | $$$$ |
NGS Technology Fundamentals and Methodological Approaches
Core NGS Technologies and Principles
NGS technology utilizes a fundamentally different approach from traditional Sanger sequencing and array-based methods. The core principle involves massive parallel sequencing of hundreds of millions to billions of DNA fragments simultaneously, generating enormous sequencing depth and coverage [21] [24]. The most common approach, sequencing by synthesis (SBS), involves tracking the addition of fluorescently-labeled nucleotides as the DNA chain is copied, with each nucleotide emitting a distinct signal as it's incorporated into the growing DNA strand [24].
The NGS workflow comprises three fundamental steps: (1) library preparation, where DNA is fragmented and adapters are added; (2) sequencing through massive parallel analysis; and (3) bioinformatics analysis involving base calling, read alignment, variant identification, and annotation [21] [24]. This process enables a tunable resolution that can be focused on specific genomic regions or expanded to encompass the entire genome, providing exceptional flexibility for research applications.
NGS Methodological Approaches for POI Research
Targeted Gene Panels utilize hybridization or amplicon-based capture to isolate a predefined set of genes known to be associated with POI or related reproductive disorders [25]. This approach offers high analytical sensitivity through deep coverage (typically >500x) of the targeted sequences, making it particularly valuable when the patient's phenotype points to a well-characterized group of conditions with known genetic heterogeneity [25]. The selection of genes for inclusion in a POI diagnostic panel represents a critical step that directly affects both sensitivity and specificity, typically informed by curated gene-disease association databases and recent literature [25].
Whole Exome Sequencing (WES) expands the region of interest to include all protein-coding exons (approximately 1-2% of the genome) using hybrid capture-based enrichment methods [25]. This approach is ideal for POI cases with broader genetic heterogeneity or when previous targeted approaches have failed to identify causative variants. WES enables the detection of rare or novel variants across the exome, supporting both diagnostic accuracy and gene discovery [25]. Trio-based analysis (proband and parents) facilitates the detection of de novo, inherited, or compound heterozygous variants, providing critical insights into the genetic architecture of POI.
Whole Genome Sequencing (WGS) provides the most comprehensive view of the human genome by capturing both coding and non-coding regions without prior enrichment [25]. Although currently associated with higher costs and greater computational challenges, WGS allows for detection of a broader range of variant types, including structural variants, CNVs, and deep intronic mutations that may be relevant to POI pathogenesis but missed by other methods [25].
Experimental Protocols for POI Genetic Diagnosis
Protocol 1: Targeted NGS Panel for POI
Objective: To identify pathogenic SNVs, indels, and limited CNVs in genes associated with POI.
Methodology:
- DNA Extraction and Quality Control: Extract genomic DNA from peripheral blood using standardized kits. Quantify DNA using fluorometric methods and assess quality via agarose gel electrophoresis or fragment analyzer. Minimum requirement: 50-100ng DNA with OD 260/280 ratio of 1.8-2.0 [21] [25].
- Library Preparation: Fragment DNA using mechanical shearing (sonication) or enzymatic digestion to 100-300bp fragments. Repair ends, add A-overhangs, and ligate with sample-specific indexed adapters to enable multiplexing [21].
- Target Enrichment: Hybridize library with biotinylated probes targeting a curated set of POI-associated genes (e.g., BMP15, FMRI, FOXL2, etc.). Capture target-bound fragments using streptavidin-coated magnetic beads. Wash away non-specific fragments [25].
- Sequencing: Amplify captured libraries via PCR. Load onto NGS platform (e.g., Illumina, Ion Torrent). Sequence with minimum 150bp paired-end reads at >500x mean coverage. Ensure >95% of target bases covered at ≥50x [25].
- Bioinformatic Analysis:
- Base Calling and Read Alignment: Generate FASTQ files, align to reference genome (GRCh38) using BWA-MEM or similar aligner [21] [25].
- Variant Calling: Identify SNVs/indels using GATK HaplotypeCaller. Detect CNVs using read depth-based algorithms (e.g., ExomeDepth, CNVkit) [11].
- Variant Filtering and Annotation: Filter against population databases (gnomAD, 1000 Genomes). Annotate functional impact using ANNOVAR, VEP. Prioritize rare (MAF<0.1%), protein-altering variants in POI-associated genes [25].
Quality Control Metrics:
- Minimum sequencing depth: 500x mean coverage
- >95% target bases covered at ≥50x
- Q30 score >85%
- Sample contamination <3%
Protocol 2: Comprehensive CNV Analysis Using NGS Data
Objective: To detect exon-level and multi-gene CNVs from targeted NGS or WES data in POI patients.
Methodology:
- Data Generation: Perform targeted NGS or WES as described in Protocol 1, ensuring uniform coverage across targets [11].
- Read Depth Normalization: Calculate normalized read depth ratios for each target region across all samples. Correct for GC content, amplification biases, and other technical variables [11].
- CNV Calling: Apply multiple algorithms to improve sensitivity and specificity:
- Read Depth-based Approach: Compare relative depth between regions using circular binary segmentation to identify regions with significant depth changes suggestive of deletions or duplications [11].
- B-Allele Frequency Analysis: For WES data with SNP-containing probes, analyze B-allele frequency patterns to identify regions with loss of heterozygosity or copy-neutral changes [11].
- Split Read and Paired-End Analysis: Identify breakpoints at base-pair resolution by detecting reads with unusual mapping patterns (large insert sizes, incorrect orientation) [11].
- Variant Prioritization: Filter CNVs against database of common population CNVs (DGV). Prioritize rare (<1% frequency) CNVs affecting POI-associated genes, particularly those encompassing entire genes or critical exons.
- Experimental Validation: Confirm clinically relevant CNVs using orthogonal methods such as digital PCR, MLPA, or array-CGH [11].
Quality Control Metrics:
- Minimum 100 samples per batch for robust normalization
- Correlation coefficient >0.95 between technical replicates
- Positive control samples with known CNVs included in each run
The Scientist's Toolkit: Essential Research Reagents and Materials
Table 3: Essential Research Reagents for NGS-Based POI Studies
| Reagent Category | Specific Examples | Function in Workflow | POI-Specific Considerations |
|---|---|---|---|
| NGS Library Preparation | Illumina Nextera Flex, KAPA HyperPrep, IDT xGen | Fragment DNA, add adapters, amplify libraries | Ensure coverage of POI-relevant genes (e.g., FMRI premutation detection) |
| Target Enrichment | IDT xGen Panels, Twist Human Core Exome, Agilent SureSelect | Capture genes/regions of interest | Custom panels should include established POI genes (BMP15, FMRI, FOXL2, etc.) |
| Sequencing Reagents | Illumina SBS Kits, Ion Torrent Semiconductor | Generate sequence data | High-quality reagents essential for detecting GC-rich regions common in gene families |
| Bioinformatics Tools | BWA-MEM, GATK, CNVkit, ANNOVAR | Align reads, call variants, predict impact | Custom gene panels for POI-specific variant interpretation |
| Quality Control | Agilent Bioanalyzer, Qubit dsDNA HS Assay | Assess DNA and library quality | Critical for accurate CNV detection in POI genes |
Analysis Pathways and Interpretation Frameworks
The decision pathway for POI genetic diagnosis illustrates the complementary nature of different genomic technologies. While array-CGH provides efficient detection of CNVs, NGS approaches offer a more comprehensive assessment of the diverse variant types that may underlie POI pathogenesis. The sequential application of these technologies, guided by clinical presentation and previous test results, maximizes diagnostic yield while considering resource utilization.
NGS technologies have fundamentally transformed the approach to POI genetic diagnosis, offering superior diagnostic yield compared to array-CGH alone in many scenarios. The strategic selection of NGS approach—targeted panels, whole exome sequencing, or whole genome sequencing—should be guided by the specific clinical context, available resources, and previous test results. For POI research, targeted panels provide a cost-effective first-line approach for detecting mutations in known genes, while WES and WGS offer powerful discovery tools for identifying novel genetic determinants.
The integration of NGS into POI research has revealed the remarkable genetic heterogeneity underlying this condition, with pathogenic variants identified in numerous genes across different biological pathways. As our understanding of POI genetics continues to evolve, NGS technologies will play an increasingly central role in both diagnostic and research settings, ultimately enabling more personalized management approaches for affected individuals. Future directions will likely include the integration of multi-omics data, enhanced bioinformatics algorithms for CNV detection from NGS data, and the growing application of long-read sequencing technologies to address currently challenging genomic regions.
Premature Ovarian Insufficiency (POI) is a clinically heterogeneous disorder characterized by the cessation of ovarian function before the age of 40, affecting approximately 1-3.7% of women [26] [27]. It is diagnosed by oligomenorrhea or amenorrhea for at least four months, coupled with elevated follicle-stimulating hormone (FSH) levels (>25 IU/L) on two occasions more than four weeks apart [26]. POI presents a significant cause of female infertility and is associated with serious long-term health complications, including osteoporosis, cardiovascular disease, and cognitive decline [27]. The etiological landscape of POI is complex, encompassing autoimmune, iatrogenic, and environmental factors; however, genetic causes contribute to approximately 20-25% of diagnosed cases, with a substantial proportion (up to 70%) remaining idiopathic [27] [4]. Advances in genomic technologies, particularly array comparative genomic hybridization (array-CGH) and next-generation sequencing (NGS), have dramatically accelerated the identification of novel genetic determinants, providing crucial insights into the molecular mechanisms governing ovarian development and function [26] [4].
This application note synthesizes current knowledge on key genetic targets and pathways implicated in POI, contextualized within the framework of utilizing array-CGH and NGS for genetic diagnosis and research. We provide a detailed primer for researchers and drug development professionals, including structured genetic data, experimental protocols for genetic analysis, and visualizations of biological pathways to facilitate the development of targeted diagnostic and therapeutic strategies.
Key Genetic Targets and Pathways
Genetic research has identified numerous genes associated with POI, which can be broadly categorized based on their biological functions in ovarian development and function. The genetic architecture includes chromosomal abnormalities, single nucleotide variations (SNVs), small insertions/deletions (indels), and copy number variations (CNVs) [27] [4].
Table 1: Major Functional Categories of POI-Associated Genes
| Functional Category | Description | Key Example Genes |
|---|---|---|
| Meiosis & DNA Repair | Genes critical for homologous recombination, meiotic nuclear division, and DNA damage repair during oocyte formation. | HFM1, SPIDR, BRCA2, KASH5, MCMDC2, MEIOSIN, SHOC1, STRA8 [26] |
| Folliculogenesis & Ovulation | Genes involved in follicle formation, activation, growth, and the ovulation process. | NOBOX, BMP15, GDF9, FIGLA, GALT, ALOX12, BMP6, ZAR1, ZP3 [26] [4] [28] |
| Ovarian & Gonadal Development | Genes regulating the initial formation and development of the ovaries and reproductive system. | NR5A1, LGR4, PRDM1 [26] |
| Mitochondrial Function | Genes essential for mitochondrial metabolism and energy production in oocytes. | TWNK, POLG, AARS2, MRPS22, CLPP [26] [28] |
| Metabolic & Autoimmune Regulation | Genes linking metabolic pathways or immune system function to ovarian maintenance. | AIRE, GALT, PMM2 [26] [28] |
Chromosomal Abnormalities and CNVs
Chromosomal abnormalities, particularly those involving the X chromosome, are among the most frequently identified genetic causes of POI, accounting for a significant proportion of cases [27]. CNVs, which are submicroscopic deletions or duplications of genomic DNA, can disrupt gene dosage and function, leading to ovarian dysfunction.
Key Genomic Regions:
- X Chromosome Anomalies: Turner Syndrome (45,X) is a major cause of POI, with critical regions for ovarian function located at Xq13-Xq21 (POI2) and Xq24-Xq27 (POI1) [27]. These regions contain genes crucial for meiotic progression and follicle survival.
- Autosomal CNVs: Array-CGH studies have identified pathogenic autosomal CNVs, such as a recurrent microdeletion at 15q25.2 encompassing the
CPEB1gene (involved in meiosis and mRNA translation), and CNVs of uncertain significance in regions like 15q26.1 (SLCO3A1) and 5q13.2 (NAIP) [4] [28].
Gene Mutations: Syndromic and Non-Syndromic POI
Beyond chromosomal disorders, mutations in specific genes can cause either isolated POI or POI as part of a broader syndrome.
Table 2: Key POI-Associated Genes and Mutation Characteristics
| Gene | Primary Function | Inheritance Pattern | Reported Phenotype | Prevalence in POI |
|---|---|---|---|---|
NR5A1 |
Gonadal development, steroidogenesis | Autosomal Dominant | PA, SA | ~1.1% [26] |
MCM9 |
DNA repair, meiosis | Autosomal Recessive | PA, SA | ~1.1% [26] |
EIF2B2 |
Mitochondrial function, stress response | Autosomal Recessive | SA | 0.8% (in cohort) [26] |
FIGLA |
Folliculogenesis, primordial follicle formation | Autosomal Dominant | PA | Reported [4] [28] |
FMR1 |
RNA processing, premutation (55-200 CGG repeats) | X-linked Dominant | SA | Common known cause [4] |
GALT |
Galactose metabolism | Autosomal Recessive | PA predominantly | Reported [26] |
TWNK |
Mitochondrial DNA replication | Autosomal Dominant | SA | Reported [28] |
AIRE |
Immune tolerance, prevents autoimmune oophoritis | Autosomal Recessive | Syndromic POI (APS-1) | Reported [26] |
Syndromic POI:
- Autoimmune Polyendocrine Syndrome Type 1 (APS-1): Caused by mutations in the
AIREgene, leading to autoimmune destruction of ovarian tissue [27] [26]. - Galactosemia: Primarily caused by biallelic pathogenic mutations in the
GALTgene, leading to toxic metabolite accumulation and accelerated follicular atresia, with 80-90% of affected women developing POI, often presenting as primary amenorrhea [27] [26].
Non-Syndromic POI:
Large-scale sequencing studies have identified numerous genes responsible for isolated POI. A 2023 study of 1,030 POI patients found pathogenic or likely pathogenic variants in 59 known POI-causative genes in 18.7% of cases [26]. Furthermore, association analyses revealed 20 novel candidate genes (LGR4, CPEB1, KASH5, ZP3, etc.) with a significant burden of loss-of-function variants, expanding the genetic landscape of POI [26].
Genetic Analysis Workflows: Array-CGH vs. NGS
The choice between array-CGH and NGS is pivotal in genetic research and diagnostics for POI. Each technology has distinct strengths and limitations, making them complementary in practice.
Array-CGH Workflow for CNV Detection
Array-CGH remains the standard for genome-wide detection of CNVs with high sensitivity and robustness [11] [29].
Protocol: Array-CGH for POI Genetic Screening
- DNA Extraction: Isolate high-molecular-weight genomic DNA from patient peripheral blood samples using standardized kits (e.g., QIAsymphony DNA Midi Kits) [4] [28].
- DNA Labeling:
- Label patient DNA and a reference control DNA with different fluorescent dyes (e.g., Cy5 for patient and Cy3 for control) [11].
- Purify the labeled products to remove unincorporated dyes.
- Hybridization:
- Mix equal quantities of labeled patient and control DNA.
- Co-hybridize the mixture to a microarray slide (e.g., Agilent SurePrint G3 Human CGH 4x180K) containing oligonucleotide probes spanning the genome, including known POI-associated regions [4] [28].
- Incubate for 24-40 hours in a rotating hybridization oven at 65°C.
- Washing and Scanning: Wash the array slide with stringent buffers to remove non-specifically bound DNA and scan it using a microarray scanner (e.g., Agilent Scanner) to capture fluorescence intensities at each probe [4].
- Data Analysis:
- Import fluorescence data into bioinformatics software (e.g., Agilent CytoGenomics, Cartagenia Bench Lab CNV).
- Calculate log2 ratios of patient-to-control signal intensity for each probe.
- Use segmentation algorithms (e.g., CRF-CNV, CBS) to identify genomic regions with significant deviations from a log2 ratio of zero, indicating copy number loss (negative value) or gain (positive value) [15] [4].
- Interpretation: Annotate identified CNVs using population (e.g., DGV) and clinical (e.g., DECIPHER, ClinGen) databases. Classify CNVs according to ACMG guidelines, focusing on those impacting known POI genes or regions [4] [28].
Figure 1: Array-CGH Workflow for CNV Detection in POI.
NGS Workflow for SNV and Indel Detection
NGS enables comprehensive analysis of nucleotide-level variations across a panel of genes, the whole exome, or the entire genome [29] [26].
Protocol: NGS-Based Gene Panel Sequencing for POI
- Library Preparation:
- Sequencing: Load the library onto a sequencer (e.g., Illumina NextSeq 550). Perform sequencing-by-synthesis to generate short reads (e.g., 150 bp paired-end) with sufficient coverage (e.g., >100x mean coverage) for reliable variant calling [4] [28].
- Bioinformatic Analysis:
- Primary Analysis: Demultiplex sequenced samples and convert base calls to FASTQ files.
- Secondary Analysis:
- Align reads to a reference genome (e.g., GRCh37/hg19) using aligners like BWA.
- Perform base quality score recalibration and indel realignment.
- Call SNVs and indels using variant callers (e.g., GATK HaplotypeCaller).
- Tertiary Analysis:
- Annotate variants using databases (e.g., gnomAD, ClinVar, HGMD).
- Filter variants based on population frequency (e.g., MAF < 0.01), predicted impact, and segregation with disease.
- Variant Interpretation:
Figure 2: NGS Workflow for SNV/Indel Detection in POI.
Integrated Diagnostic Approach and Research Applications
Complementary Role of Array-CGH and NGS
Array-CGH and NGS are not mutually exclusive but are highly complementary. Array-CGH excels at detecting CNVs, while NGS is superior for identifying sequence-level variations. A combined approach maximizes diagnostic yield.
Table 3: Comparison of Array-CGH and NGS for POI Genetic Analysis
| Feature | Array-CGH | NGS (Targeted Panel/Whole Exome) |
|---|---|---|
| Primary Detectable Variants | Copy Number Variations (CNVs) | Single Nucleotide Variants (SNVs), small Indels, some CNVs |
| Resolution | Limited by probe density (e.g., ~60 kb with 180K array) [4] | Single-base-pair for SNVs/Indels; ~exon-level for CNVs via read-depth [11] |
| Best For | Genome-wide CNV screening, detecting large deletions/duplications | Interrogating coding regions of many genes simultaneously, identifying point mutations |
| Limitations | Cannot detect balanced rearrangements or low-level mosaicism; cannot identify SNVs [30] | CNV detection from exome data is less standardized and can miss non-coding or whole-gene CNVs [11] |
| Diagnostic Yield in POI | ~14.3% (CNVs of interest) [4] | ~28.6% (P/LP SNVs/Indels) [4]; up to 23.5% combined yield in large studies [26] |
Evidence for a Combined Approach: A 2025 study of 28 idiopathic POI patients that utilized both array-CGH and an NGS gene panel found a remarkable overall diagnostic yield of 57.1%. Array-CGH identified clinically relevant CNVs in 14.3% of patients, while NGS identified pathogenic SNVs/indels in 28.6% of patients. This demonstrates that using both methods in tandem can uncover a genetic etiology in a majority of idiopathic cases [4] [28].
Pathway Visualization and Functional Insights
Integrating genetic data from both technologies helps map disruptions onto key biological pathways essential for ovarian function. The following diagram synthesizes the primary pathways implicated by the key genetic targets discussed.
Figure 3: Key Pathways and Genetic Targets in POI. Genes are color-coded by their primary associated functional pathway.
The Scientist's Toolkit
Table 4: Essential Research Reagent Solutions for POI Genetic Analysis
| Reagent / Material | Function / Application | Example Product / Technology |
|---|---|---|
| High-Throughput Microarray | Genome-wide CNV profiling with defined resolution. | Agilent SurePrint G3 CGH Microarray (e.g., 4x180K) [4] |
| Targeted Hybrid Capture Panel | Enriching a defined set of POI-associated genes for NGS. | Agilent SureSelect XT-HS Custom Design (e.g., 163 genes) [4] [28] |
| NGS Platform | High-throughput sequencing of DNA libraries. | Illumina NextSeq 550 System [4] |
| Bioinformatics Software | CNV calling and visualization from array-CGH data. | Agilent CytoGenomics; Cartagenia Bench Lab CNV [4] |
| Bioinformatics Software | SNV/Indel calling, annotation, and interpretation from NGS data. | Alissa Align&Call & Alissa Interpret; GATK [4] |
| Variant Databases | Pathogenicity interpretation and population frequency filtering. | gnomAD, ClinVar, HGMD, DECIPHER [4] [26] |
The genetic investigation of POI has been revolutionized by array-CGH and NGS technologies. Array-CGH provides a robust method for detecting CNVs, while NGS allows for the comprehensive screening of sequence-level variations across a vast number of genes. A combined approach is paramount, as evidenced by studies showing a diagnostic yield exceeding 50% when both methods are employed [4] [28]. The continued identification of novel genes and pathways through these technologies not only enhances diagnostic precision but also deepens our understanding of the fundamental biological processes governing ovarian function. This expanding genetic knowledge is the foundation for developing future targeted therapies and improving personalized management for women with POI.
Bench to Bedside: Implementing Array-CGH and NGS Workflows for POI Analysis
Premature Ovarian Insufficiency (POI) is a clinically heterogeneous disorder affecting approximately 1% of women under 40, characterized by the loss of ovarian activity before the expected age of menopause. While multiple etiologies exist, genetic factors contribute substantially to its pathogenesis, with a familial form identified in 12-31% of cases [4]. In the diagnostic evaluation of POI, array-based comparative genomic hybridization (array-CGH) has emerged as a powerful genome-wide screening tool for detecting copy number variations (CNVs)—submicroscopic chromosomal deletions and duplications that account for a significant portion of idiopathic cases. Array-CGH enables high-resolution detection of genomic imbalances across the entire genome in a single assay, providing a distinct advantage over targeted genetic approaches [31] [32]. This technical deep dive explores the complete array-CGH workflow, from DNA hybridization to CNV calling, with specific application to POI genetic research.
Table 1: Key Genetic Studies of Array-CGH in POI
| Study Focus | Cohort Size | CNV Detection Rate | Key Findings |
|---|---|---|---|
| Idiopathic POI Diagnosis [4] | 28 patients | 1/28 (3.6%) with causal CNV | Array-CGH identified a pathogenic 15q25.2 deletion; combined with NGS, genetic anomalies were found in 57.1% of patients |
| Pediatric Endocrine Disorders [31] | 24 patients with 46,XY DSD | 3/24 (12.5%) with submicroscopic deletions | Identified microdeletions in far upstream regulatory regions of critical genes like SOX9 |
| Hereditary Gynecomastia [31] | N/S | N/S | Discovered upstream CNVs affecting CYP19A1 (aromatase) expression, demonstrating how CNVs can disrupt gene regulation |
Array-CGH Fundamental Principles
Array-CGH operates on the principle of competitive hybridization between test and reference DNA samples to detect relative copy number changes across the genome [33]. In this process, patient (test) and control (reference) DNA are labeled with different fluorescent dyes—typically Cy5 (green) for patient DNA and Cy3 (red) for reference DNA [34] [15]. The differentially labeled samples are mixed in equal amounts and co-hybridized to a microarray slide containing thousands of immobilized DNA probes designed to span the genome at specific intervals [33] [35].
Following hybridization and washing, the array is scanned to measure fluorescence intensity at each probe location. The resulting fluorescence ratio is analyzed to determine copy number: equal hybridization appears yellow, increased green fluorescence indicates a duplication in the test sample, and increased red fluorescence signals a deletion [33]. The resolution of array-CGH is determined by the number, density, and genomic distribution of these probes, with modern clinical arrays typically detecting CNVs as small as 50-200 kilobases [33].
Experimental Workflow: Step-by-Step Protocol
Sample Preparation and DNA Labeling
The array-CGH process begins with DNA extraction from the patient's sample, which can include peripheral blood, chorionic villi, or amniotic fluid [4] [36]. For formalin-fixed paraffin-embedded (FFPE) samples, specialized labeling systems are required to address DNA fragmentation [34]. Quality control of extracted DNA is critical, with spectrophotometric or fluorometric quantification ensuring optimal input material.
For standard array-CGH, the protocol involves several key steps [34] [35]:
- DNA Digestion: Genomic DNA is typically digested with restriction enzymes (such as Alu I and Rsa I) to generate smaller fragments [34].
- Fluorescent Labeling: Patient and reference DNA are differentially labeled using random primed amplification with fluorescent nucleotides. Common dye systems include Alexa Fluor 3 and Alexa Fluor 5, or Cy3 and Cy5 [34].
- Purification: Unincorporated dyes are removed using purification columns or similar methods to reduce background noise [34].
The BioPrime Total Array CGH system exemplifies a optimized labeling approach that improves signal-to-noise ratios and reduces channel bias through master mix formulations containing optimized dye-labeled nucleotides and improved buffer chemistry [34].
Hybridization and Washing
The labeled patient and reference DNA are combined with Cot-1 DNA (to block repetitive sequences) and hybridization buffer before application to the microarray [34]. The array itself contains oligonucleotide DNA probes spotted onto glass slides, with probe distribution potentially including backbone genome coverage and enhanced density in gene-rich or clinically relevant regions [33] [35]. For POI research, arrays can be customized with additional probes covering ovarian function genes or known POI-associated genomic regions.
Hybridization typically occurs at 37°C for 24 hours in a specialized hybridization chamber to prevent evaporation [35]. Post-hybridization, rigorous washing removes non-specifically bound DNA, enhancing signal specificity for accurate CNV detection.
Computational Analysis: From Fluorescence to CNV Calls
Data Normalization and Quality Control
Following array scanning, the fluorescence intensity data undergoes extensive computational processing. The raw image files are quantified using software such as GenePix Pro, which extracts foreground and background intensity values for each probe [15] [35]. Subsequent normalization procedures correct for technical artifacts including spatial biases, intensity-dependent effects, and dye-related variations [15].
A critical normalization approach for array-CGH data involves:
- Spot rejection based on robust estimation of background intensity distributions
- Quantile normalization to balance single-channel intensities between arrays
- Dye-bias correction by combining data from dye-swap experiments [15] [35]
For oligonucleotide arrays, such as the Agilent 180K platform used in POI studies, data analysis is typically performed using dedicated software packages like Agilent CytoGenomics with the appropriate statistical algorithms [4].
Segmentation and CNV Calling Algorithms
The core computational challenge in array-CGH analysis is accurately identifying segment boundaries where copy number changes occur. Numerous algorithms have been developed for this purpose, with the Conditional Random Fields (CRF) approach demonstrating particular efficacy [15]. Unlike traditional Hidden Markov Models (HMMs) that are limited to first-order dependencies, CRF-based methods can incorporate long-range spatial information and effectively combine smoothing, segmentation, and classification into a unified framework [15].
The CRF-CNV method implements a linear-chain conditional random field model that defines meaningful feature functions using observed data from genomic regions rather than single data points [15]. This approach has demonstrated superior performance compared to Bayesian HMM methods, with higher precision in copy number assignments while maintaining comparable breakpoint detection accuracy [15].
Table 2: Computational Tools for Array-CGH Analysis
| Software/Algorithm | Methodology | Applications in POI Research |
|---|---|---|
| CRF-CNV [15] | Conditional Random Fields | Effectively combines smoothing, segmentation, and state decoding; handles long-range spatial dependencies |
| CytoGenomics [4] | Commercial solution with multiple algorithms | Used in recent POI studies for CNV detection and visualization |
| Cartagenia Bench Lab CNV [4] [36] | AnnotSV-based annotation and classification | Facilitates CNV interpretation against clinical databases (DECIPHER, DGV, ClinVar) |
| Bayesian HMM [15] | Hidden Markov Models | Earlier approach with limitations in capturing long-range dependencies |
The Scientist's Toolkit: Essential Research Reagents
Table 3: Key Research Reagent Solutions for Array-CGH
| Reagent/Kit | Function | Application Notes |
|---|---|---|
| BioPrime Total Array CGH System [34] | Genomic DNA labeling | Optimized for Agilent platforms; includes restriction enzymes and purified dyes; reduces channel bias |
| BioPrime Total FFPE System [34] | DNA labeling from FFPE samples | Utilizes enzymatic random primed amplification for suboptimal samples |
| Cot-1 DNA [34] | Blocking repetitive sequences | Critical for reducing background noise during hybridization |
| SurePrint G3 Human CGH Microarray [4] | Oligonucleotide microarray platform | Used in recent POI studies (e.g., 4×180K format) |
| QIAsymphony DNA Kit [4] | Automated DNA extraction | Ensures high-quality DNA input from blood samples |
Integration with POI Research and Complementary Techniques
In POI research, array-CGH has identified clinically relevant CNVs in genes and regulatory regions critical for ovarian function. A 2025 study demonstrated that combining array-CGH with next-generation sequencing (NGS) identified genetic anomalies in 57.1% of idiopathic POI patients, with array-CGH specifically detecting pathogenic CNVs such as a 15q25.2 deletion [4]. Array-CGH has also revealed CNVs affecting gene regulation in POI, including upstream deletions of SOX9 and rearrangements near CYP19A1 (aromatase) that alter gene expression patterns [31].
While array-CGH excels at detecting CNVs, it cannot identify balanced chromosomal rearrangements or single nucleotide variants. Thus, integration with NGS provides a comprehensive genetic assessment [11]. Recent studies suggest that for neurodevelopmental disorders, clinical exome sequencing solved 20% of cases compared to 5.7% by array-CGH alone, though each method identifies unique variants [23]. In POI diagnostics, a combined approach maximizes diagnostic yield, with each technology complementing the other's limitations.
Interpretation and Clinical Translation in POI
The final critical step in array-CGH workflow is the biological interpretation and clinical classification of detected CNVs. Following ACMG/ClinGen guidelines, CNVs are categorized as pathogenic, likely pathogenic, variant of uncertain significance (VUS), likely benign, or benign [4] [36]. This classification integrates evidence from population databases (e.g., Database of Genomic Variants), disease databases (e.g., DECIPHER, ClinVar), and the scientific literature [4] [36].
In POI research, particular attention is paid to CNVs encompassing genes with established roles in ovarian development and function, such as those involved in meiosis, folliculogenesis, and DNA repair [4]. A significant challenge is that approximately 10-15% of reported CNVs initially fall into the VUS category [36]. Regular reanalysis is essential, as one study showed that 40.9% of VUS were reclassified upon reinterpretation, with 4.6% upgraded to likely pathogenic/pathogenic [36]. This dynamic interpretation landscape underscores the importance of periodic reevaluation of array-CGH findings in POI patients, especially as new gene-disease associations emerge.
For validated CNVs, orthogonal confirmation methods such as quantitative PCR or FISH are recommended before reporting clinically relevant findings [35]. This comprehensive approach to interpretation and validation ensures that array-CGH contributes meaningfully to the genetic diagnosis of POI, enabling improved genetic counseling and personalized management for affected individuals and their families.
Premature Ovarian Insufficiency (POI) is a clinically heterogeneous disorder characterized by the loss of ovarian function before age 40, affecting approximately 1-3.7% of women [1] [2] [9]. The etiological spectrum of POI has shifted significantly in recent decades, with the idiopathic fraction decreasing from 72.1% to 36.9% as diagnostic capabilities, particularly genetic diagnosis, have improved [2]. While chromosomal abnormalities and FMR1 premutations represent known causes, the majority of cases are now understood to involve highly heterogeneous genetic factors, with more than 75 candidate genes implicated in pathogenesis [2].
The integration of next-generation sequencing (NGS) technologies has revolutionized POI genetic research, enabling simultaneous analysis of multiple candidate genes and revealing a complex oligogenic architecture in many cases [9]. This application note provides a comprehensive framework for designing targeted NGS panels for POI investigation, with emphasis on gene selection strategies and hybridization capture methodologies within the comparative context of array-CGH for POI genetic diagnosis research.
POI Genetic Landscape and Target Selection Rationale
Current Genetic Understanding of POI
The genetic architecture of POI encompasses genes involved in multiple biological pathways essential for ovarian function, with recent evidence supporting an oligogenic inheritance pattern where multiple genetic variants collectively contribute to disease manifestation [9]. Several large-scale NGS studies have demonstrated this complexity:
- A study of 500 Chinese Han POI patients using a 28-gene panel identified pathogenic/likely pathogenic variants in 14.4% of cases, with FOXL2 harboring the highest occurrence frequency at 3.2% [37].
- Research on 64 Italian POI patients using a 295-gene panel found that 75% carried at least one genetic variant, with many patients carrying multiple variants (17% with two variants, 14% with three variants) [9].
- A comprehensive study combining array-CGH and NGS in 28 idiopathic POI patients detected genetic anomalies in 57.1% of patients, with one patient carrying a causal copy number variation (CNV) and eight patients carrying causal single nucleotide variations (SNVs)/indel variations [4].
Gene Panel Composition Strategy
Table 1: Recommended Gene Categories for POI NGS Panel Design
| Category | Biological Function | Key Representative Genes | Prevalence in POI Cohorts |
|---|---|---|---|
| Meiosis & DNA Repair | Chromosomal pairing, recombination, DNA damage repair | HFM1, SPIDR, SMC1B, MSH4, MSH5, CSB-PGBD3, DMC1, NBN |
~25% of identified cases [37] [9] |
| Transcription Factors | Regulation of gene expression in ovarian development | SOHLH1, POLR2C, FIGLA, NOBOX, NR5A1, FOXL2 |
FOXL2 variants: 3.2% [37] |
| Ligands & Receptors | Folliculogenesis, steroidogenesis, cell signaling | AMH, AMHR2, GDF9, BMP15, FSHR, BMPR2, PGRMC1, LIF-R |
Recurrent findings across studies [38] [37] |
| Inflammation-Related | Immune regulation, ovarian aging, follicular atresia | CXCL10, CX3CL1, IL-18R1, MCP-1/CCL2, TGF-β1 |
Causal role identified via MR [38] |
| Extracellular Matrix Remodeling | Follicular development, ovulation | MATN1, COLEC11, FBN2 |
Pathway identified in ontology analysis [9] |
Target selection should prioritize genes with strong biological plausibility and confirmed pathological evidence in human POI, while also including emerging candidate genes from transcriptomic and proteomic studies [9]. The panel design should balance comprehensive coverage with practical considerations of cost and interpretability.
Hybridization Capture-Based NGS Methodology
Hybridization capture-based NGS enables specific enrichment of genomic regions of interest through complementary base pairing between fragmented DNA libraries and designed oligonucleotide probes (baits) [39]. This method is particularly advantageous for POI research as it allows:
- Focused sequencing on curated gene sets with high coverage depth
- Efficient identification of single nucleotide variants (SNVs), small insertions/deletions (indels), and copy number variations (CNVs)
- Flexibility to update gene content as new POI genes are discovered
- Cost-effectiveness compared to whole exome or genome sequencing
Comparative Analysis: Array-CGH versus NGS for POI Diagnosis
Table 2: Comparison of Array-CGH and NGS Platforms for POI Genetic Diagnosis
| Parameter | Array-CGH | Targeted NGS (Hybrid Capture) |
|---|---|---|
| Primary Detection Capability | Copy Number Variations (CNVs) | SNVs, Indels, CNVs (via read depth) |
| Resolution | Limited to probe density (typically 60-400K) | Single nucleotide level |
| Diagnostic Yield in POI | 1 causal CNV in 28 patients (3.6%) [4] | 8 causal SNVs/Indels in 28 patients (28.6%) [4] |
| Combined Diagnostic Yield | 57.1% when both methods applied to same cohort [4] | 57.1% when both methods applied to same cohort [4] |
| CNV Detection Ability | Excellent for large gains/losses | Suitable for exon-level CNVs; may miss non-coding regions [11] |
| Oligogenic Analysis | Limited | Excellent (75% patients with ≥1 variant) [9] |
| Turnaround Time | 2-5 days | 3-7 days (including library prep and bioinformatics) |
| Cost Considerations | Moderate | Higher initial investment, lower cost per gene |
Workflow for POI NGS Panel Implementation
Detailed Experimental Protocols
Nucleic Acid Extraction and Quality Control
Protocol: DNA Extraction from Peripheral Blood
- Sample Requirement: 3-5 mL peripheral blood in EDTA tubes
- Extraction Method: Use QIAsymphony DNA midi kits on QIAsymphony system (Qiagen) or equivalent [4]
- Quality Control:
- Quantification: Quant-iT PicoGreen (Thermo Fisher Scientific) [9]
- Purity: A260/A280 ratio of 1.8-2.0
- Integrity: Agarose gel electrophoresis or Fragment Analyzer
- Storage: -20°C or -80°C in TE buffer
Library Preparation and Target Enrichment
Protocol: Hybrid Capture-Based Library Preparation
- DNA Input: 50-200 ng genomic DNA [9]
- Fragmentation: Enzymatic (Nextera Transposase) or acoustic shearing (200-500 bp)
- Library Preparation Kit: Illumina Nextera Rapid Capture or Agilent SureSelect XT-HS
- Adapter Ligation: Use platform-specific adapters with dual-index barcodes for multiplexing
- Hybridization Conditions:
- Bait Design: 120-170 bp RNA baits with tiling density 2-3x
- Hybridization Temperature: 65°C for 16-24 hours [39]
- Wash Stringency: Multiple washes at increasing stringency to remove non-specific binding
- Capture Method: Solution-based capture using biotinylated probes and streptavidin magnetic beads [39]
- Post-Capture Amplification: 10-14 cycles of PCR to enrich captured fragments
Sequencing and Data Analysis
Protocol: Sequencing Parameters and Bioinformatics
- Sequencing Platform: Illumina NextSeq 500 or similar [4] [9]
- Sequencing Depth: Minimum 100x mean coverage, >95% of targets at 20x [9]
- Read Configuration: 2×150 bp paired-end reads
- Bioinformatic Pipeline:
- Alignment: BWA-MEM against reference genome (GRCh37/hg19) [9]
- Variant Calling: GATK UnifiedGenotyper for SNVs/indels [9]
- CNV Detection: Read-depth based algorithms (e.g., ExomeDepth, CNVkit)
- Variant Annotation: ANNOVAR or SnpEff with population databases (gnomAD, 1000 Genomes) and clinical databases (ClinVar, HGMD)
- Variant Filtering: Frequency <0.1% in control populations, predicted deleteriousness (CADD >20, MetaSVM)
The Scientist's Toolkit: Essential Research Reagents
Table 3: Key Research Reagent Solutions for POI NGS Panel Implementation
| Reagent Category | Specific Products | Function in Workflow | Considerations for POI Research |
|---|---|---|---|
| DNA Extraction | QIAsymphony DNA Mid Kits [4] | High-quality DNA from blood | Ensure sufficient yield for library prep (≥50 ng) |
| Library Prep | Illumina Nextera Rapid Capture [9] | Fragmentation and adapter ligation | Optimal for low DNA input; incorporates barcodes |
| Target Enrichment | Agilent SureSelect XT-HS [4] | Hybridization-based capture | Custom bait design for POI gene panel |
| Sequence Capture | MyBaits (Arbor Bioscience) [39] | Solution-phase hybridization | Flexible custom design; RNA baits for efficiency |
| Quality Control | Agilent Bioanalyzer/TapeStation | Fragment size distribution | Critical for assessing library quality pre-sequencing |
| Sequencing | Illumina NextSeq 500/550 [4] [9] | High-throughput sequencing | Appropriate throughput for targeted panels |
| Variant Interpretation | Alissa Interpret (Agilent) [4] | Clinical variant analysis | Supports ACMG guideline implementation |
Integration with Complementary Methodologies
Combining NGS with Array-CGH for Comprehensive Diagnosis
For optimal diagnostic yield in POI, integrating NGS with array-CGH provides complementary advantages [4] [11]:
- Array-CGH excels at detecting chromosomal abnormalities and large CNVs, particularly important for X-chromosome anomalies present in 12-13% of POI cases [2]
- Targeted NGS identifies nucleotide-level variants in known POI genes and enables oligogenic analysis
- Sequential Testing Strategy: Array-CGH followed by NGS for idiopathic cases, or simultaneous testing for rapid diagnosis
Functional Validation of Genetic Findings
Genetic findings from NGS panels should be complemented by functional studies:
- In vitro models: KGN human granulosa-like tumor cell lines treated with cyclophosphamide to model POI [38]
- Protein analysis: Western blot validation of dysregulated proteins (e.g., MCP-1, TGF-β1, ARTN) [38]
- Transcriptional assays: Luciferase reporter assays to validate functional impact (e.g., FOXL2 p.R349G variant impairment) [37]
Targeted NGS panels utilizing hybridization capture technology represent a powerful approach for unraveling the complex genetic architecture of POI. Effective panel design requires careful curation of genes involved in key biological pathways, including meiosis, DNA repair, folliculogenesis, and inflammatory processes. The oligogenic nature of POI, where 44.44% of patients with multigenic variants present with primary amenorrhea compared to 19.05% with monogenic variants [37], underscores the importance of comprehensive genetic assessment.
When implemented with appropriate quality controls and analytical frameworks, targeted NGS panels can achieve diagnostic yields exceeding 50% when combined with array-CGH [4], significantly reducing the idiopathic fraction of POI. This enhanced genetic understanding directly informs clinical management, enables personalized risk assessment, and identifies potential therapeutic targets such as CCL2 and TGFB1 identified through gene-drug analysis [38], ultimately improving care for women with this complex condition.
Sequencing and Bioinformatics Pipelines for NGS Data Analysis in POI
Premature ovarian insufficiency (POI) is a clinically heterogeneous disorder characterized by the loss of ovarian function before age 40, affecting approximately 1-3.7% of women worldwide [4] [40] [9]. The condition presents with amenorrhea or oligomenorrhea, elevated gonadotropins, and hypoestrogenism, leading to infertility and increased long-term health risks. While POI can result from chromosomal abnormalities, autoimmune disorders, or iatrogenic causes, genetic factors account for 20-25% of cases, with nearly 70% of cases remaining idiopathic [4] [41]. The emergence of next-generation sequencing (NGS) technologies has revolutionized our understanding of POI genetics, revealing an complex architecture that often involves oligogenic inheritance patterns where multiple genetic variants contribute to the phenotype [40] [9].
The integration of array comparative genomic hybridization (array-CGH) with NGS has significantly improved the diagnostic yield for POI, identifying pathogenic variations in 57.1% of idiopathic cases in recent studies [4]. This application note provides a comprehensive framework for implementing sequencing and bioinformatics pipelines specifically tailored for POI genetic research, with emphasis on practical protocols and analytical strategies within the broader context of comparing genomic approaches for POI diagnosis.
Technology Comparison: Array-CGH versus NGS in POI Diagnosis
Complementary Diagnostic Approaches
Array-CGH and NGS represent complementary technologies in POI genetic diagnosis, each with distinct strengths and limitations. Array-CGH primarily detects copy number variations (CNVs) and chromosomal rearrangements, while NGS identifies single nucleotide variations (SNVs), small insertions/deletions (indels), and through specific approaches, can also detect CNVs.
Table 1: Comparison of Genomic Technologies for POI Genetic Diagnosis
| Parameter | Array-CGH | Targeted NGS Panels | Whole Exome Sequencing |
|---|---|---|---|
| Primary Detectable Variants | CNVs (>50-100 kb), chromosomal imbalances | SNVs, indels, small CNVs in targeted genes | SNVs, indels in coding regions |
| Resolution | 5-10 Mb for ROH detection [42] | Single-base resolution for targeted regions | Single-base resolution for exonic regions |
| POI Diagnostic Yield | 3.6% (1/28 patients with causal CNV) [4] | 14.4-75% [41] [40] | Varies; often used for familial cases |
| Key Strengths | Genome-wide CNV detection, identification of ROH regions | High coverage of known POI genes, cost-effective for targeted analysis | Hypothesis-free approach, novel gene discovery |
| Limitations | Cannot detect balanced rearrangements or SNVs | Limited to pre-defined gene panels | Higher cost, complex data interpretation |
| Typical POI Applications | Detection of X-chromosome abnormalities, larger deletions/duplications | Screening of known POI genes (e.g., FOXL2, NOBOX, FIGLA) | Identification of novel candidate genes in familial cases |
Integrated Diagnostic Workflow
Recent evidence supports a combined approach using both array-CGH and NGS for optimal molecular diagnosis of POI. A 2025 study implementing both techniques in the same patient cohort demonstrated that array-CGH identified clinically relevant CNVs in 15q25.2 and 15q26.1, while NGS revealed pathogenic SNVs in genes such as FIGLA, TWNK, and PMM2 [4]. This integrated approach achieved an overall genetic anomaly detection rate of 57.1% (16/28 patients), significantly higher than either method alone.
The oligogenic nature of POI further supports comprehensive genetic screening. A study of 64 early-onset POI patients found that 75% carried at least one genetic variant, with many patients harboring multiple variants across different genes and pathways [40] [9]. The number of variants correlated with phenotypic severity, with the most severe presentations associated with either a higher number of variations or variants with greater predicted pathogenicity.
NGS Experimental Workflow for POI Research
Sample Preparation and Library Construction
The initial phase of POI genetic research requires careful sample selection and preparation. The following protocol outlines the key steps for DNA-based NGS analysis:
Patient Selection Criteria:
- Diagnosis based on ESHRE guidelines: amenorrhea for >4 months before age 40 + FSH >25 IU/L on two occasions [43]
- Exclusion of karyotype abnormalities, FMR1 premutations, and autoimmune causes [4] [40]
- Collection of clinical data: type of amenorrhea (primary/secondary), age at diagnosis, family history, hormonal profiles (FSH, LH, E2, AMH), and ultrasound findings [4]
DNA Extraction and Quality Control:
- Extract genomic DNA from peripheral blood using commercial kits (e.g., QIAsymphony DNA Mid Kits) [4]
- Quantify DNA using fluorometric methods (e.g., Quant-iT PicoGreen) [40]
- Ensure DNA integrity (A260/A280 ratio ~1.8-2.0) and sufficient quantity (≥50 ng for library preparation)
Library Preparation for Targeted Sequencing:
- Utilize custom capture designs targeting known POI-associated genes (e.g., 163-295 gene panels) [4] [40]
- Employ multiplex PCR amplification or hybrid capture-based enrichment
- For hybrid capture: Fragment DNA, ligate adapters, perform hybridization with biotinylated probes, and capture with streptavidin-coated magnetic beads
- Amplify captured libraries with index sequences for sample multiplexing
Sequencing Platforms and Parameters
Multiple sequencing platforms can be employed for POI genetic studies:
Illumina Platform:
- System: NextSeq 500/550, NextSeq 550 [4] [40]
- Chemistry: 150 bp paired-end reads
- Target coverage: ≥90% of targets at 50× minimum [40]
- Recommended samples per run: 12-24 samples (depending on panel size)
Ion Torrent Platform:
- System: Ion S5 series [5]
- Chemistry: 200 bp reads
- Template preparation: emulsion PCR on Ion OneTouch 2
- Chip: Ion 520 chip
Quality Control Metrics:
- QScore ≥30 for base calling
- Minimum read depth: 50× for targeted regions
- ≥80% of targets with 100× coverage
- Uniformity of coverage: >90%
Bioinformatics Pipelines for POI Data Analysis
Primary Data Analysis and Variant Calling
The bioinformatics workflow for POI genetic analysis involves multiple steps to transform raw sequencing data into clinically interpretable variants:
Table 2: Bioinformatics Tools for NGS Data Analysis in POI Research
| Analysis Step | Tools and Software | Key Parameters | Output Files |
|---|---|---|---|
| Base Calling | Real Time Analysis (RTA), Casava [40] | QScore ≥30, chastity filter | FASTQ files |
| Sequence Alignment | BWA-MEM, TMAP [40] [5] | hg19/GRCh37 reference genome | BAM/SAM files |
| Variant Calling | GATK Unified Genotyper, Torrent Variant Caller [40] [5] | Min read depth 20×, Min variant qual 100 | VCF files |
| Variant Annotation | ANNOVAR, Ion Reporter, Varsome [40] [5] | dbSNP, gnomAD, ExAC, ClinVar | Annotated VCF |
| Variant Filtering | Custom scripts, Alissa Interpret [4] | MAF <0.01, quality metrics | Filtered VCF |
| Pathogenicity Prediction | CADD, DANN, MetaSVM [41] | CADD >20, specific thresholds per tool | Pathogenicity scores |
Data Processing Workflow:
- Demultiplexing: Assign reads to specific samples based on index sequences
- Quality Control: Assess read quality using FastQC, MultiQC
- Alignment: Map reads to reference genome (GRCh37/hg19 or GRCh38)
- Post-Alignment Processing:
- Local realignment around indels (GATK)
- Base quality score recalibration
- Remove PCR duplicates
- Variant Calling:
- Simultaneous calling of SNVs and small indels
- Joint calling across samples for cohort studies
- Variant Filtering:
- Remove variants with call quality
- Exclude variants with low read depth (<10×)
- Filter based on strand bias and mapping quality
- Remove variants with call quality
Variant Interpretation and Prioritization Strategies
Variant interpretation represents the most critical phase in POI genetic analysis. The American College of Medical Genetics (ACMG) guidelines provide a standardized framework for variant classification:
Variant Classification Categories:
- Pathogenic (Class 5): Strong evidence for disease causation
- Likely Pathogenic (Class 4): Moderate evidence for disease causation
- Variant of Uncertain Significance (VUS, Class 3): Insufficient evidence for classification
- Likely Benign (Class 2): Not expected to have major disease association
- Benign (Class 1): No known disease association
POI-Specific Filtering and Prioritization:
- Inheritance Pattern Filtering:
- Autosomal dominant: Heterozygous variants in known POI genes
- Autosomal recessive: Homozygous or compound heterozygous variants
- X-linked: Heterozygous variants in X-chromosome genes
Variant Type Prioritization:
- Protein-truncating variants (nonsense, frameshift, splice-site)
- Missense variants in functional domains with high conservation
- Previously reported pathogenic variants in POI databases
Population Frequency Filtering:
- Exclude variants with allele frequency >0.1% in population databases (gnomAD, 1000 Genomes)
- Consider higher frequency thresholds for founder populations
Functional Prediction:
- Use multiple in silico prediction tools (SIFT, PolyPhen-2, CADD)
- Concordance across multiple tools increases confidence
Oligogenic Variant Analysis: Given the emerging evidence for oligogenic inheritance in POI [40] [9], bioinformatics pipelines should incorporate methods to detect multiple variants in:
- Genes within the same biological pathway (e.g., meiosis, folliculogenesis)
- Interacting proteins (e.g., MSH4-MSH5 heterodimer [41])
- Cumulative variant burden assessment across relevant pathways
Key Signaling Pathways and Biological Processes in POI
Genetic studies have identified several key biological pathways frequently disrupted in POI, informing both gene panel design and variant interpretation:
Table 3: Major Biological Pathways and Associated Genes in POI Pathogenesis
| Biological Pathway | Key POI-Associated Genes | Variant Frequency in POI | Primary Ovarian Function |
|---|---|---|---|
| Meiosis & DNA Repair | STAG3, MSH4, MSH5, HFM1, SPIDR, SMC1B | 6/19 genes in targeted panels [41] | Chromosome pairing, recombination, DNA damage repair |
| Transcription Regulation | NOBOX, FIGLA, FOXL2, SOHLH1, NR5A1 | FOXL2: 3.2% of cases [41] | Regulation of oocyte-specific gene expression |
| Ligands & Receptors | BMP15, GDF9, FSHR, AMH, AMHR2 | Common in isolated POI cases [41] | Follicle development, recruitment, maturation |
| Extracellular Matrix Organization | Multiple novel candidates [40] | Identified in pathway analysis [40] | Follicular structure, cell signaling microenvironment |
| Cell Metabolism | EIF2B2, EIF2B4, GALT [5] | 29.2% as potential risk factors [5] | Metabolic support for follicular development |
| NOTCH & WNT Signaling | Novel candidate genes [40] [9] | Identified in ontology analysis [40] | Regulation of follicle recruitment and activation |
Research Reagent Solutions for POI Genetic Studies
Table 4: Essential Research Reagents and Platforms for POI Genetic Studies
| Reagent/Platform | Specific Product Examples | Application in POI Research | Performance Specifications |
|---|---|---|---|
| DNA Extraction Kits | QIAsymphony DNA Mid Kits [4], ReliaPrep Blood gDNA Miniprep System [42] | High-quality genomic DNA from blood samples | Minimum yield: 50 ng/μL, A260/280: 1.8-2.0 |
| Target Enrichment Systems | SureSelect XT-HS (Agilent) [4], Ion AmpliSeq Library Kit Plus [5] | Selective capture of POI-associated genes | >90% target coverage at 50× [40] |
| Sequencing Platforms | Illumina NextSeq 500/550 [4] [40], Ion S5 System [5] | High-throughput sequencing of targeted panels | 150-200 bp read length, 50× coverage |
| Array-CGH Platforms | SurePrint G3 Human CGH Microarray 4×180K [4], GenetiSure Dx Postnatal Array [42] | CNV detection, LCSH identification | 5-10 Mb resolution for ROH detection [42] |
| Variant Annotation Tools | ANNOVAR [40], Ion Reporter [5], Varsome [5] | Functional annotation of sequence variants | Integration of multiple population and disease databases |
| Variant Interpretation Software | Alissa Interpret [4], Cartagenia Bench Lab CNV [4] | ACMG-based variant classification, CNV analysis | Integration with clinical databases, custom classification rules |
Validation and Quality Control Framework
Implementing robust validation protocols is essential for clinical-grade POI genetic testing:
Analytical Validation:
- Precision: ≥95% concordance for variant calls across replicates
- Sensitivity: ≥99% for SNVs, ≥95% for indels in targeted regions
- Specificity: ≥99% for all variant types
- Reportable range: All coding exons ±20 bp flanking intronic regions of targeted genes
Quality Control Metrics:
- Sample-level: Contamination checks, sex concordance, kinship verification
- Sequencing: ≥80% bases ≥Q30, ≥90% on-target reads, mean coverage ≥100×
- Variant calling: Transition/transversion ratio 2.0-3.1, heterozygous/homozygous ratio ~2:1
Reference Materials and Controls:
- Positive controls with known pathogenic variants in POI genes
- Negative controls from healthy individuals
- Coriell samples with characterized variants when available
The integration of NGS technologies with sophisticated bioinformatics pipelines has dramatically advanced our understanding of the genetic architecture of POI. The oligogenic model emerging from recent studies suggests that comprehensive genetic screening covering multiple biological pathways provides the highest diagnostic yield. The combination of array-CGH and NGS offers complementary advantages, with array-CGH detecting larger chromosomal rearrangements and NGS identifying sequence-level variations.
Future developments in POI genetic research will likely include:
- Expansion of gene panels to include newly discovered candidates
- Implementation of long-read sequencing technologies for improved structural variant detection
- Integration of functional genomics data to interpret non-coding variants
- Development of polygenic risk scores incorporating multiple moderate-effect variants
- Multi-omics approaches combining genomic, transcriptomic, and epigenomic data
The protocols and applications detailed in this document provide a foundation for implementing robust genetic analysis pipelines for POI research, enabling both clinical diagnostics and discovery of novel molecular mechanisms underlying ovarian insufficiency.
Premature ovarian insufficiency (POI) is a clinically heterogeneous disorder characterized by the loss of ovarian function before the age of 40 years, affecting approximately 1-3.7% of women [3]. The condition is defined by primary or secondary amenorrhea for at least 4 months, accompanied by elevated follicle-stimulating hormone (FSH) levels (>25 IU/L) [6] [4]. POI presents significant implications for women's fertility, cardiovascular health, bone density, and overall quality of life. The etiology of POI encompasses chromosomal abnormalities, autoimmune disorders, iatrogenic causes, and genetic defects, yet a substantial proportion (up to 70%) remains idiopathic without comprehensive genetic investigation [6] [3]. Advances in genetic technologies, particularly array comparative genomic hybridization (array-CGH) and next-generation sequencing (NGS), have revolutionized the diagnostic approach to POI by enabling the identification of pathogenic copy number variations (CNVs) and single nucleotide variants (SNVs) in a growing number of POI-associated genes.
The integration of these genetic analyses into clinical practice provides crucial information for patient management, familial counseling, and reproductive decision-making. This protocol outlines a standardized approach for implementing array-CGH and NGS in the diagnostic workflow for POI, interpreting results within a clinical context, and effectively communicating findings to patients.
Technology Comparison: Array-CGH versus NGS for POI
Technical Principles and Diagnostic Capabilities
Array-CGH is a molecular cytogenetic technique designed to detect copy number variations (CNVs) across the entire genome. The methodology involves competitive hybridization of fluorescently labeled test and reference DNA to microarray probes, allowing for the identification of chromosomal deletions and duplications at a significantly higher resolution (down to 50-100 kb with modern platforms) than conventional karyotyping [44] [45]. This technology is particularly valuable for detecting submicroscopic imbalances that may disrupt genes critical for ovarian development and function.
In contrast, NGS technologies enable comprehensive sequencing of multiple genes simultaneously through targeted gene panels. These panels typically include known and candidate genes involved in various aspects of ovarian function, including folliculogenesis, meiosis, DNA repair, and hormonal signaling [4] [5]. NGS primarily identifies single nucleotide variants (SNVs) and small insertions/deletions (indels) that would be undetectable by array-CGH.
Comparative Performance in POI Diagnosis
Recent studies directly comparing these technologies in the same patient cohorts demonstrate their complementary diagnostic value:
Table 1: Diagnostic Yield of Array-CGH and NGS in Idiopathic POI
| Technology | Variant Type Detected | Detection Rate in POI | Key Limitations |
|---|---|---|---|
| Array-CGH | Copy Number Variations (CNVs) | ~1.7% causal CNVs [6] | Cannot detect balanced rearrangements or SNVs |
| NGS | Single Nucleotide Variations (SNVs/Indels) | ~28.6% causal variants [6] | Limited to sequenced regions; may miss large CNVs |
| Combined Approach | Both CNVs and SNVs | 57.1% total anomaly detection (causal + VUS) [6] | Increased cost and complexity |
A 2025 study combining both techniques in 28 idiopathic POI patients revealed a remarkable 57.1% overall detection rate of genetic anomalies, with array-CGH identifying causal CNVs in 3.6% of patients and NGS detecting causal SNVs/indels in 28.6% of patients, with an additional 25% possessing variants of uncertain significance (VUS) [6]. This demonstrates the superior diagnostic yield achieved through an integrated approach.
Experimental Protocols for Genetic Analysis in POI
Patient Selection and Pre-Test Evaluation
Before genetic testing, comprehensive clinical assessment is essential:
- Diagnostic Confirmation: Verify POI diagnosis based on ESHRE criteria: amenorrhea for ≥4 months before age 40 + elevated FSH >25 IU/L on two occasions [4]
- Exclusion of Non-Genital Etiologies: Rule out iatrogenic, autoimmune, and metabolic causes through clinical history and appropriate serological testing
- Karyotype and FMR1 Testing: Perform conventional karyotyping and FMR1 premutation analysis as first-line investigations [5] [3]
- Family History Documentation: Document any familial patterns of POI, infertility, or associated medical conditions
- Informed Consent: Obtain detailed consent discussing potential outcomes, including incidental findings and variants of uncertain significance
Array-CGH Protocol
Table 2: Key Research Reagent Solutions for Array-CGH
| Reagent/Equipment | Function | Example Specification |
|---|---|---|
| Agilent SurePrint G3 CGH Microarray | Genome-wide CNV detection | 4x180K format (180,000 oligonucleotide probes) |
| QIAsymphony DNA Mid Kit | Genomic DNA extraction from blood | Automated nucleic acid purification |
| Cy3-dUTP and Cy5-dUTP | Fluorescent labeling of test/reference DNA | Differential labeling for competitive hybridization |
| Human Cot-1 DNA | Blocking repetitive sequences | Reduces non-specific hybridization background |
| Agilent CytoGenomics Software | CNV calling and analysis | Algorithmic identification of significant deviations |
The array-CGH procedure follows these critical steps [4] [10]:
- DNA Extraction and Quality Control: Isolate high-molecular-weight DNA from peripheral blood using standardized kits (e.g., QIAsymphony). Verify DNA purity (A260/280 ratio 1.8-2.0) and concentration (>50 ng/μL).
- DNA Labeling and Purification: Enzymatically label patient DNA with Cy5-dUTP and reference DNA with Cy3-dUTP using random priming. Remove unincorporated nucleotides through purification columns.
- Hybridization: Combine labeled test and reference DNA with Cot-1 DNA (to block repetitive sequences) in hybridization buffer. Denature at 95°C for 3 minutes, then hybridize to microarray for 24-40 hours at 65°C with rotation.
- Washing and Scanning: Perform stringent washes to remove non-specifically bound DNA. Scan arrays using a high-resolution microarray scanner (e.g., Agilent G2565BA).
- Data Analysis: Process images with feature extraction software (e.g., Agilent Feature Extraction). Identify CNVs using analytical software (e.g., Agilent CytoGenomics) with a minimum of 5 consecutive probes showing log2 ratio deviation >|0.3|.
- CNV Interpretation: Compare identified CNVs against databases of genomic variants (DGV, DECIPHER) to determine clinical significance using ACMG classification guidelines.
Figure 1: Array-CGH Experimental Workflow. The diagram outlines the key procedural steps from sample preparation through final clinical interpretation.
Next-Generation Sequencing Protocol
For NGS analysis of POI, the following protocol is recommended [4] [5]:
- Gene Panel Design: Curate a comprehensive panel encompassing established POI-associated genes (e.g., NOBOX, FIGLA, BMP15, GDF9, FOXL2) and emerging candidates. The 2025 study utilized a custom capture design of 163 genes involved in ovarian function [4].
- Library Preparation: Use hybrid capture-based target enrichment (e.g., Agilent SureSelect XT-HS) with 10-50 ng input DNA. Fragment DNA, add adapters, and amplify with index sequences for sample multiplexing.
- Sequencing: Perform massively parallel sequencing on platforms such as Illumina NextSeq 550 with minimum 100x coverage depth and >95% of target bases covered at 20x.
- Bioinformatic Analysis:
- Alignment to reference genome (GRCh37/38) using tools like BWA-MEM
- Variant calling with GATK or similar pipelines
- Annotation of variant functional impact using ANNOVAR, VEP
- Variant Filtering and Prioritization:
- Remove common polymorphisms (frequency >0.01 in gnomAD)
- Prioritize protein-truncating and predicted deleterious missense variants
- Assess variants in known POI-associated genes first
- Validation: Confirm pathogenic and likely pathogenic variants by Sanger sequencing.
Integration of Genetic Findings into Clinical Management
Interpretation of Genetic Results
The clinical interpretation of identified variants should follow ACMG/AMP guidelines, classifying variants as pathogenic, likely pathogenic, variants of uncertain significance (VUS), likely benign, or benign [4]. For POI, particular attention should be paid to:
- Gene-Disease Validity: Strongest evidence exists for genes with multiple independent reports and functional validation (e.g., NOBOX, FIGLA, BMP15)
- Inheritance Pattern: Most POI genes show autosomal dominant inheritance with incomplete penetrance, though autosomal recessive and X-linked forms exist
- Phenotypic Spectrum: Some genes associate with syndromic features beyond ovarian dysfunction
Table 3: Key POI-Associated Genes and Their Clinical Correlations
| Gene | Primary Function in Ovarian Biology | Inheritance Pattern | Additional Clinical Features |
|---|---|---|---|
| FIGLA | Folliculogenesis, primordial follicle formation | Autosomal dominant | Isolated POI |
| NOBOX | Oocyte differentiation and folliculogenesis | Autosomal dominant | Isolated POI |
| BMP15 | Oocyte maturation and follicular development | X-linked dominant | Isolated POI |
| EIF2B2 | RNA metabolism, protein synthesis | Autosomal recessive | Vanishing White Matter disease |
| FMR1 | RNA processing, premutation effect | X-linked | Fragile X-associated disorders |
Patient Counseling and Management Implications
Genetic findings in POI have significant implications for clinical management and counseling:
Reproductive Counseling:
- Discuss implications for natural conception prospects and possible intermittent ovarian function
- Review options for fertility preservation where applicable
- Consider preimplantation genetic testing where inherited pathogenic variants are identified
Medical Management:
- Implement early hormone replacement therapy (HRT) to mitigate long-term cardiovascular and skeletal complications
- Schedule regular bone density monitoring and cardiovascular risk assessment
- Coordinate multidisciplinary care for syndromic forms (e.g., neurological follow-up for EIF2B-related disorders)
Familial Implications:
- Offer predictive testing for at-risk female relatives with appropriate genetic counseling
- Discuss reproductive options for carriers of pathogenic variants
- Provide information about autosomal recessive inheritance and reproductive partner testing when relevant
Psychological Support:
- Address potential feelings of guilt (particularly in inherited cases) and grief related to fertility challenges
- Connect patients with support groups and mental health resources specializing in genetic conditions and infertility
Figure 2: Integration of Genetic Findings into Clinical Management Pathway. The diagram illustrates how genetic results inform various aspects of patient care.
The integration of array-CGH and NGS technologies into the diagnostic algorithm for POI represents a significant advancement in reproductive medicine. The combined approach provides the highest diagnostic yield, identifying genetic anomalies in over 57% of idiopathic POI cases [6]. This comprehensive genetic assessment enables precise diagnosis, informs personalized management strategies, and facilitates targeted familial counseling. As our understanding of the genetic architecture of POI continues to expand, regular reanalysis of NGS data may yield additional diagnostic information. The implementation of these protocols requires close collaboration between clinical geneticists, reproductive endocrinologists, and genetic counselors to ensure optimal patient care and appropriate interpretation of complex genetic results in the context of individual patient phenotypes.
Premature Ovarian Insufficiency (POI) is a clinical syndrome defined by the loss of ovarian function before the age of 40, characterized by menstrual disturbances (amenorrhea or oligomenorrhea) and elevated gonadotropin levels [4] [1]. This condition affects approximately 1-3.7% of women, leading to significant long-term health consequences including infertility, osteoporosis, and increased cardiovascular risk [4] [26] [2]. Despite established etiologies such as genetic, autoimmune, and iatrogenic causes, the underlying reason remains unidentified in a substantial proportion of cases, often classified as idiopathic POI [2].
Advances in genetic technologies have progressively shifted this diagnostic paradigm. While chromosomal abnormalities and FMR1 premutations represent well-characterized genetic causes, recent next-generation sequencing (NGS) studies indicate that single-gene and oligogenic defects contribute significantly to POI pathogenesis [9] [26]. This application note details a targeted case study that implemented a combined genetic diagnostic approach, utilizing both array Comparative Genomic Hybridization (array-CGH) and NGS, to elucidate the genetic architecture of idiopathic POI.
Background: The Diagnostic Challenge in POI
The etiological landscape of POI is highly heterogeneous. A recent study comparing historical and contemporary cohorts revealed a significant shift, with the proportion of idiopathic cases decreasing from 72.1% to 36.9%, largely due to improved identification of iatrogenic and autoimmune causes [2]. Nonetheless, genetic causes remain a crucial diagnostic target, especially in idiopathic presentations.
POI exhibits a complex genetic architecture involving numerous biological pathways:
- Meiosis and DNA Repair: Genes like HFM1, MSH4, and SPIDR are crucial for meiotic recombination and DNA repair; their dysfunction can trigger accelerated follicle depletion [26].
- Folliculogenesis: Genes such as NOBOX, BMP15, and GDF9 regulate follicular development and activation [9] [5].
- Metabolism and Immune Regulation: Variants in genes like EIF2B2 and GALT disrupt cellular metabolism, while AIRE mutations link to autoimmune POI [26] [5].
- Ovarian Development: Transcription factors including FIGLA govern early ovarian development and primordial follicle formation [4].
Emerging evidence suggests an oligogenic inheritance model where the cumulative effect of variants in multiple genes contributes to disease expression. One study reported that 75% of analyzed patients carried at least one genetic variant, with many harboring multiple variants across different pathways [9].
Case Study: Combined Array-CGH and NGS in Idiopathic POI
Study Design and Patient Cohort
This observational, retrospective single-center study was conducted in a Reproductive Medicine Department [4]. The research enrolled 28 women with idiopathic POI who met the following inclusion criteria:
- Primary or secondary amenorrhea for >4 months before age 40
- Elevated follicle-stimulating hormone (FSH) levels >25 IU/L
- Exclusion of karyotype abnormalities, FMR1 premutations, and autoimmune/iatrogenic causes
The cohort comprised two distinct phenotypic presentations:
- Primary Amenorrhea (PA): 4 patients (14.3%)
- Secondary Amenorrhea (SA): 24 patients (85.7%)
The average age at diagnosis was 27.7 years, and 11 patients (39.3%) reported a family history of POI, suggesting a strong heritable component in this subset [4].
Experimental Workflow and Methodologies
The diagnostic pipeline incorporated sequential genetic analyses with two complementary technologies.
Array-CGH Protocol for CNV Detection
Principle: Array-CGH identifies copy number variations (CNVs) by competitively hybridizing patient and reference DNA to genomic probes [11].
Step-by-Step Protocol:
- DNA Extraction: Genomic DNA was isolated from peripheral blood samples using QIAsymphony DNA midi kits on a QIAsymphony system (Qiagen).
- Sample Labeling: Patient and reference DNA were fluorescently labeled with Cy5 and Cy3 dyes, respectively.
- Hybridization: Labeled DNA samples were co-hybridized to SurePrint G3 Human CGH Microarray 4×180K (Agilent Technologies) for 24-40 hours.
- Washing and Scanning: Arrays were washed to remove non-specific binding and scanned using an Agilent microarray scanner.
- Image Analysis: Feature Extraction software (Agilent) converted fluorescence intensities into numerical data.
- CNV Calling: CytoGenomics software v5.0 identified CNVs with a minimum size of 60 kb. Detected CNVs were annotated using Cartagenia Bench Lab CNV software v5.1.
Next-Generation Sequencing Protocol
Principle: NGS detects single nucleotide variants (SNVs) and small insertions/deletions (indels) across a targeted gene panel [4] [9].
Step-by-Step Protocol:
- Panel Design: A custom capture design targeting 163 genes associated with ovarian function was utilized.
- Library Preparation: Libraries were prepared using SureSelect XT-HS reagents (Agilent Technologies) with the following steps:
- DNA Fragmentation: Enzymatic fragmentation of 50-100 ng genomic DNA
- Adapter Ligation: Addition of Illumina-compatible adapters with unique dual indices
- Target Capture: Hybridization-based enrichment using biotinylated probes
- Sequencing: Enriched libraries were sequenced on a NextSeq 550 system (Illumina) with 2×150 bp paired-end reads.
- Bioinformatic Analysis:
- Base Calling: Illumina Real Time Analysis (RTA) software
- Alignment: BWA-MEM algorithm against GRCh37/hg19 reference genome
- Variant Calling: GATK Unified Genotyper for SNVs and indels
- Annotation: Integration of population frequency (gnomAD), in silico prediction tools, and clinical databases (ClinVar, HGMD)
Variant Interpretation and Classification
All identified variants were classified according to the American College of Medical Genetics and Genomics (ACMG) guidelines into five categories:
- Class 1: Benign
- Class 2: Likely Benign
- Class 3: Variant of Uncertain Significance (VUS)
- Class 4: Likely Pathogenic
- Class 5: Pathogenic
Variants were interpreted using population databases (gnomAD, DGV), variant databases (ClinVar, HGMD), and literature evidence [4].
Key Findings and Genetic Landscape
The combined genetic approach yielded a remarkable 57.1% detection rate (16/28 patients) of potentially causative genetic variants in this idiopathic POI cohort [4].
Table 1: Genetic Findings in 28 Idiopathic POI Patients
| Finding Category | Number of Patients | Percentage | Variant Types Identified |
|---|---|---|---|
| Overall Genetic Anomalies | 16/28 | 57.1% | Mixed CNVs and SNVs/Indels |
| Causal CNVs (Array-CGH) | 1/28 | 3.6% | 15q25.2 deletion |
| Causal SNVs/Indels (NGS) | 8/28 | 28.6% | FIGLA, TWNK, etc. |
| Variants of Uncertain Significance | 7/28 | 25.0% | Multiple genes |
Table 2: Detailed Pathogenic Variants and Patient Characteristics
| Patient | Amenorrhea Type | Age at Diagnosis | Gene/Region | Variant | Classification | Inheritance |
|---|---|---|---|---|---|---|
| 2 | Primary | NA | FIGLA | Chr2:g.71014926dup; c.239dup, p.(Asn80Lysfs*26) | Pathogenic (Class 5) | Homozygous |
| 3 | Primary | NA | 15q25.2 | arr[GRCh37] 15q25.2(83240239_85090038)x1 | Pathogenic (Class 5) | Heterozygous CNV |
| 5 | Secondary | 25 | PMM2 | Chr16:g.8895680T>C; c.91T>C, p.(Phe31Leu) | VUS (Class 3) | Heterozygous |
| 7 | Secondary | 30 | TWNK | Chr10:g.102749177G>C; c.1210G>C, p.(Gly404Arg) | Likely Pathogenic (Class 4) | Heterozygous |
Notably, the study identified a homozygous pathogenic frameshift variant in FIGLA, a key transcription factor in primordial follicle development [4]. Additionally, a likely pathogenic variant in TWNK, which encodes a mitochondrial helicase, underscores the role of mitochondrial function in ovarian maintenance [4]. The detection of both CNVs and single-gene variants highlights the complementary value of both technologies in POI diagnostics.
The Scientist's Toolkit: Essential Research Reagents
Table 3: Key Research Reagents and Platforms for POI Genetic Studies
| Reagent/Platform | Specific Product | Application in POI Research |
|---|---|---|
| DNA Extraction | QIAsymphony DNA Midi Kits (Qiagen) | High-quality genomic DNA isolation from blood |
| Array-CGH Platform | SurePrint G3 Human CGH 4×180K (Agilent) | Genome-wide CNV detection with 60 kb resolution |
| NGS Target Capture | SureSelect XT-HS Custom Design (Agilent) | Focused enrichment of 163 POI-associated genes |
| Sequencing System | Illumina NextSeq 550 | High-throughput sequencing with 2×150 bp reads |
| Variant Annotation | Alissa Align&Call v1.1, Alissa Interpret v5.3 | Clinical-grade variant interpretation and reporting |
| CNV Analysis Software | CytoGenomics v5.0 + Cartagenia Bench Lab CNV | CNV visualization, annotation, and classification |
| Variant Classification | ACMG Guidelines | Standardized pathogenicity assessment |
Discussion and Clinical Implications
The 57.1% diagnostic yield achieved through this combined approach represents a substantial improvement over traditional methods. Earlier studies relying solely on chromosomal analysis and FMR1 testing reported diagnostic yields of approximately 11%, which increased to 41% with the addition of NGS gene panels and extended whole exome sequencing [46]. This dramatic enhancement in detection capability has significant implications for both clinical management and research directions.
Technological Synergy: Array-CGH and NGS
The superior diagnostic performance stems from the complementary strengths of each technology:
- Array-CGH provides comprehensive detection of CNVs >60 kb, including known pathogenic regions like 15q25.2 deletions observed in this study [4].
- NGS enables identification of subtle sequence variants in critical ovarian function genes, such as the FIGLA and TWNK mutations identified here [4].
- Combined approach captures the full spectrum of genetic variation, from chromosomal rearrangements to single nucleotide changes.
Recent evidence suggests that oligogenic involvement is frequent in POI [9]. The ability to detect multiple variant types simultaneously makes this combined approach particularly valuable for unraveling complex genetic architectures.
Clinical Applications and Patient Management
Genetic diagnosis in POI extends beyond etiological clarification to active clinical management:
- Reproductive Counseling: Identification of genetic causes enables accurate recurrence risk assessment and family planning.
- Personalized Medicine: Specific genetic findings may guide therapeutic decisions, such as fertility preservation strategies.
- Comorbidity Screening: Recognition of syndromic forms (e.g., associated with mitochondrial disorders) prompts appropriate surveillance for extra-ovarian manifestations.
- Psychological Benefits: Ending the diagnostic odyssey provides psychological closure for patients and families.
The latest clinical guidelines have begun incorporating these advances, with recent updates recommending genetic testing more prominently in the POI diagnostic workflow [1].
Limitations and Future Directions
Despite the promising results, several challenges remain:
- Variant Interpretation: A significant proportion of findings (25% in this study) were classified as VUS, highlighting the need for functional validation platforms.
- Technical Limitations: Array-CGH may miss balanced chromosomal rearrangements and low-level mosaicism, while NGS panels may lack coverage of non-coding regulatory regions.
- Oligogenic Analysis: Current clinical frameworks are primarily designed for monogenic disorders, necessitating development of new tools for multi-gene variant interpretation.
Future research directions should focus on:
- Multi-omics Integration: Combining genomic data with transcriptomic, epigenomic, and proteomic profiles.
- Functional Studies: Developing high-throughput assays to validate VUS and establish pathogenicity.
- Population Diversity: Expanding studies to include diverse ethnic backgrounds to ensure equitable implementation of genetic diagnostics.
This case study demonstrates that a combined array-CGH and NGS approach significantly enhances the detection of genetic anomalies in idiopathic POI, achieving a 57.1% diagnostic yield in a previously unexplained patient cohort. The complementary nature of these technologies enables comprehensive assessment of both chromosomal and sequence-level variations, reflecting the complex genetic architecture of ovarian insufficiency.
For researchers and clinicians, these findings underscore the importance of:
- Implementing integrated genetic testing protocols in the diagnostic evaluation of idiopathic POI
- Developing specialized bioinformatic pipelines for simultaneous CNV and SNV detection from NGS data
- Establishing multidisciplinary teams to interpret complex genetic findings in the context of clinical presentation
As genetic technologies continue to evolve, with whole genome sequencing emerging as a potential comprehensive solution, the principles of multi-modal assessment established in this study will remain relevant for unraveling the molecular basis of idiopathic POI and improving patient outcomes.
Navigating Analytical Challenges and Optimizing POI Genetic Testing
Variants of Uncertain Significance (VUS) represent a critical challenge in modern genomic medicine, particularly in the diagnosis of genetic disorders such as Premature Ovarian Insufficiency (POI). A VUS is defined as a genetic alteration with unknown consequences for gene function and disease association, creating a "grey zone" in clinical interpretation [47]. In the specific context of POI genetic diagnosis, which affects approximately 1-3.7% of women before age 40, the identification of VUS creates substantial dilemmas for clinical management and genetic counseling [4] [9]. The American College of Medical Genetics and Genomics (ACMG) and the Association for Molecular Pathology (AMP) classify variants into five categories: pathogenic (P), likely pathogenic (LP), variant of unknown significance (VUS), likely benign (LB), and benign (B), with "likely" corresponding to >90% confidence in the assertion [48].
The expanding use of multi-gene next-generation sequencing (NGS) panels and array comparative genomic hybridization (array-CGH) in POI research has significantly increased the detection rate of VUS, with recent studies reporting genetic anomalies in 57.1% of idiopathic POI patients, including numerous VUS findings [4] [6]. This framework addresses the critical need for standardized approaches to VUS interpretation specifically within the context of comparing array-CGH and NGS methodologies for POI genetic diagnosis, providing researchers with practical tools to navigate this complexity.
VUS Classification and Reporting Standards
Current guidelines for variant interpretation emphasize that pathogenicity classification must be curated to reflect relevant findings within the scope of the specific medical context [48]. For POI diagnosis, this means considering the implications for reproductive health, familial risk, and associated health complications. The fundamental principle governing VUS management is that these variants should not directly change medical management, and clinical decisions should instead be based on personal and family history [47].
Several classification systems exist for variant interpretation:
- ACMG/AMP Guidelines (2015): The established five-tier classification system (P, LP, VUS, LB, B) provides the foundation for clinical variant interpretation [48].
- AMP/ASCO/CAP System (2017): This framework proposes a four-tiered system categorizing variants based on clinical significance (Tier I: Strong clinical significance; Tier II: Potential clinical significance; Tier III: Unknown significance; Tier IV: Benign/Likely benign) [48].
- ClinGen/CGC/VICC Guidelines (2022): These more recent guidelines specifically address the classification of somatic variant pathogenicity in cancer, noting that prior guidelines lacked comprehensive standards for somatic alterations [48].
Table 1: VUS Reclassification Statistics from Recent Studies
| Study Context | VUS Reclassification Rate | Upgraded to Pathogenic/Likely Pathogenic | Downgraded to Benign/Likely Benign | Key Methodology |
|---|---|---|---|---|
| Hereditary Cancer (Splicing Variants) [49] | 26.3% (108/411) | 6.8% (28/411) | 19.5% (80/411) | RNA Sequencing |
| Breast Cancer Risk (Multi-gene) [50] | 20% (~206/1032) | ~2% (18/1032) | ~18% (187/1032) | Longitudinal Cohort Study |
| Diverse Populations (Breast Cancer) [50] | 19-27% (by ancestry) | No significant association with REA* | Majority across all REA groups | Multicenter Retrospective Analysis |
*REA: Race, Ethnicity, and Ancestry
Integrated Methodological Framework for VUS Investigation
A multidimensional approach is essential for resolving VUS in POI research, integrating evidence from clinical data, functional studies, and computational predictions. The following protocols outline key experimental workflows for comprehensive VUS assessment.
Protocol 1: Comprehensive Variant Assessment Through Integrated Genomic Analysis
Purpose: To systematically identify and characterize VUS in POI patients by combining array-CGH and NGS methodologies.
Background: Array-CGH effectively detects copy number variations (CNVs), while NGS identifies single nucleotide variations (SNVs) and small insertions/deletions (indels). Their combined application significantly improves the diagnostic yield in idiopathic POI [4] [6].
Materials:
- Biological Sample: Patient peripheral blood samples
- DNA Extraction: QIAsymphony DNA midi kits (Qiagen)
- Array-CGH: SurePrint G3 Human CGH Microarray 4×180K (Agilent Technologies)
- NGS Panel: Custom capture design of POI-related genes (e.g., 163-295 genes)
- NGS Library Prep: SureSelect XT-HS reagents (Agilent Technologies)
- Sequencing Platform: NextSeq 550 system (Illumina)
- Analysis Software: Feature Extraction, CytoGenomics, Alissa Align&Call, Alissa Interpret
Procedure:
- DNA Extraction: Extract genomic DNA from peripheral blood using standardized protocols.
- Array-CGH Analysis:
- Perform oligonucleotide array-CGH following manufacturer's recommendations
- Analyze CNVs using bioinformatics software (e.g., CytoGenomics) with standard settings
- Validate CNVs of minimum 60 kb along the genome
- Interpret identified CNVs using annotation databases (e.g., Cartagenia Bench Lab CNV)
- NGS Analysis:
- Prepare sequencing libraries using custom capture designs targeting POI-associated genes
- Sequence using Illumina platform with minimum 50× coverage and 90% target coverage
- Analyze variants through bioinformatics pipelines for alignment and variant calling
- Variant Annotation and Prioritization:
- Annotate all variants using population databases (gnomAD, 1000 Genomes)
- Cross-reference with disease databases (ClinVar, HGMD, DECIPHER)
- Classify variants according to ACMG guidelines
- Prioritize variants based on predicted functional impact and POI relevance
Protocol 2: RNA Sequencing for Functional Validation of Splicing VUS
Purpose: To experimentally determine the functional impact of VUS predicted to affect splicing.
Background: Approximately 25% of germline variants may affect splicing, but most are classified as VUS due to limited understanding of functional consequences. RNA sequencing provides direct evidence of splicing alterations [49].
Materials:
- RNA Source: Patient blood samples or tissue-specific models
- RNA Extraction Kit: Standard validated methodology
- RNA-Seq Library Prep Kit: TruSeq Stranded mRNA or similar
- Sequencing Platform: Illumina or comparable system
- Analysis Tools: Splicing analysis software (e.g., rMATS, LeafCutter)
Procedure:
- Sample Collection: Obtain appropriate tissue samples (blood, when applicable)
- RNA Extraction: Isolate high-quality RNA using standardized protocols
- Library Preparation and Sequencing:
- Prepare RNA-seq libraries following manufacturer's guidelines
- Sequence to appropriate depth for splicing analysis (typically ≥50 million reads)
- Splicing Analysis:
- Compare splicing patterns between patient samples and normal controls
- Identify aberrant splicing events (exon skipping, intron retention, etc.)
- Quantify the impact on protein-coding potential
- VUS Reclassification:
- Integrate RNA-seq findings with existing evidence
- Reclassify variants according to ACMG guidelines
- Report functionally validated findings
Table 2: RNA-Seq Splicing VUS Reclassification Outcomes [49]
| VUS Category | Total Variants | Reclassified | Upgraded to P/LP | Downgraded to Benign |
|---|---|---|---|---|
| Intronic Variants | 284 | 28.2% (80/284) | 6.0% (17/284) | 22.5% (64/284) |
| Exonic Missense | 95 | 9.5% (9/95) | 9.5% (9/95) | 0% (0/95) |
| Exonic Synonymous | 32 | 6.3% (2/32) | 6.3% (2/32) | 0% (0/32) |
| Total | 411 | 26.3% (108/411) | 6.8% (28/411) | 19.5% (80/411) |
Protocol 3: AI-Driven Variant Annotation Through Multi-Omic Integration
Purpose: To prioritize and functionally annotate VUS using artificial intelligence/machine learning (AI/ML) approaches integrating multi-omic data.
Background: Conventional annotation strategies focus on frequent driver mutations, leaving rare variants unclassified. AI/ML frameworks can systematically identify functionally important mutations by integrating genomic, transcriptomic, and structural data [51].
Materials:
- Genomic Datasets: CCLE/DepMap, TCGA, or comparable resources
- AI/ML Framework: VAMOS (Variant Annotation through Multi-Omic Signatures) or similar
- Structural Data: AlphaFold-predicted 3D protein structures
- Computational Resources: High-performance computing environment
Procedure:
- Data Integration:
- Compile single-nucleotide variant data from relevant sources
- Integrate RNA expression profiles and protein structure information
- Spatial Clustering:
- Map mutations onto 3D protein structures using AlphaFold models
- Apply density-based clustering to group spatially proximal mutations
- Identify functionally relevant variant clusters regardless of population frequency
- Phenotype Association:
- Link variant clusters to transcriptional phenotypes (e.g., pathway activity)
- Calculate association strength with key regulatory activities
- Functional Prediction:
- Train machine learning classifiers using structural and functional features
- Validate predictions using cross-validation approaches
- Prioritize VUS based on predicted functional impact
The Scientist's Toolkit: Research Reagent Solutions
Table 3: Essential Research Reagents for VUS Investigation in POI Diagnostics
| Reagent/Tool Category | Specific Examples | Primary Function | Application Context |
|---|---|---|---|
| Array-CGH Platforms | SurePrint G3 Human CGH Microarray 4×180K (Agilent) | Genome-wide detection of copy number variations | Identification of CNVs ≥60 kb in POI patients [4] |
| NGS Target Enrichment | SureSelect XT-HS Custom Capture (Agilent) | Targeted sequencing of POI-associated gene panels | Focused analysis of 163-295 genes linked to ovarian function [4] [9] |
| Sequencing Platforms | NextSeq 550 System (Illumina) | High-throughput DNA/RNA sequencing | Generation of sequencing data for variant discovery [4] |
| Bioinformatics Software | Alissa Align&Call, Alissa Interpret (Agilent) | Variant calling, annotation, and interpretation | Streamlined analysis pipeline for clinical research [4] |
| AI/ML Frameworks | VAMOS (Variant Annotation through Multi-Omic Signatures) [51] | Integration of genomic, transcriptomic and structural data | Functional prediction for rare variants through spatial clustering |
| Variant Classification | VarClass (VariantClassifier) [52] | Network-based gene association and risk prediction | Polygenic risk assessment using synergistic variant groups |
| Population Databases | gnomAD, 1000 Genomes, dbSNP | Allele frequency reference across populations | Filtering of common polymorphisms [48] [4] |
| Variant Databases | ClinVar, ClinGen, DECIPHER, HGMD | Pathogenicity annotations and clinical interpretations | Evidence-based variant classification [4] [52] |
Data Analysis and Interpretation Framework
Multidimensional Evidence Integration
VUS interpretation requires careful evaluation of all available evidence, including population frequency, computational predictions, functional data, and segregation evidence [48]. Key considerations include:
- Population Genetics: Variants with high allele frequencies in population databases (gnomAD, 1000 Genomes) are less likely to be pathogenic for rare conditions like POI [48] [52].
- Computational Predictions: In silico tools (SIFT, PolyPhen, CADD) provide supporting evidence but should not be over-weighted [52].
- Functional Studies: Experimental data from RNA-seq, functional assays, or model systems provide strong evidence for variant interpretation [49].
- Segregation Evidence: Co-segregation of variants with disease in families provides important supporting evidence for pathogenicity.
Network-Based Gene Association Approaches
Novel computational methodologies like VariantClassifier (VarClass) utilize gene-association networks and polygenic risk prediction models to interpret VUS [52]. This approach:
- Constructs biological evidence-based networks (protein-protein interaction, co-expression, co-localization)
- Places VUS on these networks through gene association
- Selects informative subnetworks by selecting neighboring nodes of variant genes
- Utilizes polygenic risk models to detect groups of synergistically acting variants
This method has demonstrated improved risk prediction accuracy in disease-control cohorts compared to traditional odds ratio analysis [52].
The framework presented here provides a comprehensive approach for managing VUS in the specific context of POI genetic diagnosis research comparing array-CGH and NGS methodologies. Through integrated genomic analysis, functional validation, and computational approaches, researchers can systematically address the challenge of VUS interpretation. The ongoing refinement of these protocols, particularly through AI/ML integration and diverse population data inclusion, will continue to improve the classification and clinical utility of VUS findings. As these methodologies evolve, they promise to transform VUS from diagnostic dilemmas into actionable insights, ultimately advancing personalized approaches to POI diagnosis and management.
Premature Ovarian Insufficiency (POI) represents a significant challenge in reproductive medicine, affecting approximately 1% of women under 40 years and characterized by the loss of ovarian function before the natural age of menopause [4]. The etiological spectrum of POI encompasses iatrogenic, autoimmune, and genetic causes; however, nearly 70% of cases remain idiopathic despite comprehensive clinical investigation [4] [6]. This diagnostic gap has driven the adoption of advanced genomic technologies in research settings, with array-based comparative genomic hybridization (array-CGH) and next-generation sequencing (NGS) emerging as pivotal tools for elucidating the genetic architecture of this heterogeneous condition [31].
The selection between array-CGH and NGS represents a critical methodological decision in POI genetic research, as each platform offers distinct advantages and suffers from unique technical constraints. Array-CGH provides genome-wide detection of copy number variations (CNVs) with robust analytical performance, while NGS enables comprehensive mutation screening across numerous genes simultaneously [31]. Understanding the resolution limits, mosaicism detection capabilities, and ability to identify balanced rearrangements of each technology is essential for optimizing diagnostic yield in POI investigation. This application note examines these technical limitations within the context of POI genetic diagnosis research, providing structured experimental data and methodological protocols to guide researchers and drug development professionals in selecting appropriate genomic approaches for their investigations.
Technical Limitations: Comparative Analysis of Genomic Platforms
Resolution Constraints in Structural Variant Detection
The resolution of genomic platforms determines their ability to detect increasingly smaller chromosomal abnormalities, with significant implications for POI research where pathogenic variants may range from large chromosomal deletions to single-nucleotide changes.
Table 1: Resolution Capabilities of Genomic Analysis Platforms
| Technology | Theoretical Resolution | Practical Resolution | Variant Types Detected |
|---|---|---|---|
| Traditional Karyotyping | 5-10 Mb [53] [45] | 5-10 Mb [54] | Aneuploidies, large structural rearrangements |
| Array-CGH | 50-100 kb [54] | 60 kb - 1 Mb (probe-dependent) [11] | CNVs (deletions/duplications) |
| NGS (Short-Read) | Single nucleotide [55] | 1 bp for SNVs; >100 bp for CNVs [11] | SNVs, indels, CNVs, some SVs |
| Optical Genome Mapping | 500 bp [53] | >150 kb for SVs [56] | Balanced and unbalanced SVs, CNVs |
Array-CGH resolution is fundamentally constrained by probe density and distribution across the genome. Early arrays with 60K probes demonstrated significantly lower resolution than contemporary 180K-1M arrays, directly impacting diagnostic yield in POI studies [11]. The technology detects copy number variations through fluorescence intensity ratios, with precision limited by probe spacing and the inherent signal-to-noise ratio of fluorescent hybridization [45]. While array-CGH excels at identifying submicroscopic deletions and duplications down to approximately 50-100 kb in size, it cannot detect truly balanced chromosomal rearrangements or sequence-level variations [31] [45].
NGS technologies offer nucleotide-level resolution for single nucleotide variants (SNVs) and small insertions/deletions (indels), but their effectiveness in detecting structural variants depends on the specific approach. Whole exome sequencing (WES) primarily identifies coding sequence variations, while CNV detection from NGS data utilizes read depth, paired-end, and split-read methodologies [11]. The read depth approach for CNV detection in NGS has variable resolution depending on coverage uniformity and analytical algorithms, potentially missing smaller CNVs that array-CGH would reliably identify [11].
Mosaicism Detection Limitations
Mosaicism presents particular challenges for genomic platforms, with detection sensitivity varying dramatically between technologies.
Table 2: Mosaicism Detection Capabilities Across Platforms
| Technology | Detection Threshold | Factors Affecting Sensitivity | Applications in POI Research |
|---|---|---|---|
| Karyotyping | 5-10% (metaphase analysis) [56] | Cell culture biases, metaphase quality | Limited utility due to low resolution |
| Array-CGH | 20-30% [54] | DNA quality, probe density, analysis algorithms | Moderate sensitivity for mosaic CNVs |
| NGS | 1-5% (varies with coverage) [55] | Sequencing depth, coverage uniformity, bioinformatic tools | Suitable for low-level mosaic SNVs |
| OGM | 10-15% [56] | DNA quality, labeling efficiency, molecule length | Emerging technology for mosaic SVs |
Array-CGH demonstrates limited sensitivity for mosaicism, typically requiring the abnormal cell population to constitute 20-30% of the sample for reliable detection [54]. This limitation stems from the technology's dependence on population-averaged signal intensity, where low-level mosaicism falls below the threshold of statistical significance in fluorescence ratio calculations. The detection threshold is influenced by multiple factors including DNA quality, the specific genomic region involved, and the size of the mosaic aberration [54].
NGS platforms offer superior sensitivity for low-level mosaicism, potentially detecting variant alleles present at 1-5% frequency depending on sequencing depth and analytical approaches [55]. Deep sequencing (>500x coverage) can enhance mosaicism detection, but this comes with increased costs and computational demands. The single-molecule nature of NGS makes it particularly suitable for identifying mosaic point mutations in POI-associated genes, though mosaic CNVs remain more challenging to detect at low allele fractions [11].
Balanced Rearrangement Detection Gaps
Balanced chromosomal rearrangements, including translocations, inversions, and insertions without copy number change, represent a significant diagnostic blind spot for certain genomic technologies.
Array-CGH cannot detect balanced rearrangements as it relies on measuring DNA copy number variations [45] [31]. This represents a critical limitation in POI research, as balanced translocations involving the X chromosome or autosomes can disrupt ovarian function genes without altering copy number. Similarly, NGS approaches focused on exome sequencing may miss balanced rearrangements, particularly when breakpoints fall in non-coding regions [11].
Advanced technologies like optical genome mapping (OGM) and whole genome sequencing (WGS) offer solutions to this limitation. OGM utilizes ultra-high molecular weight DNA labeled at specific restriction enzyme motifs, enabling direct visualization of structural variations including balanced rearrangements [53] [56]. The technology linearizes DNA through nanochannels and images fluorescent label patterns, identifying rearrangements when label patterns contiguously map to different chromosomal regions [56]. WGS employs paired-end read mapping and split-read analysis to identify breakpoints of balanced rearrangements, though complex regions with repeats remain challenging [53].
Integrated Experimental Protocol for POI Genetic Diagnosis
Sample Preparation and Quality Control
Materials Required:
- QIAsymphony DNA midi kits (Qiagen) or equivalent DNA extraction system [4]
- Agarose gel electrophoresis equipment for DNA quality assessment
- Spectrophotometer (NanoDrop) or fluorometer (Qubit) for DNA quantification
- SurePrint G3 Human CGH Microarray 4 × 180 K (Agilent Technologies) [4]
- SureSelect XT-HS reagents (Agilent Technologies) for NGS library preparation [4]
Procedure:
- DNA Extraction: Isolate high-quality DNA from peripheral blood samples using standardized protocols. For array-CGH, 0.5-1 μg of DNA is typically sufficient, while NGS may require 50-100 ng depending on the approach [4] [45].
- Quality Assessment: Verify DNA integrity through agarose gel electrophoresis or fragment analysis. Optimal samples should show high molecular weight bands without smearing. Assess purity using spectrophotometry (A260/280 ratio ~1.8-2.0) [45].
- Quantity Normalization: Precisely quantify DNA using fluorometric methods and normalize concentrations to working dilutions appropriate for downstream applications.
For OGM studies, special consideration must be given to DNA extraction to preserve ultra-high molecular weight DNA integrity, requiring specialized protocols to minimize mechanical shearing [56].
Array-CGH Experimental Workflow
Protocol:
- DNA Labeling: Label test and reference DNA with different fluorophores (typically Cy3 and Cy5) using nick translation. Verify fragment sizes post-labeling (500-1500 bp optimal) by gel electrophoresis [45].
- Hybridization: Combine labeled test and reference DNA with Cot-1 DNA (40 μg) to block repetitive sequences. Denature at 80°C for 10 minutes and hybridize to microarray slides for 24-48 hours at 40°C [45].
- Washing and Scanning: Perform stringent washes to remove non-specific binding and scan arrays using appropriate laser settings for each fluorophore [4].
- Data Analysis: Process fluorescence intensity data using specialized software (e.g., CytoGenomics, Cartagenia Bench Lab CNV). Call CNVs using statistical algorithms with significance thresholds adjusted for multiple testing [4].
Technical Considerations:
- Maintain consistent hybridization conditions across samples to minimize technical variability
- Include positive control samples with known CNVs to validate assay performance
- Utilize sex-matched reference DNA to avoid X chromosome ratio artifacts
NGS Library Preparation and Sequencing
Protocol:
- Library Preparation: Fragment DNA to appropriate size (150-300 bp) using acoustic shearing or enzymatic fragmentation. Perform end repair, A-tailing, and adapter ligation using commercial library preparation kits [4] [55].
- Target Enrichment: For targeted NGS approaches, hybridize libraries to custom capture panels containing POI-associated genes. Use systems like SureSelect XT-HS for target enrichment [4].
- Sequencing: Dilute libraries to appropriate concentration and sequence on platforms such as Illumina NextSeq 550 with minimum 100x coverage for SNV detection and higher coverage for mosaic variant identification [4].
- Bioinformatic Analysis:
- Align sequences to reference genome (GRCh37/38) using tools like BWA-MEM
- Call variants with GATK or similar pipelines
- Annotate variants using databases including gnomAD, ClinVar, and HGMD
- Classify variants according to ACMG guidelines [4]
Diagram 1: Integrated workflow for comprehensive POI genetic analysis combining multiple genomic technologies to overcome individual platform limitations.
Data Integration and Validation
Protocol:
- Integrate Findings: Correlate array-CGH CNV data with NGS sequencing variants to identify compound heterozygosity or oligogenic influences [4].
- Experimental Validation: Confirm pathogenic CNVs using orthogonal methods such as quantitative PCR or multiplex ligation-dependent probe amplification (MLPA) [11].
- Functional Studies: For novel variants of uncertain significance, implement functional assays including in vitro splicing assays or protein expression studies to determine pathogenicity.
- Family Segregation Analysis: When possible, test first-degree relatives to establish segregation patterns of identified variants with the POI phenotype.
Research Reagent Solutions for POI Genetic Studies
Table 3: Essential Research Reagents for POI Genetic Investigation
| Reagent/Category | Specific Examples | Research Application | Technical Considerations |
|---|---|---|---|
| DNA Extraction Kits | QIAsymphony DNA midi kits (Qiagen) [4] | High-quality DNA isolation | Critical for long-read technologies |
| Array Platforms | SurePrint G3 Human CGH 4×180K [4] | Genome-wide CNV detection | Probe density determines resolution |
| NGS Target Enrichment | SureSelect XT-HS (Agilent) [4] | Gene panel sequencing | Custom designs possible |
| NGS Sequencing | Illumina NextSeq 550 [4] | High-throughput sequencing | Appropriate for mid-size studies |
| Bioinformatic Tools | CytoGenomics, Cartagenia Bench Lab CNV [4] | CNV analysis and interpretation | Requires specialized expertise |
| Variant Databases | gnomAD, ClinVar, DECIPHER [4] | Variant annotation and filtering | Population frequency critical |
| Restriction Enzymes | DLE-1 labels [56] | Optical genome mapping | Specific motif labeling |
Discussion and Future Perspectives
The integration of multiple genomic technologies represents the most promising approach to overcoming the individual limitations of array-CGH and NGS in POI research. Recent studies demonstrate that combining array-CGH with NGS in the same patient cohort yields superior diagnostic rates compared to either technology alone. In one investigation of 28 idiopathic POI patients, this combined approach identified genetic anomalies in 57.1% of cases, with array-CGH detecting causal CNVs in one patient and NGS identifying causal SNV/indel variations in eight patients [4].
Emerging technologies like optical genome mapping offer potential solutions to current limitations in balanced rearrangement detection. OGM utilizes ultra-high molecular weight DNA with fluorescent labeling of specific sequence motifs, enabling genome-wide detection of structural variants with resolution superior to traditional karyotyping [53] [56]. This technology can identify insertions, inversions, and translocations that would escape detection by array-CGH, while also providing copy number information comparable to microarray platforms [56]. For research applications where balanced rearrangements are suspected despite negative array-CGH and NGS results, OGM represents a compelling alternative approach.
Future directions in POI genetic research will likely involve the gradual transition to whole genome sequencing as costs decrease and analytical methods improve. However, currently, the combination of targeted NGS gene panels with array-CGH provides the most cost-effective approach for maximizing diagnostic yield in POI cohorts. As our understanding of the genetic architecture of POI expands, custom target capture designs can be optimized to include both established and novel candidate genes, while array-CGH continues to provide robust detection of CNVs throughout the genome.
The strategic integration of these complementary technologies, while acknowledging their respective limitations in resolution, mosaicism detection, and balanced rearrangement identification, will accelerate gene discovery in POI and ultimately improve diagnostic precision and personalized management for affected women.
Premature Ovarian Insufficiency (POI) is a clinically heterogeneous disorder characterized by the loss of ovarian function before age 40, affecting approximately 1-3.7% of women worldwide [4] [3]. Despite its significant impact on fertility and long-term health, the underlying etiology remains elusive in a substantial proportion of cases, with 70-90% historically classified as idiopathic, though recent genetic advances have reduced this figure to 39-67% [3]. The diagnostic odyssey for POI patients highlights critical limitations of traditional genetic assessment methods and underscores the necessity for more comprehensive genomic approaches.
The strong genetic component of POI is evidenced by its high heritability, with first-degree relatives demonstrating an 18-fold increased risk [3]. While chromosomal abnormalities and FMR1 premutations represent known causes, the vast genetic heterogeneity of POI—involving numerous genes governing ovarian development, folliculogenesis, and meiosis—presents substantial diagnostic challenges [4] [3]. Array comparative genomic hybridization (array-CGH) has served as a cornerstone for detecting copy number variations (CNVs) in POI, but this technology cannot identify single nucleotide variants (SNVs), small indels, or variants in non-coding regions [11].
Next-generation sequencing (NGS) technologies have revolutionized genetic diagnosis by enabling simultaneous assessment of multiple gene classes. However, the interpretation of numerous variants generated by NGS remains a significant hurdle, particularly for distinguishing pathogenic mutations from benign polymorphisms. This application note demonstrates how trio analysis—sequencing both parents alongside the proband—and systematic segregation studies provide a powerful framework for overcoming these interpretive challenges, ultimately enhancing diagnostic yield in POI.
Comparative Performance of Genomic Technologies in POI
Diagnostic Yield of Array-CGH Versus NGS Approaches
Recent studies directly comparing genetic testing modalities in well-characterized POI cohorts provide compelling evidence for the superior performance of integrated genomic approaches. A 2025 study investigating 28 idiopathic POI patients through combined array-CGH and NGS analysis demonstrated the complementary value of both technologies, achieving an overall anomaly detection rate of 57.1% [4] [6].
Table 1: Diagnostic Yield of Genetic Testing Modalities in POI
| Testing Method | Variant Type Detected | Detection Rate in POI | Key Advantages | Key Limitations |
|---|---|---|---|---|
| Array-CGH | Copy Number Variations (CNVs) >50kb | 1/28 patients (3.6%) [4] | Genome-wide CNV detection; established validity | Cannot detect SNVs/indels; resolution limited by probe density |
| NGS (Singleton) | SNVs/Indels in 163-gene panel | 8/28 patients (28.6%) [4] | High-resolution SNV/indel detection; multi-gene analysis | Variant interpretation challenges; false positives/negatives |
| Combined Array-CGH + NGS | CNVs + SNVs/Indels | 16/28 patients (57.1%) [4] | Comprehensive variant detection; synergistic interpretation | Higher cost; complex bioinformatic pipeline |
| Trio Genome Sequencing | SNVs/Indels, CNVs, structural variants | 36.1% prospective yield in rare disease [57] | Enables de novo variant identification; clarifies inheritance | Requires parental samples; higher sequencing costs |
Notably, the combination of both technologies identified causal variants in 28.6% of patients and variants of uncertain significance (VUS) in an additional 25% of cases [4]. This study highlights that nearly 40% of POI patients had a family history of the condition, underscoring the genetic predisposition and value of segregation studies [4].
The Superior Resolution of Trio Sequencing in Rare Disease
Beyond POI-specific research, larger-scale studies on rare diseases demonstrate the consistent advantage of trio-based sequencing approaches. A 2025 prospective, blinded study comparing standard-of-care (SoC) testing with singleton and trio genome sequencing (GS) in 416 rare disease patients found that trio GS achieved the highest prospective diagnostic yield at 36.1%, compared to 28.8% for singleton GS [57].
Table 2: Diagnostic Yield Across Sequencing Strategies in Rare Diseases
| Sequencing Strategy | Prospective Diagnostic Yield | Retrospective Diagnostic Yield | Key Strengths |
|---|---|---|---|
| SoC (Karyotype + array-CGH + ES) | 35.1% [57] | 36.7% [57] | Established methodology; insurance coverage |
| Singleton Genome Sequencing | 28.8% [57] | 39.1% [57] | Unified assay; detects more variant types |
| Trio Genome Sequencing | 36.1% [57] | 40.0% [57] | Identifies de novo variants; clarifies inheritance |
Retrospective analysis revealed that the theoretical maximum detection rates were 40.0% for trio GS compared to 39.1% for singleton GS and 36.7% for SoC, highlighting the inherent technical advantages of comprehensive genomic approaches [57]. The diagnostic superiority was attributed to the ability of GS to detect variants missed by SoC, including deep intronic, non-coding, and small CNVs [57].
Integrated Experimental Protocols for POI Genetic Diagnosis
Sample Collection and DNA Extraction Protocol
Materials:
- EDTA blood collection tubes
- QIAsymphony DNA Midi Kits (Qiagen)
- Qubit dsDNA HS Assay Kit (Invitrogen)
- Standard agarose gel electrophoresis equipment
Procedure:
- Collect peripheral blood samples from proband and both parents in EDTA tubes.
- Extract genomic DNA using QIAsymphony DNA Midi Kits according to manufacturer's protocol.
- Quantify DNA using Qubit dsDNA HS Assay Kit.
- Assess DNA quality via agarose gel electrophoresis.
- Verify DNA purity (OD260/OD280 > 1.8; OD260/OD230 > 1.5).
- Ensure minimum DNA quantity of 500ng for library preparation.
This protocol ensures high-quality DNA suitable for both array-CGH and NGS applications, as implemented in recent POI studies [4] [58].
Array-CGH Protocol for CNV Detection
Materials:
- SurePrint G3 Human CGH Microarray 4 × 180K (Agilent Technologies)
- Cy3-dCTP and Cy5-dCTP fluorescent dyes
- Hybridization chambers and oven
- Scanner (Agilent Technologies)
Procedure:
- Digest 500ng of patient and reference DNA with AluI and RsaI restriction enzymes.
- Label patient DNA with Cy5-dCTP and reference DNA with Cy3-dCTP using random priming.
- Purify labeled products using Microcon YM-30 filters.
- Combine labeled patient and reference DNA with Cot-1 DNA and hybridization buffer.
- Denature at 95°C for 3 minutes and incubate at 37°C for 30 minutes.
- Hybridize to microarray at 65°C for 40 hours with rotation.
- Wash slides according to manufacturer's protocol.
- Scan slides using Agilent scanner and extract data with Feature Extraction software.
- Analyze CNVs using CytoGenomics software with standard settings (minimum 60kb detection threshold).
- Interpret CNVs using Cartagenia Bench Lab CNV software with DECIPHER, ClinGen, and ClinVar databases [4].
Trio-Based Next-Generation Sequencing Protocol
Materials:
- SureSelect XT-HS reagents (Agilent Technologies)
- Custom capture design of 163 POI-associated genes
- Magnis system (Agilent Technologies)
- NextSeq 550 system (Illumina)
Procedure:
- Prepare sequencing libraries using SureSelect XT-HS reagents according to manufacturer's instructions.
- Enrich target regions using custom capture design encompassing 163 genes known or suspected in ovarian function.
- Perform library amplification and barcoding for proband and parental samples.
- Pool libraries in equimolar ratios.
- Sequence on NextSeq 550 system using 2 × 150bp paired-end chemistry.
- Achieve minimum coverage of 50× for >95% of target regions.
- Align sequences to reference genome (GRCh37/hg19) using BWA-MEM.
- Perform variant calling using GATK best practices pipeline.
- Annotate variants using Alissa Align&Call and Alissa Interpret softwares.
- Filter against population databases (gnomAD, DGV) and disease databases (ClinVar, HGMD) [4].
Variant Segregation and Interpretation Protocol
Materials:
- Sanger sequencing reagents for validation
- American College of Medical Genetics (ACMG) classification guidelines
Procedure:
- Identify candidate variants from NGS data based on population frequency (<1% in gnomAD), predicted pathogenicity, and gene relevance to POI.
- Prioritize variants in known POI genes (e.g., NOBOX, BMP15, FIGLA) and novel candidates.
- Design PCR primers for candidate variants using Primer3 software.
- Perform Sanger sequencing on proband and parental DNA to confirm NGS findings and determine inheritance.
- Classify variants according to ACMG guidelines:
- Pathogenic (Class 5): Null variants in known POI genes, previously reported pathogenic variants
- Likely Pathogenic (Class 4): De novo variants with supporting evidence, predicted loss-of-function variants
- Variant of Uncertain Significance (Class 3): Insufficient evidence for classification
- Likely Benign (Class 2) and Benign (Class 1): Population frequency >5%, inheritance from unaffected parents
- Correlate genetic findings with clinical phenotype including age at diagnosis, hormone levels, and ultrasound findings.
- For research purposes, investigate potential oligogenic inheritance by analyzing combinations of variants in interacting genes [4] [3].
The Scientist's Toolkit: Essential Research Reagents
Table 3: Key Research Reagents for POI Genetic Studies
| Reagent/Resource | Function | Example Products | Application Notes |
|---|---|---|---|
| High-Throughput DNA Extraction | Isolation of high-quality genomic DNA | QIAsymphony DNA Midi Kits | Essential for both array-CGH and NGS workflows |
| Array-CGH Platform | Genome-wide CNV detection | Agilent SurePrint G3 4x180K | 60kb resolution optimal for balanced detection |
| Hybridization Capture System | Target enrichment for NGS | Agilent SureSelect XT-HS | Custom designs possible for POI gene panels |
| NGS Sequencer | High-throughput DNA sequencing | Illumina NextSeq 550 | Appropriate for trio sequencing at 30-50x coverage |
| CNV Analysis Software | Detection of copy number changes | CytoGenomics, Cartagenia Bench Lab | Integrates public CNV databases for interpretation |
| Variant Annotation Platform | Classification of sequence variants | Alissa Interpret, ANNOVAR | Incorporates ACMG guidelines for standardization |
| Population Databases | Filtering of common polymorphisms | gnomAD, DGV | Critical for distinguishing pathogenic variants |
| Disease Databases | Curated disease-variant relationships | ClinVar, HGMD, DECIPHER | Essential for variant interpretation |
| Sanger Sequencing | Validation of NGS findings | ABI 3500 Systems | Recommended for confirming pathogenic variants |
Workflow Integration and Data Interpretation Strategies
The integration of array-CGH and NGS data requires systematic approaches to maximize diagnostic yield while minimizing false positives. The following workflow illustrates the optimized diagnostic pathway for POI genetic diagnosis:
Figure 1: Integrated Diagnostic Workflow for POI. This optimized pathway demonstrates the sequential application of array-CGH and trio-based NGS, followed by systematic data integration and segregation studies to achieve a comprehensive genetic diagnosis.
The power of trio analysis lies in its ability to definitively establish inheritance patterns, which fundamentally transforms variant interpretation. The following diagram illustrates the decision-making process for variant classification based on segregation data:
Figure 2: Variant Interpretation Through Segregation Analysis. This decision tree demonstrates how inheritance patterns established through trio analysis directly inform variant classification according to ACMG guidelines.
Discussion and Future Directions
The integration of array-CGH and trio-based NGS represents a transformative approach for overcoming diagnostic hurdles in POI. The combined 57.1% detection rate demonstrated in recent studies substantially improves upon historical diagnostic yields [4]. Trio analysis provides particularly valuable information for variant interpretation by enabling definitive establishment of inheritance patterns, identification of de novo mutations, and recognition of compound heterozygosity [59].
The implementation of these technologies has revealed several important insights into POI genetics. First, the condition demonstrates considerable genetic heterogeneity, with pathogenic variants occurring in genes involved in diverse biological processes including folliculogenesis, meiosis, and DNA repair [3]. Second, approximately 25% of patients harbor variants of uncertain significance, highlighting the need for functional studies and data sharing through platforms like GeneMatcher to advance classification [4]. Third, emerging evidence suggests oligogenic inheritance may contribute to POI pathogenesis, wherein combinations of variants in interacting genes collectively contribute to disease expression [3].
Future directions in POI genetic diagnosis will likely include the gradual transition from array-CGH to genome sequencing as a first-tier test, given its ability to detect both CNVs and sequence variants in a single assay [57] [60]. The continued expansion of POI gene panels, informed by research into folliculogenesis and ovarian development, will further enhance diagnostic sensitivity. Additionally, the integration of functional validation assays and international data sharing initiatives will be crucial for resolving variants of uncertain significance.
For researchers and clinicians implementing these approaches, practical considerations include the establishment of bioinformatics pipelines capable of processing both array-CGH and NGS data, development of institutional protocols for trio-based studies, and creation of multidisciplinary teams to interpret complex genetic findings in the context of clinical phenotypes. The systematic application of these technologies and protocols will ultimately reduce diagnostic odysseys for POI patients, enable personalized reproductive counseling, and facilitate the development of targeted interventions for this complex disorder.
Optimizing Bioinformatic Tools for Accurate CNV Calling from NGS Data
The transition from array-based comparative genomic hybridization (array-CGH) to Next-Generation Sequencing (NGS) for copy number variation (CNV) detection represents a paradigm shift in genetic diagnostics and research, particularly for conditions like Premature Ovarian Insufficiency (POI). While array-CGH has been the clinical standard method for CNV assessment, NGS offers significant advantages, including higher resolution for breakpoint identification, the potential to discover novel CNVs, and the ability to perform comprehensive genomic analysis from a single assay [61] [11]. CNVs are structural variations involving duplications or deletions of DNA segments typically greater than 1 kilobase, collectively covering more than 10% of the human genome and playing significant roles in tumor initiation, progression, and various genetic disorders [62] [19].
The accurate detection of CNVs from NGS data remains challenging due to factors such as short read lengths, GC-content bias, mapping ambiguity, and the variable performance of bioinformatic tools [61] [63]. This application note provides a structured framework for optimizing CNV calling tools across different NGS approaches, with specific consideration for POI genetic diagnosis research. We present benchmarked protocols, performance comparisons under varied experimental conditions, and actionable guidelines to enhance detection accuracy in both research and clinical settings.
Tool Selection and Performance Benchmarking
CNV Calling Algorithm Categories
CNV detection tools utilize different computational approaches, each with distinct strengths and limitations:
- Read Depth (RD): Detects CNVs from changes in read coverage across genomic regions; most common approach for targeted sequencing [61] [11]
- Split Read (SR): Identifies breakpoints at base-pair resolution by detecting reads split across rearrangement junctions [19]
- Pair-End Mapping (PEM): Infers structural variations from discordant read pairs with abnormal insert sizes or orientations [19]
- Assembly (AS): Reconstructs sequences de novo to identify variations not present in the reference genome [19]
- Combined Approaches: Integrate multiple signals to improve detection accuracy [19]
Performance Comparison Across Experimental Conditions
Tool performance varies significantly across sequencing depths, tumor purity levels, and CNV types. Based on comprehensive benchmarking studies, here are the key findings:
Table 1: Optimal Tool Selection Based on Experimental Conditions
| Experimental Condition | Recommended Tools | Performance Notes | Citation |
|---|---|---|---|
| Low-coverage WGS (≥50% purity) | ichorCNA | Outperforms others in precision and runtime at high purity | [62] |
| Whole Genome Sequencing | GATK gCNV, Lumpy, DELLY, cn.MOPS | Balanced recall and precision; suggested combination | [61] |
| Gene Panel (Diagnostic) | DECoN, panelcn.MOPS | Detects single/multi-exon CNVs; DECoN offers better specificity | [63] |
| Hyper-diploid Cancer Genomes | ascatNgs, CNVkit, DRAGEN | Consistent performance despite ploidy challenges | [64] |
| Whole Exome Sequencing | CANOES | 87.25% sensitivity vs. aCGH; effective for single-exon CNVs | [65] |
Table 2: Impact of Technical Factors on CNV Detection Accuracy
| Factor | Impact on CNV Detection | Mitigation Strategy | |
|---|---|---|---|
| Tumor Purity | Low purity (≤30%) obscures true CNVs; ≥50% recommended for lcWGS | ichorCNA optimal for ≥50% purity; require higher depth for low purity | [62] |
| FFPE Artifacts | Induces artifactual short-segment CNVs due to formalin-driven DNA fragmentation | Strict fixation time control; prioritize fresh-frozen samples | [62] |
| Sequencing Depth | lcWGS (≤10×) sufficient for large CNVs; higher depth needed for small variants | 5-10× for large CNVs; 20-30×+ for exon-level resolution | [62] [19] |
| Platform Comparison | WGS outperforms WES for CNV detection; higher concordance between tools | Use WGS when possible; cross-validate WES findings | [64] |
Experimental Protocols for Robust CNV Detection
Sample Preparation and Sequencing Guidelines
DNA Extraction and Quality Control
- Use high-quality DNA (QD > 8) extracted from fresh-frozen samples when possible
- For FFPE samples, limit fixation time to <24 hours to minimize formalin-driven fragmentation [62]
- Quantify DNA using fluorometric methods (Qubit) and assess integrity via TapeStation or Bioanalyzer
Library Preparation and Sequencing
- For targeted panels: Use hybridization-based capture (e.g., Agilent SureSelect, Illumina TruSight)
- For WGS: Fragment DNA to 300-500bp and use PCR-free library prep when possible
- Minimum sequencing depths:
- Gene panels: 500-1000×
- WES: 80-150×
- lcWGS: 5-10× (for large CNVs)
- Diagnostic WGS: 30-50× [66]
Bioinformatic Processing Workflow
The following diagram illustrates the core bioinformatic workflow for CNV detection from NGS data:
Quality Control and Alignment
- Perform quality assessment with FastQC
- Trim adapters and low-quality bases using Trimmomatic or Cutadapt
- Align to reference genome (GRCh37/GRCh38) using BWA-MEM [63]
- Process BAM files: sort, mark duplicates (Picard), and recalibrate base quality scores (GATK)
CNV Calling and Analysis
- Select appropriate tool(s) based on experimental design (refer to Table 1)
- For critical applications, use multiple complementary tools and take consensus
- Normalize coverage bias using GC correction and control samples
- Annotate CNVs with gene information, population frequency, and clinical databases
The Scientist's Toolkit: Essential Research Reagents and Materials
Table 3: Essential Research Reagents and Computational Tools for CNV Analysis
| Category | Specific Products/Tools | Application Function |
|---|---|---|
| Library Prep Kits | Agilent SureSelect, Illumina Nextera, TruSeq | Target enrichment and library preparation for WES and gene panels |
| Sequencing Platforms | Illumina NovaSeq, HiSeq, NextSeq | High-throughput sequencing with proven CNV detection capability |
| Alignment Tools | BWA-MEM, Bowtie2 | Map sequencing reads to reference genome with high accuracy |
| CNV Detection Tools | See Table 1 for specific recommendations | Detect copy number changes from aligned sequencing data |
| Validation Methods | MLPA, aCGH, QMPSF | Orthogonal validation of NGS-detected CNVs in diagnostic settings |
| Reference Materials | NA12878, HCC1395 cell lines | Gold standard samples for benchmarking and quality control |
Analysis and Interpretation Guidelines
Quality Metrics and Filtering Criteria
Establish stringent quality thresholds to minimize false positives:
- For RD-based callers: minimum of 20-30 supporting reads for exon-level CNVs
- Segment significance: p-value < 0.05 after multiple testing correction
- Log2 ratio thresholds: >|0.3| for gains/losses in diploid regions
- For germline CNVs: validate inheritance pattern when trio data available
Visualization and Validation Strategies
Implement comprehensive visualization approaches:
- Generate copy number ratio plots across all chromosomes
- Visualize read depth in genomic browsers (IGV, UCSC)
- Integrate B-allele frequency plots for LOH detection
- For diagnostic applications, confirm all reportable CNVs with orthogonal methods (MLPA, aCGH) [63]
The following diagram illustrates the decision-making process for CNV interpretation and validation:
Optimizing CNV detection from NGS data requires careful consideration of multiple interdependent factors: biological (sample type, purity), technical (sequencing depth, platform), and analytical (tool selection, parameters). No single bioinformatic tool performs optimally across all scenarios, necessitating scenario-specific tool selection as outlined in this protocol.
For POI genetic diagnosis research, we recommend: (1) implementing a multi-tool approach with DECoN or panelcn.MOPS for targeted panels and ichorCNA for low-coverage WGS; (2) maintaining tumor purity ≥50% when possible; (3) establishing rigorous validation protocols for candidate variants; and (4) utilizing the visualization and interpretation frameworks provided. This optimized pipeline enhances detection accuracy while providing a standardized approach for comparing CNV findings across studies, ultimately advancing our understanding of the genetic architecture of Premature Ovarian Insufficiency.
Premature Ovarian Insufficiency (POI) is a clinically heterogeneous disorder characterized by the loss of ovarian function before age 40, affecting approximately 1% of women of reproductive age [4] [6]. Despite established genetic, autoimmune, and iatrogenic causes, nearly 70% of POI cases remain idiopathic, presenting a significant diagnostic challenge [4]. The genetic architecture of POI is complex, involving chromosomal abnormalities, single nucleotide variants (SNVs), and copy number variations (CNVs) across hundreds of genes involved in ovarian function [4]. This complexity necessitates advanced genomic approaches for comprehensive diagnosis and underscores the critical importance of systematic data reanalysis as knowledge evolves.
The traditional diagnostic pathway for POI has relied on chromosomal analysis and FMR1 premutation testing, followed by either array comparative genomic hybridization (array-CGH) for CNV detection or next-generation sequencing (NGS) for SNV identification [4]. However, emerging evidence demonstrates that combining these technologies significantly improves diagnostic yield. A 2025 study of 28 idiopathic POI patients revealed that integrative analysis using both array-CGH and a custom 163-gene NGS panel identified genetic anomalies in 57.1% of cases—a substantial improvement over single-method approaches [4]. This multi-platform strategy successfully detected causal CNVs in 3.6% of patients, causal SNVs/indels in 28.6%, and variants of uncertain significance (VUS) in an additional 25% of the cohort [4].
As genomic technologies advance and biological knowledge expands, systematic reanalysis of existing genomic data represents a powerful yet underutilized strategy for uncovering previously missed diagnoses. This application note details experimental protocols and analytical frameworks for leveraging updated databases and artificial intelligence (AI) to extract new insights from previously generated array-CGH and NGS data in POI research.
Technology Comparison: Array-CGH versus NGS in POI Diagnostics
The strategic selection of genomic technologies is fundamental to optimizing diagnostic yield in POI investigation. Array-CGH and NGS offer complementary strengths, with each method capable of detecting distinct variant types relevant to POI pathogenesis.
Table 1: Performance Characteristics of Genomic Technologies in POI Diagnostics
| Feature | Array-CGH | Targeted NGS Panels | Whole Exome Sequencing (WES) | Whole Genome Sequencing (WGS) |
|---|---|---|---|---|
| Analyzed Region | Genome-wide CNVs | 50–500 selected genes | All coding exons (~1-2% of genome) | Entire genome (coding + non-coding) |
| Primary Variants Detected | Copy number variations (CNVs) | Single nucleotide variants (SNVs), small indels | SNVs, small indels | SNVs, indels, structural variants, CNVs |
| Resolution | >60 kb (180K array) [4] | Single base-pair | Single base-pair | Single base-pair |
| Diagnostic Yield in POI | 3.6% (causal CNVs) [4] | 28.6% (causal SNVs/indels) [4] | Increases with gene discovery | Potentially highest (comprehensive) |
| CNV Detection Capability | Excellent (primary function) | Limited | Partial (depends on pipeline) [66] | Excellent [66] |
| Advantages | Genome-wide CNV detection without controls; established interpretation guidelines | High depth for confident SNV calling; focused, interpretable results | Hypothesis-free; enables novel gene discovery | Most comprehensive variant detection |
| Limitations | Cannot detect balanced rearrangements or SNVs | Limited to predefined genes; may miss novel genes | May miss non-coding and CNVs; larger VUS burden | Higher cost; complex data analysis; storage challenges |
Array-CGH functions by competitively hybridizing patient and control DNA to arrayed genomic probes, detecting chromosomal imbalances through fluorescence intensity ratios [11]. This technology excels at identifying CNVs larger than 60 kb, with higher-resolution arrays (180K, 400K, or 1M) improving detection of smaller clinically relevant CNVs [4] [11]. In POI diagnostics, array-CGH has proven particularly valuable for detecting X-chromosome abnormalities, a well-established genetic cause of ovarian insufficiency [4].
NGS technologies, including targeted panels, whole exome sequencing (WES), and whole genome sequencing (WGS), utilize parallel sequencing of DNA fragments to identify single nucleotide variants, small insertions/deletions (indels), and—with appropriate bioinformatic pipelines—CNVs [66]. The read-depth approach of NGS-based CNV detection compares normalized sequence coverage between genomic regions to identify deletions or duplications [11]. While NGS panels targeting POI-associated genes offer high sensitivity for SNVs, WES and WGS provide increasingly comprehensive variant detection, with WGS additionally capturing non-coding variants and complex structural rearrangements [66].
Table 2: Combined Diagnostic Yield of Array-CGH and NGS in Idiopathic POI
| Genetic Finding | Number of Patients | Percentage of Cohort (n=28) | Detection Technology Required |
|---|---|---|---|
| Causal CNV | 1 | 3.6% | Array-CGH |
| Causal SNV/Indel | 8 | 28.6% | NGS |
| Variant of Uncertain Significance (VUS) | 7 | 25.0% | Primarily NGS |
| Total with Genetic Anomalies | 16 | 57.1% | Combined Approach |
| No Anomaly Identified | 12 | 42.9% | - |
The synergistic application of both technologies is particularly powerful in POI, as evidenced by a 2025 study where combined array-CGH and NGS analysis achieved a 57.1% overall detection rate for genetic anomalies [4]. This integrated approach identified causal variants in 32.1% of patients and VUS in an additional 25%, dramatically reducing the proportion of truly idiopathic cases [4].
The Reanalysis Imperative: Transforming Unanswered Questions into Diagnoses
Genomic interpretation is inherently temporal—a variant deemed uncertain today may be reclassified as pathogenic tomorrow as knowledge advances. Several factors drive the need for periodic reanalysis of genomic data in POI research:
- Expanding Gene-Disease Associations: New POI-associated genes are continuously being discovered through ongoing research [4] [66]. A gene not implicated in POI at the time of initial analysis may subsequently be validated as disease-associated.
- Variant Reclassification: Population databases such as gnomAD continually accumulate data, enabling better assessment of variant frequency in control populations [4]. Simultaneously, clinical databases like ClinVar accumulate evidence regarding variant pathogenicity, facilitating periodic reassessment of VUS [67].
- Improved Analytical Algorithms: Bioinformatic tools for variant detection and interpretation evolve rapidly, with enhanced sensitivity for detecting complex variants such as CNVs from NGS data [11] [66].
- AI-Powered Prioritization: New artificial intelligence platforms can integrate multi-modal data including genomic features, protein structures, and gene expression patterns to improve variant prioritization [67] [68].
The clinical impact of reanalysis is substantial. One automated reevaluation system, GenomeAlert!, continuously monitors classification changes in ClinVar and demonstrated that 8.5% of variants were reclassified over a 32-month period, with the majority shifting toward pathogenic interpretations [67]. For POI patients with previously uninformative genetic testing, systematic reanalysis offers the potential to obtain molecular diagnoses years after initial testing, enabling improved prognosis, personalized management of associated health risks, and informed reproductive planning.
Experimental Protocols for Data Reanalysis
Protocol 1: Comprehensive Reanalysis Pipeline for Existing NGS Data
Purpose: To systematically reinterrogate existing NGS data (targeted panel, WES, or WGS) using updated references and analytical tools to identify previously missed pathogenic variants.
Materials and Reagents:
- Storage: High-performance computing cluster with sufficient storage for BAM/CRAM and VCF files
- Data: Existing patient NGS data (BAM/CRAM files) and original VCF files
- Software: Updated bioinformatic pipeline (alignment, variant calling, annotation tools)
- Databases: Latest versions of population (gnomAD), clinical (ClinVar), and functional (AlphaMissense) databases
Methodology:
- Data Quality Control: Verify integrity and quality of stored NGS data using FastQC (v0.12.0) or similar tools. Ensure average coverage meets minimum requirements (≥50× for WES, ≥100× for panels).
- Variant Recallling: Implement updated variant calling pipeline using current best practices:
- Realign sequences using BWA-MEM (v0.7.17) or modern aligner
- Recall variants with GATK (v4.4.0) or equivalent, using improved haplotype-aware algorithms
- Specifically call CNVs from NGS data using tools such as ExomeDepth (v1.1.6) or Canvas
- Variant Annotation and Filtering: Annotate variants using comprehensive annotation pipeline:
- Functional prediction: Ensembl VEP (v109) or SnpEff (v5.2) with LOFTEE
- Population frequency: gnomAD (v4.0), 1000 Genomes Project
- Pathogenicity predictions: REVEL, AlphaMissense, CADD
- Disease databases: ClinVar, OMIM, Orphanet
- POI-specific gene panel: Curated list of 163+ POI-associated genes [4]
- Variant Prioritization: Apply multi-tiered filtering strategy:
- Tier 1: Protein-truncating variants (nonsense, frameshift, canonical splice-site) in known POI genes
- Tier 2: Missense variants with pathogenic predictions in known POI genes
- Tier 3: Predicted damaging variants in novel candidate genes with relevant biological function
- Variant Classification: Classify variants according to ACMG/AMP guidelines using updated criteria that incorporate quantitative pathogenicity predictions [4].
Expected Outcomes: Identification of newly reportable variants in approximately 5-15% of previously negative cases, including newly pathogenic SNVs/indels and CNVs detectable through improved NGS analysis.
Protocol 2: Integrated Reanalysis Combining Array-CGH and NGS Data
Purpose: To synergistically analyze existing array-CGH and NGS datasets, leveraging the complementary strengths of each technology for comprehensive variant detection.
Materials and Reagents:
- Data: Historical array-CGH data (log2 ratio files) and NGS data (BAM/VCF)
- Software: Integrated analysis platform (e.g., SeqOne, Cartagenia) supporting both data types
- Databases: Updated CNV interpretation databases (DECIPHER, ClinGen)
Methodology:
- Data Integration: Co-visualize array-CGH and NGS findings in unified genomic browser to identify concordant regions of interest.
- CNV Refinement: Use NGS read-depth information to precisely define breakpoints of CNVs initially detected by array-CGH.
- Compound Heterozygosity Analysis: Identify potential compound heterozygous events where a CNV affects one allele and an SNV affects the other allele of the same gene.
- Gene-Dosage Analysis: Correlate CNV findings with NGS data to identify genes with altered copy number that may contribute to POI pathogenesis.
- Pathway Analysis: Integrate all variant types (SNV, indel, CNV) into biological pathway analysis to identify enriched processes in ovarian development and function.
Expected Outcomes: Resolution of VUS through complementary evidence, identification of multilocus pathogenic variations, and improved understanding of compound genetic influences on POI phenotype.
Protocol 3: AI-Enhanced Variant Prioritization and Phenotype Integration
Purpose: To leverage artificial intelligence platforms for improved variant prioritization through integration of genomic data with deep phenotypic information.
Materials and Reagents:
- Software: AI-powered genomic analysis platform (e.g., SeqOne DiagAI, Congenica)
- Data: Structured phenotypic data using Human Phenotype Ontology (HPO) terms
- Computational Resources: GPU-accelerated computing environment for deep learning models
Methodology:
- Phenotype Capture: Extract HPO terms from clinical notes using natural language processing (NLP) tools or structured phenotypic checklists.
- AI-Powered Prioritization: Implement ensemble approach combining:
- Random forest models trained on known pathogenic variants
- Deep neural networks (PASNET-like architectures) integrating genomic and phenotypic features [68]
- Graph neural networks embedding gene-phenotype relationships
- Explainable AI Interpretation: Utilize explainable AI (xAI) approaches such as DiagAI Score to transparently display contributing factors to variant prioritization [67].
- Cross-Disciplinary Validation: Convene multidisciplinary team including clinical geneticists, molecular biologists, and bioinformaticians to review AI-prioritized variants.
Expected Outcomes: Reduced variant interpretation time by 30-50%, improved diagnostic yield through identification of variants in genes not previously associated with POI but with relevant biological functions, and enhanced identification of pleiotropic genetic syndromes where POI is one component.
Visualization of Reanalysis Workflows
Figure 1: Comprehensive Reanalysis Workflow for POI Genetic Data. This workflow illustrates the systematic process for reanalyzing existing genomic data to uncover previously missed diagnoses through updated databases and AI-powered analysis.
Figure 2: Multimodal Data Integration for Enhanced POI Diagnosis. This visualization demonstrates the synergistic integration of complementary data types through AI platforms to identify complex genetic relationships in POI pathogenesis.
The Scientist's Toolkit: Essential Research Reagent Solutions
Table 3: Essential Research Reagents and Platforms for Genomic Reanalysis
| Category | Product/Platform | Specific Application in POI Research | Key Features |
|---|---|---|---|
| Sequencing Technologies | Illumina NextSeq 550 [4] | Targeted panel sequencing for POI genes | High-throughput sequencing with custom capture designs |
| Oxford Nanopore Technologies [67] | Epigenetic analysis of X-chromosome inactivation | Long-read sequencing for methylation detection | |
| Bioinformatic Tools | GATK (Genome Analysis Toolkit) [66] | Variant discovery in NGS data | Industry standard for SNV/indel calling |
| ExomeDepth/Canvas [66] | CNV detection from NGS data | Read-depth based CNV calling from exome data | |
| Alissa Interpret [4] | Clinical variant interpretation and reporting | ACMG classification and workflow management | |
| AI-Powered Platforms | SeqOne DiagAI [67] | AI-assisted variant prioritization | Explainable AI scoring for variant pathogenicity |
| clinALL [68] | Integration of genomic and clinical data | UMAP visualization for patient stratification | |
| Database Resources | gnomAD [4] | Population frequency filtering | Variant frequencies across diverse populations |
| ClinVar [4] | Pathogenicity evidence aggregation | Community-curated variant interpretations | |
| DECIPHER [4] | CNV interpretation and phenotyping | CNV pathogenicity assessment with clinical data |
The integration of array-CGH and NGS technologies has dramatically improved the diagnostic yield in POI, yet a significant proportion of cases remain molecularly unexplained. Systematic reanalysis of existing genomic data represents a powerful, cost-effective strategy to leverage previous investments in genetic testing while capitalizing on rapidly advancing genomic knowledge. Through implementation of the detailed protocols outlined in this application note—incorporating updated database resources, multimodal data integration, and AI-powered analytical platforms—research and clinical laboratories can substantially increase their POI diagnostic rates. As genomic medicine continues its rapid evolution, establishing standardized reanalysis protocols will be essential for maximizing diagnostic potential and translating emerging discoveries into improved patient care.
Array-CGH vs. NGS: A Head-to-Head Comparison of Diagnostic Yield and Utility in POI
The genetic diagnosis of rare diseases, including premature ovarian insufficiency (POI), has been revolutionized by high-throughput genomic technologies. For years, chromosomal microarray analysis, specifically array-based comparative genomic hybridization (array-CGH or aCGH), has been a first-tier test for detecting copy number variants (CNVs). The emergence of next-generation sequencing (NGS), particularly clinical exome sequencing (CES) and whole-genome sequencing (WGS), offers a more comprehensive view of the genome. This application note synthesizes evidence from recent clinical studies to directly compare the diagnostic yields of aCGH and NGS, providing structured data and experimental protocols for researchers and clinicians working in POI and other rare genetic disorders.
Recent studies across diverse patient populations, including neurodevelopmental disorders (NDDs) and essential autism spectrum disorder (ASD), provide quantitative evidence for the superior diagnostic yield of NGS-based approaches compared to aCGH.
Table 1: Comparative Diagnostic Yields of aCGH and NGS from Recent Clinical Studies
| Study & Population | Cohort Size | Array-CGH Diagnostic Yield (%) | NGS Diagnostic Yield (%) | Specific NGS Method | Notes |
|---|---|---|---|---|---|
| López-Rivera et al. (2021) [23]Neurodevelopmental Disorders (NDDs) | 1,412 | 5.7 | 20.0 | Clinical Exome Sequencing (CES) | NGS was performed on 245 aCGH-negative patients. |
| López-Rivera et al. (2021) [23]Global Developmental Delay/Intellectual Disability (GDD/ID) | Subgroup of 1,412 | 5.7 | 20.0 | CES | Higher diagnostic yield for GDD/ID versus other NDDs. |
| López-Rivera et al. (2021) [23]Autism Spectrum Disorder (ASD) | Subgroup of 1,412 | 3.0 | 6.1 | CES | Lowest diagnostic yield among NDD categories. |
| Radi et al. (2024) [69]Essential Autism Spectrum Disorder (ASD) | 122 | 0.8 (Pathogenic CNVs) | 3.1 (Pathogenic SNVs) | Whole Exome Sequencing (WES) | Combined WES and aCGH detection rate was 31.2% (including likely pathogenic variants). |
| Prospective Analysis [57]Rare Diseases (Blinded Study) | 416 | Part of SoC | 28.8 (Singleton GS) | Genome Sequencing (GS) | SoC (incl. aCGH & ES) yield was 35.1%; Trio GS yield was 36.1%. |
| Retrospective Analysis [57]Rare Diseases (Theoretical Maximum) | 416 | 36.7 (SoC) | 39.1 (Singleton GS) | Genome Sequencing (GS) | Eliminating experience bias, GS shows higher inherent capability. |
The data consistently demonstrates that NGS identifies a greater proportion of genetic diagnoses than aCGH. In a large study of NDDs, clinical exome sequencing solved 20% of cases compared to 5.7% by aCGH [23]. This trend holds in a real-world prospective clinical setting, where singleton genome sequencing achieved a diagnostic yield of 28.8%, closely matching the 35.1% yield of a standard-of-care (SoC) workflow that included aCGH and exome sequencing. Notably, trio genome sequencing achieved the highest prospective yield at 36.1% [57].
Detailed Experimental Protocols
To ensure reproducibility and provide a clear technical roadmap, below are the detailed experimental protocols for the key methodologies cited in the comparative studies.
Array-CGH Protocol for CNV Detection
This protocol is adapted from studies that identified diagnostic CNVs in cohorts with neurodevelopmental disorders and essential ASD [23] [69].
1. DNA Extraction and Quality Control
- Source: Extract high-molecular-weight DNA from peripheral blood lymphocytes using a standardized kit (e.g., QIAamp DNA Blood Maxi Kit, Qiagen).
- QC: Quantify DNA using a fluorometer (e.g., Qubit). Verify purity and integrity via spectrophotometry (A260/A280 ratio ~1.8) and agarose gel electrophoresis.
2. Sample Labeling
- Test DNA: Label with Cy3 fluorescent dye.
- Reference DNA (Control): Label with Cy5 fluorescent dye.
- Use sex-matched control DNA to avoid bias in detecting sex chromosome anomalies.
3. Hybridization
- Mix equal quantities of labeled test and reference DNA.
- Denature the DNA mixture and co-hybridize to a microarray slide (e.g., CytoSure ISCA V3 180K platform) for approximately 24 hours at 65°C in a dedicated hybridization chamber [69].
4. Washing and Scanning
- After hybridization, wash slides in stringent buffers to remove non-specifically bound DNA.
- Scan the microarray using a high-resolution scanner (e.g., Innoscan 710) to capture fluorescence intensities at both Cy3 and Cy5 wavelengths.
5. Data Analysis
- Use dedicated software (e.g., Cytosure Interpret Software) to calculate the log2 ratio of test-to-reference fluorescence for each probe [11] [69].
- Interpretation:
- Deletion: Log2 ratio < -0.3 (significantly negative, appears red).
- Normal: Log2 ratio ~0.
- Duplication: Log2 ratio > +0.3 (significantly positive, appears green) [11].
- Identify CNVs and classify them based on established databases (e.g., DECIPHER, DGV) and guidelines into Pathogenic, Likely Pathogenic, Variant of Uncertain Significance (VUS), or Benign categories [23].
Clinical Exome Sequencing (CES) Protocol for SNV and Indel Detection
This protocol outlines the targeted capture and sequencing of disease-associated genes, as used in key comparative studies [23] [69].
1. Library Preparation and Target Enrichment
- Shearing: Fragment genomic DNA via acoustic shearing or enzymatic digestion to a target size of 150-300bp.
- Library Prep: Perform end-repair, A-tailing, and adapter ligation using a commercial library preparation kit (e.g., Illumina DNA Prep).
- Enrichment: Hybridize the library to biotinylated probes designed to capture the exonic regions of ~4,500-5,000 genes known to be associated with human disease (a "clinical exome") [23]. Alternatively, a whole exome capture kit (e.g., Twist Human Core Exome) can be used and bioinformatically filtered to a clinical gene list.
- Capture: Use streptavidin-coated magnetic beads to isolate the probe-bound targets. Wash away non-specific fragments.
2. Sequencing
- Amplify the enriched library via PCR.
- Perform massively parallel sequencing on a platform such as the Illumina NovaSeq 6000 with a 2x150 bp paired-end read configuration [57] [69].
- Target a mean coverage depth of >100x across the exome to ensure high sensitivity for variant calling.
3. Bioinformatic Analysis
- Alignment: Map raw sequencing reads to the human reference genome (GRCh37/hg19 or GRCh38) using aligners like BWA-MEM.
- Variant Calling: Call single nucleotide variants (SNVs) and small insertions/deletions (Indels) using a variant caller such as GATK HaplotypeCaller.
- Annotation and Filtering: Annotate variants using tools like ANNOVAR or TGex with population frequency (gnomAD), in silico prediction (CADD, SIFT), and disease databases (OMIM, ClinVar, SFARI).
- Trio Analysis (if applicable): Use inheritance patterns to prioritize de novo, compound heterozygous, and inherited variants.
4. Clinical Interpretation
- Classify variants according to ACMG/AMP guidelines into Pathogenic (P), Likely Pathogenic (LP), VUS, Likely Benign (LB), or Benign (B) categories [69].
- Report P/LP variants that explain the patient's phenotype.
Diagnostic Pathways and Technology Integration
The following diagram illustrates the logical workflow for integrating aCGH and NGS in a diagnostic odyssey, based on clinical study findings.
The Scientist's Toolkit: Key Research Reagents & Platforms
Table 2: Essential Materials and Kits for Genetic Diagnostics Research
| Item Name | Function/Application | Specific Example(s) from Literature |
|---|---|---|
| DNA Extraction Kit | Isolation of high-quality genomic DNA from whole blood. | QIAamp DNA Blood Maxi Kit (Qiagen) [69] |
| aCGH Platform | High-resolution detection of copy number variants. | CytoSure ISCA V3 4x180K (Oxford Gene Technology) [69] |
| aCGH Scanner | Imaging fluorescence signals from hybridized microarrays. | InnoScan 710 Microarray Scanner (Innopsys) [69] |
| Exome Capture Kit | Enrichment of protein-coding regions for sequencing. | Twist Human Core Exome Kit [69]; xGen Exome Research Panel v2 (IDT) [57] |
| NGS Library Prep Kit | Preparation of fragmented DNA for sequencing. | Illumina DNA Prep; DNA PCR-Free Prep, Tagmentation Kit [57] |
| NGS Sequencer | High-throughput parallel sequencing. | Illumina NovaSeq 6000 System [57] [69] |
| Bioinformatic Aligner | Mapping NGS reads to a reference genome. | BWA (Burrows-Wheeler Aligner) [66] [70] |
| Variant Caller | Identifying sequence variants from aligned reads. | GATK (Genome Analysis Toolkit) [66] [70] |
| Variant Interp. Software | Annotating and filtering variants for clinical reporting. | TGex (LifeMap Sciences) [69]; DRAGEN Germline Pipeline [57] |
The collective evidence from recent clinical studies firmly establishes that NGS-based methods, particularly clinical exome and genome sequencing, offer a significantly higher diagnostic yield than array-CGH for a range of genetic disorders. While aCGH remains a valuable tool for detecting CNVs, its limitations in resolving single-exon events and sequence-level variation are clear. For the genetic diagnosis of POI and other heterogeneous conditions, an approach that employs NGS as a first- or second-tier test provides a more efficient path to a molecular diagnosis, ultimately helping to shorten the diagnostic odyssey for patients and families. The future of genetic diagnostics lies in comprehensive, NGS-first pipelines, with WGS poised to become the universal test as costs decrease and bioinformatic interpretation improves.
In the field of genetic diagnostics, particularly for the research of Premature Ovarian Insufficiency (POI), identifying the most effective technological approach is paramount for achieving a successful molecular diagnosis. Two powerful technologies dominate this landscape: array-based comparative genomic hybridization (array-CGH) and next-generation sequencing (NGS). Array-CGH has long been the standard first-tier test for the detection of chromosomal imbalances [32] [36]. Meanwhile, NGS technologies, which include whole exome sequencing (WES) and whole genome sequencing (WGS), have emerged as comprehensive tools capable of detecting a broader spectrum of genetic variation [11] [31].
This application note provides a detailed, feature-by-feature comparison of these two technologies. It is framed within the context of POI genetic diagnosis research, a field that demands high resolution and accuracy due to the heterogeneous genetic etiology of the condition. The content is structured to guide researchers, scientists, and drug development professionals in selecting and implementing the optimal genetic analysis strategy for their specific research objectives.
Fundamental Principles
Array Comparative Genomic Hybridization (array-CGH) is a technique designed to detect quantitative abnormalities, specifically copy number variations (CNVs), across the genome. The process involves fluorescently labeling patient and control DNA samples with different dyes (e.g., Cy3 and Cy5). These labeled samples are co-hybridized to a microarray slide containing thousands of immobilized DNA probes. The fluorescence intensity ratios at each probe are then measured and analyzed; a deviation from the expected 1:1 ratio indicates a copy number loss (deletion) or gain (duplication) in the patient's genome [11] [71]. The resolution of array-CGH is entirely dependent on the type, number, and genomic spacing of the probes mounted on the array [11].
Next-Generation Sequencing (NGS), also known as massively parallel sequencing, encompasses several high-throughput methods that can sequence hundreds of megabases to gigabases of DNA in a single run. For CNV detection, particularly within whole exome or genome sequencing data, the read depth method is most commonly used. This approach involves a relative comparison of sequence coverage (depth) between genomic regions. A significant decrease in read depth in a specific region suggests a heterozygous or homozygous deletion, while a notable increase suggests a duplication [11]. Unlike array-CGH, NGS can simultaneously detect other variant types, including single nucleotide variants (SNVs) and small insertions/deletions (indels) from the same dataset [31] [72].
Feature-by-Feature Comparative Analysis
The table below provides a direct, quantitative comparison of the core features of array-CGH and NGS, summarizing their performance across key metrics relevant to diagnostic research.
Table 1: Feature-by-feature comparison of array-CGH and NGS for genetic diagnosis.
| Feature | Array-CGH | Next-Generation Sequencing (Clinical Exome/Whole Exome) |
|---|---|---|
| Primary Detectable Variants | Copy Number Variations (CNVs) / Chromosomal gains and losses [11] [71] | SNVs, small indels, and (via read-depth analysis) CNVs [11] [31] |
| Typical Diagnostic Yield in NDDs* | 5.7% - 23.3% (varies by cohort and platform) [23] [11] | ~20% - 40% (can be higher with trio analysis) [23] [11] |
| Resolution | Determined by probe density (e.g., 60K to 1M+ arrays); can detect microdeletions/duplications [11] [32] | Single exon-level for CNVs; single-base-pair for sequence variants [11] [36] |
| Ability to Detect Novel Genes | Limited to regions covered by the array's probes [11] | High, especially with whole exome/genome sequencing [31] |
| Turnaround Time | Several days [71] | Several days to weeks (depending on data analysis complexity) |
| Key Strengths | Established, standardized first-tier test for CNVs; genome-wide CNV screening without prior hypothesis [32] [71] | Comprehensive variant detection from one assay; simplifies diagnostic odyssey; high yield for heterogeneous disorders [11] [23] |
| Key Limitations | Cannot detect SNVs/indels, balanced rearrangements, or triploidy; resolution is fixed by the array design [71] [11] | May miss large CNVs spanning non-coding regions (in WES); complex data analysis; variants of uncertain significance (VUS) [11] [36] |
*NDDs: Neurodevelopmental Disorders, often used as a benchmark for genetic diagnostic yield studies.
Experimental Protocols
Array-CGH Workflow Protocol
The following protocol details the key steps for performing array-CGH analysis in a research setting, such as for a POI cohort study.
Table 2: Key research reagents and solutions for array-CGH.
| Research Reagent Solution | Function |
|---|---|
| QIAamp DNA Kit (or equivalent) | For high-quality DNA extraction from patient samples (e.g., peripheral blood, tissue). |
| Oligonucleotide Array (e.g., Agilent 180K) | The core platform containing genome-wide probes for hybridization. |
| Fluorescent Dyes (Cy3-dUTP, Cy5-dUTP) | For differential labeling of test and reference DNA samples. |
| Hybridization Chamber and Oven | To provide a controlled environment for the hybridization reaction. |
| DNA Microarray Scanner | To detect and quantify the fluorescence signals from the hybridized array. |
| Cytogenetics Analysis Software (e.g., Agilent CytoGenomics) | For image analysis, quality control, and initial CNV calling. |
Procedure:
- DNA Extraction & Quality Control: Extract genomic DNA from the patient (test) and a healthy control (reference) using a commercial kit. Precisely quantify the DNA using a fluorometer and verify integrity by agarose gel electrophoresis. A 260/280 ratio of ~1.8 is ideal.
- DNA Labeling: Enzymatically label 500 ng - 1 µg of test DNA with Cy5-dUTP and reference DNA with Cy3-dUTP (or vice-versa) using a random priming method.
- Purification & Hybridization: Purify the labeled DNA to remove unincorporated nucleotides. Combine the purified test and reference DNA with human Cot-1 DNA (to block repetitive sequences) and a hybridization buffer. Denature the mixture at 95°C for 3 minutes and incubate at 37°C for 30 minutes. Apply the sample to the microarray, seal in a hybridization chamber, and incubate at 65°C for 24-40 hours with rotation.
- Washing: After hybridization, perform a series of stringent washes to remove non-specifically bound DNA.
- Scanning & Data Acquisition: Scan the array using a high-resolution microarray scanner to capture the fluorescence intensities for both channels.
- Data Analysis: Import the images into dedicated cytogenetics software. Normalize the log2 ratios of the Cy5/Cy3 signals, segment the data, and call CNVs. Annotate findings using public databases (e.g., DECIPHER, DGV, ClinGen) and classify according to ACMG/ClinGen guidelines [36] [71].
Diagram 1: Array-CGH experimental workflow.
NGS-Based CNV Analysis Workflow Protocol
This protocol outlines the process for detecting CNVs from whole exome sequencing data, a common approach in research diagnostics.
Table 3: Key research reagents and solutions for NGS-based CNV analysis.
| Research Reagent Solution | Function |
|---|---|
| DNA Extraction Kit | For obtaining high-molecular-weight genomic DNA. |
| Exome Capture Kit (e.g., Illumina, Agilent) | To enrich for the protein-coding regions of the genome. |
| NGS Library Preparation Kit | For fragmenting DNA and attaching platform-specific adapters and barcodes. |
| NGS Platform (e.g., Illumina NovaSeq) | The instrument for performing massively parallel sequencing. |
| Bioinformatics Computing Cluster | High-performance computing environment for processing large sequencing datasets. |
| CNV Calling Software (e.g., CNVkit, ExomeDepth) | Specialized algorithms to identify copy number changes from read-depth data. |
Procedure:
- Library Preparation & Target Enrichment: Fragment genomic DNA and ligate sequencing adapters containing sample-specific barcodes to create a sequencing library. For exome sequencing, hybridize the library to biotinylated probes complementary to the exonic regions. Capture the probe-bound fragments using streptavidin-coated magnetic beads and wash away non-specific fragments.
- Sequencing: Amplify the enriched library via PCR and load it onto an NGS platform (e.g., Illumina) for cluster generation and sequencing-by-synthesis, typically generating 150 bp paired-end reads.
- Primary Data Analysis (Base Calling & Demultiplexing): The sequencer's software performs real-time base calling, converting raw fluorescence signals into nucleotide sequences (FASTQ files) and demultiplexing them by sample barcode.
- Secondary Analysis (Read Alignment & Processing): Align the sequencing reads to the human reference genome (e.g., GRCh37/hg19) using a aligner like BWA. Process the resulting BAM files by marking duplicates, and recalibrating base quality scores using tools from the GATK suite.
- CNV Calling (Read-Depth Analysis): Execute a read-depth-based CNV calling algorithm. The tool will bin the exome into targets, normalize read counts for GC-content and other biases, and compare the normalized coverage of the sample to a set of control samples to identify regions with statistically significant deviations in coverage, indicating CNVs.
- Annotation & Interpretation: Annotate the called CNVs with gene information, population frequency from databases like gnomAD and DGV, and overlap with known pathogenic variants in ClinVar and DECIPHER. Integrate with SNV/indel findings for a comprehensive molecular diagnosis [11] [23].
Diagram 2: NGS-based CNV analysis workflow.
Decision Framework and Concluding Outlook
A Strategic Roadmap for Technology Selection
Choosing between array-CGH and NGS is not merely a technical decision but a strategic one that depends on the research question, sample type, and available resources. The following decision pathway provides a logical framework for selecting the most appropriate technology.
Diagram 3: Technology selection decision pathway.
Integrated Outlook
The landscape of genetic diagnostics is rapidly evolving. While array-CGH remains a robust, standardized, and cost-effective tool for focused CNV detection [32] [71], the evidence strongly points towards NGS as the more powerful and comprehensive technology for complex and heterogeneous conditions like POI. Studies consistently show that the diagnostic yield of clinical exome sequencing (~20%) can be significantly higher than that of array-CGH (~5.7%) in neurodevelopmental disorders, and this logic extends to other areas like POI research [11] [23].
The future of genetic research lies in integrated approaches. NGS not only simplifies the diagnostic pipeline by allowing simultaneous detection of multiple variant types but also enables the discovery of novel disease genes [31]. Furthermore, the clinical utility of genetic findings is enhanced by periodic reanalysis of data, as a significant proportion of variants of uncertain significance (VUS) can be reclassified with updated knowledge bases [36]. For research and drug development, NGS provides the rich, multi-layered genomic data necessary for target identification and the development of genetically stratified clinical trials [72] [73]. Consequently, for new investigations into genetically complex disorders, NGS is increasingly becoming the first-tier test of choice.
Premature Ovarian Insufficiency (POI) is a clinically heterogeneous disorder characterized by the loss of ovarian function before age 40, affecting approximately 1-3.5% of women [1] [2]. A significant challenge in managing POI lies in determining its etiology, with a substantial proportion of cases historically classified as idiopathic. The complex genetic architecture of POI, involving both chromosomal abnormalities and single-gene mutations, necessitates comprehensive diagnostic approaches [31] [4].
Array Comparative Genomic Hybridization (array-CGH) and Next-Generation Sequencing (NGS) represent two powerful but distinct genomic technologies. Array-CGH excels at detecting copy number variations (CNVs) and submicroscopic chromosomal rearrangements, while NGS identifies single nucleotide variants (SNVs), small insertions/deletions (indels), and novel genes [31] [11]. Rather than viewing these technologies as competing alternatives, emerging evidence demonstrates their synergistic potential when combined in a complementary diagnostic workflow [4].
This application note provides detailed protocols and analytical frameworks for implementing a combined array-CGH and NGS approach to elucidate the genetic etiology of idiopathic POI, offering researchers a comprehensive strategy to overcome the limitations of single-technology diagnostics.
Technical Comparison of Genomic Platforms
Fundamental Principles and Diagnostic Capabilities
Array-CGH and NGS operate on distinct technical principles, enabling complementary variant detection:
Array-CGH is a microarray-based technique that detects CNVs by comparing patient DNA to a reference genome through competitive hybridization. Fluorescently labeled test and reference DNA samples are co-hybridized to array platforms containing thousands of nucleic acid probes, with CNVs identified through fluorescence intensity ratios [31] [11]. Modern high-density arrays can detect deletions/duplications down to approximately 60 kb, making them ideal for identifying exon-level or larger chromosomal rearrangements [4].
NGS employs massively parallel sequencing of millions of DNA fragments simultaneously, providing single-base resolution across targeted genomic regions (gene panels), entire exomes (WES), or whole genomes (WGS) [55] [25]. Unlike array-CGH, NGS can detect SNVs, small indels, and through specialized analysis algorithms, larger CNVs based on read depth and mapping anomalies [11].
Table 1: Comparative Technical Specifications of Array-CGH and NGS Platforms
| Parameter | Array-CGH | NGS (Targeted Panels) | NGS (Whole Exome) |
|---|---|---|---|
| Variant Detection | Copy number variations (deletions/duplications) | SNVs, indels, small CNVs | SNVs, indels, exonic CNVs |
| Resolution | ~60 kb to 100 kb (depending on probe density) | Single nucleotide | Single nucleotide |
| Genome Coverage | Genome-wide, but targeted to probe locations | Predefined gene sets (~50-500 genes) | All protein-coding regions (~1-2% of genome) |
| Throughput | Moderate (1-2 days processing) | High (multiplexed samples per run) | High (multiplexed samples per run) |
| Balanced Rearrangements | Cannot detect | Limited detection | Limited detection |
| Novel Gene Discovery | No | Within predefined panel only | Yes |
| Typical Diagnostic Yield in POI | 3-5% [4] | 20-30% [4] | 25-35% [25] |
Complementary Diagnostic Yields in POI
Recent studies demonstrate the enhanced diagnostic yield achieved through combined technological approaches. A 2025 study of 28 idiopathic POI patients implemented both array-CGH and a custom 163-gene NGS panel, revealing pathogenic variants in 16 patients (57.1%): one causal CNV detected by array-CGH (3.6%), eight causal SNV/indel variations detected by NGS (28.6%), and seven variants of uncertain significance [4]. This study highlights how each method contributes independently to the overall diagnostic yield.
Another investigation of 1412 patients with neurodevelopmental disorders found that clinical exome sequencing (CES) provided a 20% diagnosis rate in samples previously undiagnosed by array-CGH, suggesting complementary rather than overlapping detection capabilities [11].
Integrated Experimental Protocols
Combined Array-CGH and NGS Workflow for POI
The following integrated protocol outlines a comprehensive approach for genetic diagnosis of POI, combining both technologies in a complementary workflow:
Sample Requirements and DNA Extraction
- Collect peripheral blood samples in EDTA tubes from POI patients meeting diagnostic criteria (amenorrhea >4 months and FSH >25 IU/L before age 40)
- Extract high-molecular-weight DNA using automated systems (e.g., QIAsymphony DNA midi kits, Qiagen)
- Quantify DNA using fluorometric methods (e.g., Qubit dsDNA HS Assay)
- Ensure DNA quality meets standards (A260/A280 ratio 1.8-2.0, minimum concentration 50 ng/μL)
Array-CGH Processing Protocol
- DNA Labeling and Hybridization
- Digest 500 ng of patient and reference DNA with appropriate restriction enzymes
- Label patient DNA with Cy5-dUTP and reference DNA with Cy3-dUTP using enzymatic labeling kits (e.g., CYTAG TotalCGH Labeling Kit)
- Purify labeled products using column purification
- Combine labeled patient and reference DNA with Cot-1 DNA and hybridization buffer
- Hybridize to 4×180K CGH microarrays (e.g., Agilent SurePrint G3) for 24-40 hours at 65°C with rotation
- Washing, Scanning, and Analysis
- Wash arrays according to manufacturer's protocols (Agilent Oligo aCGH/ChIP-on-Chip Wash Buffer System)
- Scan slides using microarray scanner (e.g., Agilent SureScan)
- Extract feature data using Feature Extraction software
- Analyze CNVs using specialized software (e.g., CytoGenomics with ADM-2 algorithm, Cartagenia Bench Lab CNV)
- Interpret findings using population (DGV) and clinical databases (DECIPHER, ClinGen)
NGS Panel Sequencing Protocol
- Library Preparation and Target Enrichment
- Fragment 50-100 ng DNA to 150-200 bp (e.g., Covaris sonication)
- Prepare sequencing libraries with platform-specific adapters (e.g., Illumina)
- Enrich targets using custom capture designs (e.g., SureSelect XT-HS, Agilent) covering 163 POI-associated genes
- Perform hybrid capture at 65°C for 16-24 hours
- Amplify captured libraries with index primers for sample multiplexing
- Sequencing and Data Analysis
- Pool libraries in equimolar ratios
- Sequence on appropriate platform (e.g., Illumina NextSeq 550, 2×150 bp)
- Achieve minimum coverage of 100x with >95% target bases at 30x
- Align reads to reference genome (GRCh37/hg19) using optimized aligners (e.g., BWA-MEM)
- Call variants using validated pipelines (e.g., GATK)
- Annotate variants using population (gnomAD), prediction (SIFT, PolyPhen-2), and clinical (ClinVar, HGMD) databases
- Classify variants according to ACMG/AMP guidelines
Data Integration and Interpretation
- Correlate findings from both platforms, noting potential compound heterozygosity or oligogenic inheritance
- Validate pathogenic CNVs and SNVs by orthogonal methods (MLPA for CNVs, Sanger sequencing for SNVs)
- Interpret variants in clinical context, considering phenotype-genotype correlations
The Scientist's Toolkit: Essential Research Reagents
Table 2: Key Research Reagents for Combined Array-CGH and NGS Workflow
| Reagent/Category | Specific Examples | Function in Workflow |
|---|---|---|
| DNA Extraction Kits | QIAsymphony DNA Midi Kits (Qiagen) | High-quality DNA extraction from blood samples |
| Array-CGH Platforms | Agilent SurePrint G3 Human CGH Microarray 4×180K | Genome-wide CNV detection with high resolution |
| CGH Labeling Kits | CYTAG TotalCGH Labeling Kit (Enzo) | Fluorescent dye incorporation for hybridization |
| NGS Library Prep | SureSelect XT-HS Target Enrichment System (Agilent) | Library preparation and target capture for POI genes |
| NGS Sequencing | Illumina NextSeq 550 System | High-throughput sequencing of enriched libraries |
| Analysis Software | CytoGenomics (Agilent), Alissa Align&Call (Agilent), Cartagenia Bench Lab CNV | CNV calling, variant detection, and clinical interpretation |
| Validation Reagents | MLPA Probemixes, Sanger Sequencing Reagents | Orthogonal confirmation of pathogenic variants |
Data Analysis and Integration Framework
Complementary Variant Detection in POI
The synergistic power of combined array-CGH and NGS analysis is exemplified by their ability to detect different classes of pathogenic variants in the same patient cohort:
Table 3: Representative Diagnostic Findings from Combined Array-CGH and NGS Analysis in POI
| Patient | Amenorrhea Type | Array-CGH Finding | NGS Finding | Integrated Diagnosis |
|---|---|---|---|---|
| Patient 2 | Primary | No pathogenic CNV | Homozygous FIGLA: c.239dup (p.Asn80Lysfs*26) | Autosomal recessive POI |
| Patient 3 | Primary | 15q25.2 deletion (1.85 Mb) | No pathogenic SNV/indel | Chromosomal deletion syndrome |
| Patient 5 | Secondary | 15q26.1 gain (VUS) | Heterozygous PMM2: c.91T>C (p.Phe31Leu) + DMC1: c.490A>G (p.Thr164Ala) | Possible digenic inheritance with VUS |
| Patient 7 | Secondary | No pathogenic CNV | Heterozygous TWNK: c.1210G>C (p.Gly404Arg) | Likely pathogenic mitochondrial disorder |
Array-CGH identified clinically significant CNVs in 3.6% of POI cases, predominantly large deletions affecting ovarian function genes or regulatory regions [4]. These include upstream deletions of SOX9 that disrupt testis-specific enhancers, and CYP19A1 rearrangements causing aromatase excess syndrome [31].
NGS detected pathogenic single nucleotide variants in 28.6% of cases across multiple genes including FIGLA, TWNK, and various meiosis and DNA repair genes [4]. Whole exome sequencing has further identified novel POI genes such as MKRN3 in central precocious puberty and specific NR5A1 mutations in 46,XX testicular/ovotesticular DSD [31].
Integrated Analysis Workflow
The following diagram illustrates the decision-making process for integrated data interpretation:
Discussion and Research Implications
Enhanced Diagnostic Resolution
The combined array-CGH and NGS approach increases the diagnostic yield in idiopathic POI from approximately 20-30% with either method alone to over 50% when used synergistically [4]. This enhanced resolution has important implications for both clinical management and genetic counseling.
Array-CGH detects CNVs affecting gene dosage and regulatory elements that are invisible to NGS, while NGS identifies point mutations in coding regions that are below the resolution threshold of array-CGH [31] [11]. The technologies thus interrogate complementary aspects of genomic variation.
Biological Insights and Molecular Mechanisms
The integrated approach has revealed novel biological insights into POI pathogenesis, including:
Non-coding regulatory mechanisms: Array-CGH has identified microdeletions in far upstream regions of SOX9, indicating the location of testis-specific enhancers and expanding our understanding of gonad development [31]
Oligogenic inheritance: NGS has enabled the identification of probable damaging mutations in multiple genes within the same patient, suggesting possible oligogenic inheritance in conditions previously considered monogenic [31]
Species-specific gene function: The discovery that specific NR5A1 mutations cause 46,XX testicular/ovotesticular DSD in humans but not mice highlights species-specific roles in sexual development [31]
Research Applications and Future Directions
For research and drug development, the combined approach enables:
- Cohort stratification: Genetically homogeneous patient subgroups can be identified for targeted therapeutic development
- Clinical trial enrichment: Precise genetic diagnosis enables better patient selection for intervention studies
- Biomarker discovery: Integration of genomic findings with endocrine parameters may yield predictive biomarkers
- Novel drug targets: Identification of new genetic pathways reveals potential therapeutic targets
Emerging methodologies including long-read sequencing, single-cell analysis, and multi-omics integration will further enhance the resolution of POI genetic diagnosis. However, the fundamental principle of combining complementary technologies will remain essential for comprehensive genomic investigation.
Array-CGH and NGS are not redundant technologies but rather complementary tools that, when combined, provide a synergistic diagnostic approach for complex genetic disorders like POI. The integrated protocol outlined in this application note offers researchers a comprehensive framework for maximizing diagnostic yield and biological insight. As the field moves toward more personalized medicine, this combined approach will be essential for unraveling the complex genetic architecture of reproductive disorders and developing targeted interventions.
Premature Ovarian Insufficiency (POI) is a clinically heterogeneous disorder often linked to genetic etiology. For years, array-based Comparative Genomic Hybridization (aCGH) has been the cornerstone of copy number variation analysis in POI diagnostics, recommended as a first-line test for idiopathic cases [74]. However, the limitations of aCGH are becoming increasingly apparent. It cannot detect the single nucleotide variants (SNVs) and small insertions/deletions (indels) that account for a significant portion of genetic diagnoses, potentially leading to iterative testing and prolonged diagnostic odysseys for patients [23].
The integration of Next-Generation Sequencing (NGS) offers a path toward a more unified diagnostic workflow. This application note evaluates the performance of NGS-based CNV detection, comparing it directly with the established standard of aCGH. We provide a structured framework and detailed protocols for researchers and clinicians to benchmark these technologies, with a specific focus on applications within POI genetic research. Our goal is to demonstrate that NGS is not only a viable alternative for CNV calling but, when properly optimized, can serve as a comprehensive first-tier test.
Performance Benchmarking: NGS vs. aCGH
A direct comparison of the diagnostic yield between aCGH and NGS reveals a significant advantage for sequencing-based approaches in most neurodevelopmental disorder (NDD) cases, a finding highly relevant to the genetic heterogeneity of POI. A 2021 study found that for patients with Global Developmental Delay/Intellectual Disability (GDD/ID), clinical exome sequencing solved 20% of cases, compared to just 5.7% solved by aCGH [23]. This trend is confirmed by a 2025 study, which reported that integrating CNV analysis into exome sequencing workflows provided an additional 4.6% diagnostic yield in a diverse pediatric cohort [18].
Table 1: Comparative Diagnostic Yields of aCGH and Exome Sequencing
| Phenotype Category | Diagnostic Yield (aCGH) | Diagnostic Yield (Clinical Exome Sequencing) |
|---|---|---|
| Global Developmental Delay/Intellectual Disability | 5.7% [23] | 20% [23] |
| Autism Spectrum Disorder (Isolated) | 3% [23] | 6.1% [23] |
| Other Neurodevelopmental Disorders | 1.4% [23] | 7.1% [23] |
| Diverse Pediatric Cohort (Additional CNV Yield from ES) | N/A | 4.6% [18] |
The performance of NGS-based CNV detection is highly dependent on the bioinformatic tools used. A 2025 benchmark of five CNV detection tools for low-coverage whole-genome sequencing (lcWGS) highlighted that ichorCNA outperformed others in precision and runtime at high tumor purity (≥50%) [62]. However, tool performance is not universal. Another 2025 study evaluating 12 tools found that the optimal choice depends on specific experimental configurations, including CNV length, sequencing depth, and sample purity [19]. Factors such as prolonged formalin-fixed, paraffin-embedded (FFPE) fixation can induce artifactual short-segment CNVs, a bias that current tools struggle to correct [62].
Table 2: Benchmarking of CNV Detection Tools for NGS Data
| Tool | Optimal Use Case / Strength | Noted Limitation |
|---|---|---|
| ichorCNA | Superior precision and runtime at high tumor purity (≥50%) in lcWGS [62]. | Performance linked to sample purity. |
| CNVkit | Adaptable for both whole-exome (WES) and whole-genome sequencing (WGS) [75]. | Performance varies with CNV type and length [19]. |
| Control-FREEC | For WGS data; requires matched normal for WES analysis [75]. | |
| FACETS | Analyzes WGS, WES, and targeted panels; provides allele-specific copy number [75]. | |
| ASCAT.sc | Suitable for shallow-coverage and single-cell sequencing [62]. | Unpublished derivative as of 2025 [62]. |
Experimental Protocols for CNV Detection
Protocol 1: Array CGH for CNV Detection
This protocol outlines the standard procedure for CNV detection using aCGH, the traditional first-line test.
Research Reagent Solutions:
- DNA Extraction Kit (e.g., MagNaPure Compact, Roche): For obtaining high-quality DNA from peripheral blood [76].
- aCGH Platform (e.g., 60K to 1M+): The microarray slide containing immobilized DNA probes. Resolution should be tailored to the clinical indication [76].
- Fluorescent Dyes (Cy3 and Cy5): For differential labeling of test and reference DNA samples [11].
- Bioinformatic Software (e.g., ChAS): For analyzing fluorescence ratios and calling CNVs [18].
Procedure:
- DNA Extraction & Quality Control: Extract DNA from patient peripheral blood or tissue. Assess concentration and quality using spectrometry [76].
- Fluorescent Labeling: Label the patient DNA with one fluorochrome (e.g., Cy5) and a control reference DNA with another (e.g., Cy3) [11].
- Hybridization: Mix the labeled test and reference samples and co-hybridize them to the aCGH platform. The samples compete to bind to the probes [11].
- Washing and Scanning: Wash the array to remove unbound DNA and scan it with a microarray scanner to measure fluorescence intensity at each probe location.
- Data Analysis: Calculate the log2 ratio of test to reference fluorescence. Deviations from zero (e.g., loss for negative values, gain for positive values) indicate copy number alterations [11] [77].
- Variant Interpretation: Annotate CNVs using databases like DECIPHER, ClinVar, and OMIM. Classify variants per ACMG/AMP guidelines (Pathogenic, VUS, Benign) [76].
Protocol 2: NGS-Based CNV Detection from Exome/Genome Data
This protocol describes an integrated approach to detect SNVs, Indels, and CNVs from a single NGS assay.
Research Reagent Solutions:
- Clinical Exome/Genome Panel: A targeted capture panel (e.g., ~4,000-5,000 genes for clinical exome) or WGS kit [23] [18].
- NGS Platform: Illumina-based sequencers are commonly used [75].
- CNV Calling Software (e.g., NxClinical, CNVkit, FACETS): Tools designed to detect copy number changes from NGS read-depth data [18] [75].
- Analysis Workstation: A high-performance computing system (e.g., Ubuntu Linux, 64+ cores) for data processing [62].
Procedure:
- Library Preparation & Sequencing: Prepare sequencing libraries from patient DNA using the selected exome or genome capture kit. Sequence on an NGS platform to an appropriate depth (e.g., >100x for exomes) [18].
- Read Alignment & QC: Align sequencing reads to a reference genome (e.g., GRCh38) using an aligner like BWA-MEM. Perform quality control checks on the aligned BAM files [62].
- CNV Calling: Input the BAM file into one or more CNV detection tools. For example:
- Multi-Tool Concordance & Validation: Run the same sample through multiple callers (e.g., CNVkit and FACETS) to improve detection accuracy, as concordance between different tools can be low [62] [75]. Technically challenging calls, such as single-exon deletions, should be confirmed by an orthogonal method (e.g., qPCR or a high-resolution array) [18].
- Integrated Interpretation: Correlate CNV findings with SNV/Indel data from the same sequencing run. Use HPO terms for phenotype-driven prioritization and aggregate evidence for a comprehensive molecular diagnosis [18].
The Scientist's Toolkit: Essential Reagents and Software
Table 3: Key Resources for CNV Detection Workflows
| Item | Function/Description | Example Products/Tools |
|---|---|---|
| High-Density aCGH | Gold standard for genome-wide CNV detection; detects gains/losses. | 60K, 180K, 400K, 1M arrays [11] [23] |
| Clinical Exome Panel | Targeted NGS capture for simultaneous SNV/Indel/CNV analysis. | Panels covering ~4,500 known disease genes [23] |
| CNV Calling Software | Detects CNVs from NGS read-depth data. | NxClinical [18], CNVkit [62] [75], FACETS [75], ichorCNA [62] |
| Bioinformatic Pipelines | Align sequences, perform quality control, and manage data. | BWA-MEM, SAMtools, Picard [62] |
| Variant Databases | Annotate and determine pathogenicity of detected CNVs. | DECIPHER, ClinVar, OMIM [76] |
Workflow and Data Analysis Visualization
The following diagrams illustrate the core workflows and analytical logic for the two primary CNV detection methods.
Diagram 1: Comparison of aCGH and integrated NGS workflows for CNV detection.
Diagram 2: Logical flow for multi-tool NGS-based CNV analysis to ensure robust results.
The evidence strongly supports a paradigm shift in the genetic diagnosis of POI. While aCGH remains a valuable tool, NGS provides a significantly higher diagnostic yield by offering a comprehensive view of the genomic landscape from a single test. For clinical and research laboratories, we recommend the following:
- For New Studies: Adopt clinical exome or genome sequencing as a first-tier test. This approach simplifies the diagnostic pipeline and maximizes the chance of identifying a causative genetic variant, whether it is an SNV, indel, or CNV.
- For Legacy Data: Implement systematic reanalysis of existing exome sequencing data with modern, validated CNV callers. This can uncover previously missed diagnoses, as demonstrated by the 4.6% additional yield in the 2025 study [18].
- For Optimal Accuracy: Employ a multi-tool CNV calling strategy followed by careful manual review of coverage plots for suspected regions. This mitigates the inherent limitations and biases of any single algorithm [62] [75].
The direction of genetic testing is moving toward more integrated solutions. By adopting NGS-based CNV detection, researchers and clinicians can end the diagnostic odyssey for more patients and families, paving the way for improved management and personalized care in Premature Ovarian Insufficiency.
The genetic diagnosis of idiopathic Premature Ovarian Insufficiency (POI) presents significant challenges for clinicians and researchers, with nearly 70% of cases remaining unexplained [28]. The selection of appropriate genomic technologies is paramount for identifying pathogenic variations responsible for this condition. This application note provides a structured framework for choosing between array-based Comparative Genomic Hybridization (array-CGH) and Next-Generation Sequencing (NGS) in both research and clinical diagnostic scenarios for POI.
Array-CGH and NGS offer complementary approaches to genomic analysis. Array-CGH excels at detecting copy number variations (CNVs) across the genome, while NGS identifies single nucleotide variations (SNVs), small insertions/deletions (indels), and can be configured to detect CNVs through bioinformatic approaches [28] [78]. A recent study investigating 28 idiopathic POI patients demonstrated that combining both technologies achieved a remarkable genetic diagnosis rate of 57.1% (16/28 patients), with array-CGH identifying causal CNVs in 14.3% of patients and NGS revealing causal SNV/indel variations in 28.6% of patients [28].
The integration of these technologies into a cohesive diagnostic and research strategy requires careful consideration of their respective strengths, limitations, and appropriate use cases. This document provides detailed experimental protocols, performance comparisons, and a decision matrix to guide researchers and clinicians in selecting the optimal approach for their specific needs in POI investigation.
Technology Comparison: Array-CGH versus NGS
Technical Specifications and Performance Metrics
Table 1: Comparative analysis of array-CGH and NGS technologies for POI genetic diagnosis
| Feature | Array-CGH | Targeted NGS Panels | Whole Exome Sequencing (WES) | Whole Genome Sequencing (WGS) |
|---|---|---|---|---|
| Analyzed Genomic Region | Genome-wide, focused on CNV detection | Predefined set of genes (e.g., 50-500 genes) | All protein-coding exons (~1-2% of genome) | Entire genome (coding + non-coding) [66] |
| Primary Variant Types Detected | Copy Number Variations (CNVs) [28] | SNVs, small indels, limited CNVs [66] | SNVs, small indels, some CNVs [78] | SNVs, indels, CNVs, structural variants, intronic variants [66] [78] |
| Resolution | ~60 kb and above (with standard arrays) [28] | Single-base resolution [66] | Single-base resolution [66] | Single-base resolution [66] |
| Diagnostic Yield in POI | 14.3% (causal CNVs) [28] | 28.6% (causal SNVs/indels) [28] | Higher for heterogeneous conditions | Highest potential, captures all variant types |
| Typical Coverage/Depth | N/A (probe-dependent) | 500-1000x [66] | 80-150x [66] | 30-50x [66] |
| Turnaround Time | Days to weeks | Weeks [79] | Weeks to months [79] | Months [79] |
| Cost Considerations | Low to moderate | Moderate | Moderate to high | High [66] |
Economic and Operational Considerations
Table 2: Operational and economic factors influencing technology selection
| Factor | Array-CGH | NGS |
|---|---|---|
| Infrastructure Requirements | Microarray scanner, specialized software | High-performance sequencers, extensive computing infrastructure, secure data storage [79] |
| Bioinformatics Complexity | Moderate (CNV calling algorithms) | High (alignment, variant calling, annotation, interpretation) [66] |
| Data Volume per Sample | Low (MB range) | High (GB to TB range, depending on approach) [66] |
| Personnel Expertise | Molecular cytogenetics | Clinical genomics, bioinformatics, molecular biology [79] |
| Reimbursement Landscape | Well-established for many indications | Evolving, varies by jurisdiction and indication |
| Scalability for Population Screening | Moderate | High, with appropriate automation [78] |
Clinical Workflow and Diagnostic Performance
The French Genomic Medicine Initiative (PFMG2025) provides real-world data on the implementation of large-scale genomic sequencing in clinical practice. As of December 2023, this program had returned 12,737 results for rare diseases and cancer genetic predisposition patients with a median delivery time of 202 days and a diagnostic yield of 30.6% [79]. For cancer patients, the median delivery time was significantly shorter at 45 days, reflecting the more streamlined analytical pipelines for somatic variant detection [79]. These metrics highlight the operational complexities of implementing NGS in clinical diagnostics.
In the specific context of POI, a combined approach using both array-CGH and targeted NGS demonstrates enhanced diagnostic efficacy. The study by Reproductive Medicine and Biology Department, Amiens University Hospital, achieved an overall diagnostic yield of 57.1% in idiopathic POI cases, with array-CGH identifying pathogenic CNVs containing genes like CPEB1, and NGS detecting pathogenic variants in genes involved in oogenesis, folliculogenesis, and DNA repair such as FIGLA, GALT, TWNK, POLG, ERCC6, and MCM9 [28].
Experimental Protocols
Array-CGH Protocol for POI Investigation
Objective: To detect clinically relevant copy number variations (CNVs ≥60 kb) in patients with idiopathic premature ovarian insufficiency.
Reagents and Solutions:
- QIAsymphony DNA Midi Kits (Qiagen) [28]
- SurePrint G3 Human CGH Microarray 4×180K (Agilent Technologies) [28]
- CytoGenomics software v5.0 (Agilent Technologies) [28]
- Cartagenia Bench Lab CNV software v5.1 (Agilent Technologies) [28]
Procedure:
- DNA Extraction: Extract genomic DNA from peripheral blood samples using QIAsymphony DNA Midi Kits according to manufacturer's protocol [28].
- DNA Quality Control: Assess DNA purity and concentration using spectrophotometry (e.g., Nanodrop) and fluorometry (e.g., Qubit). Ensure A260/A280 ratio between 1.8-2.0 and concentration ≥50 ng/μL.
- Restriction Digestion: Digest 1.5 μg of patient and reference DNA with AluI and RsaI restriction enzymes at 37°C for 2 hours.
- Labeling Reaction: Label patient DNA with Cy5-dUTP and reference DNA with Cy3-dUTP using random primers and exo-Klenow fragment at 37°C for 2 hours.
- Purification and Quantification: Purify labeled products using Microcon YM-30 filters and measure labeling efficiency. Ensure specific activity >25 pmol dye/μg DNA.
- Hybridization: Combine labeled patient and reference DNA with Cot-1 DNA and hybridization buffer. Denature at 95°C for 3 minutes and incubate at 37°C for 30 minutes. Apply to microarray and hybridize at 65°C for 40 hours with rotation.
- Washing: Wash slides with Oligo aCGH Wash Buffer 1 at room temperature for 5 minutes, then with Oligo aCGH Wash Buffer 2 at 37°C for 1 minute.
- Scanning and Image Analysis: Scan slides using Agilent microarray scanner and extract feature data using Feature Extraction software.
- CNV Analysis and Interpretation: Analyze data using CytoGenomics software with the following criteria:
- Aberration threshold: 5.0
- Minimum number of probes: 5
- Minimum absolute average log2 ratio: 0.25
- Validate findings using Cartagenia Bench Lab CNV with population frequency databases (DGV, gnomAD) and clinical databases (DECIPHER, ClinGen, OMIM) [28].
Array-CGH Experimental Workflow
Targeted NGS Panel Protocol for POI
Objective: To identify single nucleotide variants (SNVs) and small insertions/deletions (indels) in genes associated with premature ovarian insufficiency.
Reagents and Solutions:
- SureSelect XT-HS Reagents (Agilent Technologies) [28]
- Custom capture design of 163 POI-associated genes [28]
- Magnis System (Agilent Technologies) [28]
- NextSeq 550 System (Illumina) [28]
- Alissa Align&Call v1.1 and Alissa Interpret v5.3 (Agilent Technologies) [28]
Procedure:
- Library Preparation:
- Fragment 200 ng genomic DNA to 150-200 bp using acoustic shearing.
- Repair ends and add 'A' bases to 3' ends using SureSelect XT-HS reagents.
- Ligate Illumina sequencing adapters with unique dual indexes for sample multiplexing.
- Clean up libraries using AMPure XP beads.
Target Enrichment:
- Hybridize libraries to custom biotinylated RNA baits (163 POI-associated genes) at 65°C for 16 hours.
- Capture bait-bound fragments using streptavidin-coated magnetic beads.
- Wash to remove non-specifically bound fragments.
- Perform PCR amplification (12 cycles) to enrich captured targets.
Sequencing:
- Pool enriched libraries in equimolar ratios.
- Load onto NextSeq 550 system using 150 bp paired-end chemistry.
- Target minimum 100x coverage with >95% of target bases covered at ≥30x.
Bioinformatic Analysis:
- Demultiplex reads and generate FASTQ files.
- Align to reference genome (GRCh38) using BWA-MEM.
- Perform variant calling using GATK Best Practices pipeline.
- Annotate variants using ANNOVAR or similar tools.
Variant Interpretation:
- Filter variants against population databases (gnomAD, frequency <1%).
- Annotate with disease databases (ClinVar, HGMD, OMIM).
- Classify variants according to ACMG/AMP guidelines.
- Correlate findings with patient phenotype and family history.
Targeted NGS Experimental Workflow
Decision Matrix for Technology Selection
Scenario-Based Technology Selection Framework
Table 3: Decision matrix for selecting appropriate genomic technologies in POI
| Scenario | Primary Technology | Complementary Technology | Rationale | Key Considerations |
|---|---|---|---|---|
| Initial Diagnostic Workup | Karyotype + FMR1 testing | - | Standard first-line tests for common causes | Essential before advanced genomic testing [28] |
| Unexplained POI after first-line testing | Array-CGH | Targeted NGS Panel | Detects pathogenic CNVs (14.3% yield); NGS identifies SNVs/indels (28.6% yield) [28] | Combined approach maximizes diagnostic yield (57.1%) [28] |
| Research & Gene Discovery | Whole Exome/Genome Sequencing | Array-CGH for validation | Unbiased approach for novel gene identification | Higher cost and computational requirements [66] |
| Familial POI with clear inheritance pattern | Targeted NGS Panel | Sanger sequencing for validation | Cost-effective for known gene sets | Rapid turnaround for confirmed familial mutations |
| Syndromic POI with multiple anomalies | Array-CGH | WES/WGS | Comprehensive detection of CNVs and sequence variants | Identifies contiguous gene syndromes and complex rearrangements |
| Resource-Limited Settings | Targeted NGS Panel | - | Balanced approach for cost and diagnostic yield | Lower infrastructure requirements than WES/WGS |
Integrated Diagnostic Pathway
POI Genetic Testing Decision Pathway
Research Reagent Solutions
Table 4: Essential reagents and platforms for POI genetic investigation
| Reagent/Platform | Supplier | Application in POI Research | Key Features |
|---|---|---|---|
| SurePrint G3 Human CGH Microarray 4×180K | Agilent Technologies | Genome-wide CNV detection [28] | 60 kb resolution, optimized probe design |
| SureSelect XT-HS Target Enrichment | Agilent Technologies | Library preparation for NGS [28] | Hybridization-based capture, high specificity |
| Custom POI Gene Panel | Agilent Technologies/Illumina | Targeted sequencing of 163 POI-associated genes [28] | Customizable content, comprehensive coverage |
| NextSeq 550 System | Illumina | Medium-throughput sequencing [28] | 150 bp paired-end reads, flexible output |
| QIAsymphony DNA Midi Kits | Qiagen | Automated nucleic acid extraction [28] | High-quality DNA, minimal contamination |
| CytoGenomics Software | Agilent Technologies | Array-CGH data analysis [28] | CNV detection, visualization, reporting |
| Alissa Interpret | Agilent Technologies | NGS variant interpretation [28] | ACMG classification, workflow management |
| SeqOne Platform | SeqOne Genomics | AI-powered genomic analysis [80] | CE-IVD platform, CGH and NGS integration |
The genetic investigation of Premature Ovarian Insufficiency requires a strategic approach to technology selection based on clinical presentation, available resources, and diagnostic objectives. Array-CGH and NGS represent complementary technologies that, when applied judiciously through the decision matrix presented herein, can significantly increase diagnostic yield in idiopathic POI cases from approximately 30% with single approaches to over 57% with combined methodologies [28].
For clinical diagnostics, a sequential approach beginning with array-CGH followed by targeted NGS panels offers an optimal balance of comprehensive variant detection and cost-effectiveness. In research settings, whole exome or genome sequencing provides the most unbiased approach for novel gene discovery, with orthogonal validation using array-CGH. As genomic technologies continue to evolve and decrease in cost, WGS may eventually become the primary diagnostic modality, though current practical considerations favor the integrated approach outlined in this application note.
The implementation of standardized protocols, rigorous bioinformatic pipelines, and interdisciplinary collaboration between clinical geneticists, laboratory specialists, and bioinformaticians remains essential for maximizing diagnostic yield and translating genomic findings into improved patient care for women with Premature Ovarian Insufficiency.
Conclusion
The genetic diagnosis of POI is no longer reliant on a single technology. Array-CGH remains a powerful, standardized tool for detecting CNVs, while NGS offers unparalleled breadth in identifying single nucleotide variants and small indels across a growing list of candidate genes. Crucially, evidence confirms they are complementary; a combined approach can identify causal genetic anomalies in over 57% of idiopathic POI cases, a significant leap from the era of unexplained etiology. For researchers and drug developers, this enhanced diagnostic resolution is foundational. It enables better patient stratification for clinical trials, illuminates novel pathogenic mechanisms for drug targeting, and informs the development of polygenic risk models. The future of POI genetics lies in the deeper integration of these technologies with whole-genome sequencing, long-read sequencing, and AI-powered interpretation platforms. This will further increase diagnostic yield, refine our understanding of genotype-phenotype correlations, and ultimately unlock new avenues for therapeutic intervention and personalized medicine.
References
- 1. Evidence-based guideline: Premature Ovarian Insufficiency [https://www.asrm.org/practice-guidance/practice-committee-documents/evidence-based-guideline-premature-ovarian-insufficiency--2024/]
- 2. Changing Etiological Spectrum of Premature Ovarian ... [https://pmc.ncbi.nlm.nih.gov/articles/PMC12248835/]
- 3. Primary ovarian insufficiency: update on clinical and ... [https://www.frontiersin.org/journals/endocrinology/articles/10.3389/fendo.2024.1464803/full]
- 4. Genetics Investigation of Idiopathic Premature Ovarian ... [https://pmc.ncbi.nlm.nih.gov/articles/PMC11942377/]
- 5. Screening of premature ovarian insufficiency associated ... [https://bmcmedgenomics.biomedcentral.com/articles/10.1186/s12920-024-01873-z]
- 6. Contribution of Array-CGH and Next-Generation Sequencing [https://pubmed.ncbi.nlm.nih.gov/40149403/]
- 7. Premature ovarian insufficiency: clinical orientations for ... [https://pmc.ncbi.nlm.nih.gov/articles/PMC7722400/]
- 8. Genetic insights into the complexity of premature ovarian ... [https://rbej.biomedcentral.com/articles/10.1186/s12958-024-01254-2]
- 9. Targeted Next-Generation Sequencing Indicates a ... [https://www.frontiersin.org/journals/endocrinology/articles/10.3389/fendo.2021.664645/full]
- 10. Array-CGH diagnosis in ovarian failure: identification of new ... [https://ovarianresearch.biomedcentral.com/articles/10.1186/s13048-016-0272-5]
- 11. Comparison of CNV analysis methods: Array CGH vs NGS [https://3billion.io/blog/comparison-of-cnv-analysis-methods-array-cgh-vs-ngs]
- 12. : Revolutionizing Medical Genetics Array CGH [https://www.numberanalytics.com/blog/array-cgh-revolutionizing-medical-genetics]
- 13. Basic Principles of Array - bionanogenomics CGH [https://bionano.com/videos/basic-principles-of-array-cgh/]
- 14. Video: Array for... Comparative Genomic Hybridization Array CGH [https://www.jove.com/v/51718/array-comparative-genomic-hybridization-array-cgh-for-detection]
- 15. DETECTING COPY NUMBER VARIATIONS FROM ARRAY ... [https://pmc.ncbi.nlm.nih.gov/articles/PMC3326659/]
- 16. prioritization after Copy - number analysis... variants array CGH [https://pubmed.ncbi.nlm.nih.gov/26719768/]
- 17. Copy Number Variation (CNV) Analysis: A Guide for ... [https://pages.bionano.com/copy-number-variant-cnv-analysis]
- 18. Copy number variant analysis improves diagnostic yield in ... [https://www.nature.com/articles/s41525-025-00478-4]
- 19. Comparative study of tools for copy number variation ... [https://www.nature.com/articles/s41598-025-06527-3]
- 20. Next-Generation Sequencing Technology: Current Trends ... [https://pmc.ncbi.nlm.nih.gov/articles/PMC10376292/]
- 21. Next-generation sequencing and its clinical application [https://pmc.ncbi.nlm.nih.gov/articles/PMC6528456/]
- 22. Application of Array-Based Comparative Genomic ... [https://pmc.ncbi.nlm.nih.gov/articles/PMC1876176/]
- 23. Comparison of the diagnostic yield of aCGH and genome- ... [https://www.nature.com/articles/s41525-021-00188-7]
- 24. Next-Generation Sequencing (NGS) | Explore the technology [https://www.illumina.com/science/technology/next-generation-sequencing.html]
- 25. NGS Approaches in Clinical Diagnostics: From Workflow to ... [https://www.mdpi.com/1422-0067/26/19/9597]
- 26. Landscape of pathogenic mutations in premature ovarian ... [https://www.nature.com/articles/s41591-022-02194-3]
- 27. Genetic insights into the complexity of premature ovarian ... [https://pmc.ncbi.nlm.nih.gov/articles/PMC11295921/]
- 28. Contribution of Array-CGH and Next-Generation Sequencing [https://www.mdpi.com/2073-4425/16/3/251]
- 29. Next generation sequencing and array -based comparative ... genomic [https://e-apem.org/journal/view.php?number=676]
- 30. ( Comparative ) - Medical Clinical... | Aetna Genomic Hybridization CGH [https://www.aetna.com/cpb/medical/data/700_799/0787.html]
- 31. Next generation sequencing and array-based comparative ... [https://pmc.ncbi.nlm.nih.gov/articles/PMC5495984/]
- 32. Clinical utility of array CGH for the detection ... [https://pubmed.ncbi.nlm.nih.gov/19154522/]
- 33. Microarray — Knowledge Hub [https://www.genomicseducation.hee.nhs.uk/genotes/knowledge-hub/microarray-array-cgh/]
- 34. Array Comparative Genomic Hybridization (Array CGH) [https://www.thermofisher.com/us/en/home/life-science/gene-expression-analysis-genotyping/genotyping-genomic-profiling/genomic-profilling-acgh.html]
- 35. Development and validation of a CGH microarray for ... [https://www.nature.com/articles/gim200581]
- 36. Clinical utility of periodic reinterpretation of CNVs of uncertain ... [https://genomemedicine.biomedcentral.com/articles/10.1186/s13073-023-01191-6]
- 37. Next-generation sequencing of 500 POI patients identified ... [https://ovarianresearch.biomedcentral.com/articles/10.1186/s13048-023-01104-6]
- 38. Genetic Association and Drug Target Exploration Between ... [https://pmc.ncbi.nlm.nih.gov/articles/PMC12517199/]
- 39. Hybrid Capture-Based Next Generation Sequencing and ... [https://www.frontiersin.org/journals/microbiology/articles/10.3389/fmicb.2018.02924/full]
- 40. Targeted Next-Generation Sequencing Indicates a ... [https://pmc.ncbi.nlm.nih.gov/articles/PMC8600266/]
- 41. Next-generation sequencing of 500 POI patients identified ... [https://pmc.ncbi.nlm.nih.gov/articles/PMC9930292/]
- 42. A Case Report and Review of the Literature - PMC [https://pmc.ncbi.nlm.nih.gov/articles/PMC8622734/]
- 43. A study protocol for a nested case-control trial with ... [https://pmc.ncbi.nlm.nih.gov/articles/PMC11425121/]
- 44. Comparative Genomic Hybridization: microarray design ... [https://pmc.ncbi.nlm.nih.gov/articles/PMC2871310/]
- 45. Comparative genomic hybridization [https://en.wikipedia.org/wiki/Comparative_genomic_hybridization]
- 46. Improving diagnostic precision in primary ovarian ... [https://pmc.ncbi.nlm.nih.gov/articles/PMC10767963/]
- 47. The Development and Evaluation of Novel Patient ... [https://pmc.ncbi.nlm.nih.gov/articles/PMC11202617/]
- 48. Understanding variants of unknown significance and ... [https://pmc.ncbi.nlm.nih.gov/articles/PMC11299939/]
- 49. Article Refining the interpretation of variants of uncertain ... [https://www.sciencedirect.com/science/article/pii/S2949774424010604]
- 50. Reclassification of variants of uncertain significance by ... [https://www.frontiersin.org/journals/oncology/articles/10.3389/fonc.2025.1455509/full]
- 51. AI‐Driven Variant Annotation for Precision Oncology in Breast ... [https://pmc.ncbi.nlm.nih.gov/articles/PMC12547363/]
- 52. Selecting variants of unknown significance through ... [https://www.nature.com/articles/s41598-019-39796-w]
- 53. Case Report: Optical genome mapping enables ... [https://pmc.ncbi.nlm.nih.gov/articles/PMC12138902/]
- 54. Advances in chromosomal microarray analysis: Transforming ... [https://pmc.ncbi.nlm.nih.gov/articles/PMC11847126/]
- 55. Next-Generation Sequencing: A Review of Its Transformative ... [https://pmc.ncbi.nlm.nih.gov/articles/PMC12523276/]
- 56. Optical Genome Mapping: A New Tool for Cytogenomic ... [https://www.mdpi.com/2073-4425/16/8/924]
- 57. Evaluating genome sequencing strategies: trio, singleton, and ... [https://genomemedicine.biomedcentral.com/articles/10.1186/s13073-025-01516-7]
- 58. Low-pass whole-genome sequencing in clinical cytogenetics [https://www.nature.com/articles/gim2015199]
- 59. Diagnostic yield of 1000 trio analyses with exome and ... [https://www.frontiersin.org/journals/genetics/articles/10.3389/fgene.2025.1580879/full]
- 60. Genome-Wide Sequencing Modalities for Children with ... [https://pmc.ncbi.nlm.nih.gov/articles/PMC10047410/]
- 61. A Comparison of Tools for Copy-Number Variation ... [https://pmc.ncbi.nlm.nih.gov/articles/PMC8699073/]
- 62. Benchmarking copy number variation detection with low- ... [https://pmc.ncbi.nlm.nih.gov/articles/PMC12481693/]
- 63. Evaluation of CNV detection tools for NGS panel data in ... [https://www.nature.com/articles/s41431-020-0675-z]
- 64. Evaluation of somatic copy number variation detection by NGS ... [https://genomebiology.biomedcentral.com/articles/10.1186/s13059-024-03294-8]
- 65. Detection of copy-number variations from NGS data using ... [https://pmc.ncbi.nlm.nih.gov/articles/PMC7852510/]
- 66. NGS Approaches in Clinical Diagnostics: From Workflow to ... [https://pmc.ncbi.nlm.nih.gov/articles/PMC12524640/]
- 67. Insights on AI-Powered Genomic Analysis & Clinical ... [https://www.seqone.com/news-insights]
- 68. An artificial intelligence-assisted clinical framework to ... [https://www.sciencedirect.com/science/article/pii/S2352396424002068]
- 69. Unveiling genetic insights: Array-CGH and WES discoveries in ... [https://bmcgenomics.biomedcentral.com/articles/10.1186/s12864-024-11077-5]
- 70. Next-Generation Sequencing: A Review of Its ... [https://www.mdpi.com/2075-4418/15/19/2425]
- 71. Array Comparative Genomic Hybridization - an overview [https://www.sciencedirect.com/topics/medicine-and-dentistry/array-comparative-genomic-hybridization]
- 72. Enabling Drug Development and Personalized Medicine [https://www.cd-genomics.com/the-ngs-revolution-enabling-drug-development-and-personalized-medicine.html]
- 73. target identification and genetically stratified clinical trials [https://www.sciencedirect.com/science/article/pii/S1359644618300400]
- 74. Chromosomal Microarray Analysis 2025-07-26 [https://guidelines.carelonmedicalbenefitsmanagement.com/chromosomal-microarray-analysis-2025-07-26/]
- 75. Copy Number Variation (CNV) Calling [https://www.cancer.gov/about-nci/organization/cbiit/training/library/cnv]
- 76. Diagnostic yield of array-CGH in children with suspected ... [https://pmc.ncbi.nlm.nih.gov/articles/PMC12556180/]
- 77. Array CGH-based detection of CNV regions and their potential ... [https://bmcgenomics.biomedcentral.com/articles/10.1186/s12864-019-5552-1]
- 78. Design and validation of a clinical whole genome ... [https://www.frontiersin.org/journals/molecular-biosciences/articles/10.3389/fmolb.2025.1669085/full]
- 79. PFMG2025–integrating genomic medicine into the national ... [https://pmc.ncbi.nlm.nih.gov/articles/PMC11910791/]
- 80. Introducing SeqOne CGH Array Interpretation [https://www.seqone.com/news-insights/introducing-seqone-cgh-array-interpretation]