Independent Cohort Validation of Endometrial Biomarkers: Strategies, Challenges, and Translational Impact
The successful translation of endometrial biomarker discoveries into clinically useful tools hinges on rigorous validation in independent cohorts.
Independent Cohort Validation of Endometrial Biomarkers: Strategies, Challenges, and Translational Impact
Abstract
The successful translation of endometrial biomarker discoveries into clinically useful tools hinges on rigorous validation in independent cohorts. This article synthesizes current methodologies, challenges, and best practices for validating diagnostic and prognostic biomarkers for endometrial cancer and related disorders. We explore the critical gap between initial discovery and clinical application, examining foundational principles, advanced methodological frameworks incorporating multi-omics and artificial intelligence, troubleshooting for common pitfalls, and comparative validation approaches. For researchers and drug development professionals, this comprehensive review provides actionable insights for designing robust validation studies that withstand biological and technical variability, ultimately accelerating the development of non-invasive diagnostic and prognostic tools for improved patient management.
The Critical Imperative: Why Independent Validation is Non-Negotiable in Endometrial Biomarker Development
Endometrial cancer (EC) is the most common gynecological malignancy in developed countries, with its incidence steadily increasing due to factors such as rising obesity rates, type 2 diabetes, and aging populations [1]. Although most cases are diagnosed at an early stage with favorable outcomes, advanced or recurrent disease continues to portend a poor prognosis, with a 5-year survival rate of approximately 20% for metastatic disease [1]. The current diagnostic paradigm for endometrial cancer relies on invasive tissue sampling through endometrial biopsy or dilatation and curettage, procedures that carry inherent risks, yield insufficient tissue in some cases, and demonstrate significant interobserver and intraobserver variability in histopathological assessment [2] [1]. This diagnostic challenge is particularly pronounced in borderline clinical cases, where a substantial number of invasive procedures are performed to identify the minority of patients ultimately diagnosed with endometrial cancer [3]. These limitations underscore an pressing clinical need for validated, minimally invasive biomarkers that can reduce diagnostic delays, enhance diagnostic precision, and improve risk stratification for treatment decisions.
Current Landscape of Endometrial Cancer Biomarkers
Established Diagnostic Methods and Their Limitations
The current standard for diagnosing endometrial cancer involves invasive procedures with well-recognized limitations. Transvaginal ultrasound serves as an initial screening tool, with an endometrial thickness cutoff of 3mm in postmenopausal women demonstrating high sensitivity (97%) for ruling out EC [1]. However, when abnormal bleeding or suspicious findings are present, tissue sampling becomes necessary through either aspiration biopsy or dilatation and curettage, the latter providing a more comprehensive endometrial assessment but carrying greater invasiveness [1]. The subjective nature of histopathological evaluation introduces significant variability, while the invasive nature of these procedures creates barriers to timely diagnosis and monitoring.
Emerging Circulating Biomarker Classes
Recent research has focused on two principal classes of circulating biomarkers for endometrial cancer:
2.2.1 Extracellular Vesicle (EV)-Associated Biomarkers
Extracellular vesicles represent promising minimally invasive biomarkers due to their stability in circulation and ability to reflect the molecular composition of their parent cells [2]. A recent systematic review identified ten EV-associated biomarkers consistently differentially abundant between endometrial cancer cases and controls, with five demonstrating particularly strong diagnostic potential (Table 1) [2]. These vesicles can be isolated from various biofluids including blood, urine, and cervicovaginal fluid, offering multiple avenues for non-invasive testing [2].
2.2.2 Soluble Immune Checkpoints (sICs)
Soluble immune checkpoints represent circulating forms of membrane-bound immune regulatory molecules that are targets of immunotherapy [3]. While initial studies found that sIC levels did not differentiate endometrial cancer patients from controls, several sICs showed significant correlations with key prognostic features including mismatch repair (MMR) deficiency, lymphovascular space invasion (LVSI), and advanced disease stage [3]. This suggests their potential utility for risk stratification and immunotherapy response prediction rather than initial diagnosis.
Table 1: Promising Extracellular Vesicle-Associated Diagnostic Biomarkers for Endometrial Cancer
| Biomarker | Direction in EC | Performance Notes | Biological Fluid |
|---|---|---|---|
| miR-21-3p | Elevated | Expression in EV preparations mirrors endometrial tissue | Plasma, Serum |
| miR-26a-5p | Decreased | Expression in EV preparations mirrors endometrial tissue | Plasma, Serum |
| miR-130a-3p | Decreased | Expression in EV preparations mirrors endometrial tissue | Plasma, Serum |
| miR-139 | Decreased | Expression in EV preparations mirrors endometrial tissue | Plasma, Serum |
| miR-219a-5p | Decreased | Expression in EV preparations mirrors endometrial tissue | Plasma, Serum |
| LGALS3BP | Elevated | Galectin 3 binding protein | Plasma, Serum |
| miR-15a-5p | Elevated | Plasma, Serum |
Table 2: Soluble Immune Checkpoints with Prognostic Correlations in Endometrial Cancer
| Soluble Immune Checkpoint | Clinical Correlation | Potential Application |
|---|---|---|
| sPD-1, sPD-L1, sLAG-3 | Elevated in MMR-deficient tumors | Immunotherapy response prediction |
| sICOS, sGITR, sCD86 | Elevated in MMR-deficient tumors | Immunotherapy response prediction |
| sTIM-3, sCD27, sHVEM, sCD40 | Associated with lymphovascular space invasion | Risk stratification |
| sCD27, sCD40 | Higher in advanced (Stage IIIA+) disease | Prognostic assessment |
Critical Gaps in Biomarker Validation
Methodological Limitations in EV Research
The field of extracellular vesicle biomarker research faces significant methodological challenges that hamper clinical translation. A systematic review of EV biomarkers for endometrial cancer highlighted concerning limitations in current literature, including insufficient adherence to MISEV (Minimal Information for Studies of Extracellular Vesicles) guidelines, variability in EV isolation techniques, and lack of evidence confirming biomarker encapsulation within EVs versus surface attachment [2]. The most common isolation methods included precipitation kits (12 studies) and differential ultracentrifugation (6 studies), with only 7 of 20 studies performing comprehensive characterization of size, morphology, and protein composition [2]. This methodological heterogeneity creates challenges for comparing results across studies and establishing standardized clinical tests.
The Translational Gap in Biomarker Development
The journey from biomarker discovery to clinical implementation remains fraught with challenges, with less than 1% of published cancer biomarkers ultimately entering clinical practice [4]. This translational gap stems from several factors: over-reliance on traditional animal models with poor human correlation, lack of robust validation frameworks, inadequate reproducibility across cohorts, and failure to account for disease heterogeneity in human populations [4]. Additionally, the controlled conditions of preclinical studies often fail to replicate the genetic diversity, comorbidities, and tumor microenvironment variations present in actual patient populations [4].
Statistical and Validation Considerations
Many proposed biomarkers fail to produce clinically actionable results due to fundamental methodological flaws [5]. A statistically significant result in a between-group hypothesis test often does not translate to successful classification performance, with error rates sometimes approaching random assignment despite impressive p-values [5]. Other common pitfalls include misapplication of cross-validation techniques, failure to establish test-retest reliability, and inadequate sample sizes determined by hypothesis testing rather than classification objectives [5]. Proper biomarker evaluation must extend beyond sensitivity and specificity to include positive and negative likelihood rates, predictive values, false discovery rates, and area under the ROC curve with confidence intervals [5].
Experimental Protocols for Biomarker Validation
Protocol: Extracellular Vesicle Isolation and Biomarker Analysis
Principle: Isolate and characterize extracellular vesicles from patient biofluids for analysis of candidate biomarkers including miRNAs and proteins.
Reagents and Equipment:
- Blood collection tubes (EDTA, citrate, or serum separator tubes)
- Ultracentrifuge or commercial EV precipitation kit
- Nanoparticle Tracking Analysis (NTA) system
- Tunable Resistive Pulse Sensing (TRPS) instrument
- Electron microscope
- Western blot equipment
- CD63, CD9, CD81 antibodies for EV characterization
- RNA extraction kit compatible with small RNAs
- qRT-PCR system with TaqMan assays for target miRNAs
Procedure:
- Sample Collection and Processing: Collect blood via venipuncture after patient fasting. Process within 2 hours of collection by centrifugation at 2,000 × g for 20 minutes to obtain platelet-poor plasma or serum. Aliquot and store at -80°C [2] [3].
EV Isolation:
- Option A (Ultracentrifugation): Centrifuge plasma/serum at 10,000 × g for 30 minutes to remove cell debris. Transfer supernatant to ultracentrifuge tubes and centrifuge at 100,000 × g for 70 minutes at 4°C. Wash pellet in PBS and repeat ultracentrifugation. Resuspend final EV pellet in PBS [2].
- Option B (Precipitation): Mix biofluid with precipitation reagent according to manufacturer's protocol. Incubate overnight at 4°C, then centrifuge at 10,000 × g for 20 minutes. Resuspend EV pellet in PBS [2].
EV Characterization:
- Size and Concentration: Dilute EV preparation in filtered PBS and analyze using NTA or TRPS to determine particle size distribution and concentration [2].
- Morphology: Apply EV sample to formvar/carbon-coated grids, negative stain with uranyl acetate, and image using transmission electron microscopy [2].
- Surface Markers: Detect EV-enriched proteins (CD63, CD9, CD81, TSG101) via western blotting [2].
Biomarker Analysis:
- RNA Extraction: Isolve total RNA from EV preparation using miRNeasy or similar kit with modifications for small RNAs.
- miRNA Quantification: Convert RNA to cDNA using miRNA-specific primers. Perform qRT-PCR with TaqMan probes for target miRNAs (e.g., miR-21-3p, miR-26a-5p) and normalizers (e.g., miR-16-5p, miR-423-5p) [2].
- Protein Biomarker Analysis: Quantify EV-associated proteins (e.g., LGALS3BP) via ELISA or multiplex immunoassay.
Validation: Assess analytical performance including sensitivity, specificity, precision, and linearity. Establish reference ranges using appropriate control populations.
Protocol: Multiplex Analysis of Soluble Immune Checkpoints
Principle: Simultaneously measure multiple soluble immune checkpoints in plasma using multiplex immunoassay to identify correlations with clinicopathological features.
Reagents and Equipment:
- MagPix or Luminex system with xMAP technology
- Multiplex soluble immune checkpoint panel (e.g., 16-plex including sPD-1, sPD-L1, sLAG-3, sTIM-3, sCD27, sHVEM, sCD40)
- Biotinylated detection antibodies
- Streptavidin-PE
- Assay buffer and wash buffer
- Microplate shaker
- Magnetic microplate washer
Procedure:
- Sample Preparation: Thaw plasma samples on ice and centrifuge at 10,000 × g for 10 minutes to remove precipitates. Dilute samples 1:2-1:4 in assay buffer as determined by optimization experiments [3].
Assay Procedure:
- Add 50μL of standards, controls, and diluted samples to antibody-coated magnetic microspheres in a 96-well plate.
- Incubate for 2 hours with shaking at room temperature.
- Wash plates 3 times with wash buffer using a magnetic plate washer.
- Add 50μL of biotinylated detection antibody cocktail and incubate for 1 hour with shaking.
- Wash plates 3 times and add 50μL of streptavidin-PE. Incubate for 30 minutes with shaking.
- Wash plates 3 times and resuspend beads in 100-150μL of reading buffer.
- Analyze using MagPix/Luminex system with 50-100 events per bead region.
Data Analysis:
- Generate standard curves for each analyte using 5-parameter logistic regression.
- Calculate analyte concentrations in samples from standard curves.
- Normalize values using internal controls and sample dilution factors.
Statistical Analysis:
- Compare sIC levels between patient subgroups using non-parametric tests (Mann-Whitney U for two groups, Kruskal-Wallis for multiple groups).
- Perform robust logistic regression to assess associations with clinical parameters (MMR status, LVSI, stage) while adjusting for potential confounders [3].
- Conduct receiver operating characteristic (ROC) analysis to evaluate diagnostic/prognostic performance of individual or combined sICs.
Integrated Workflow for Biomarker Validation
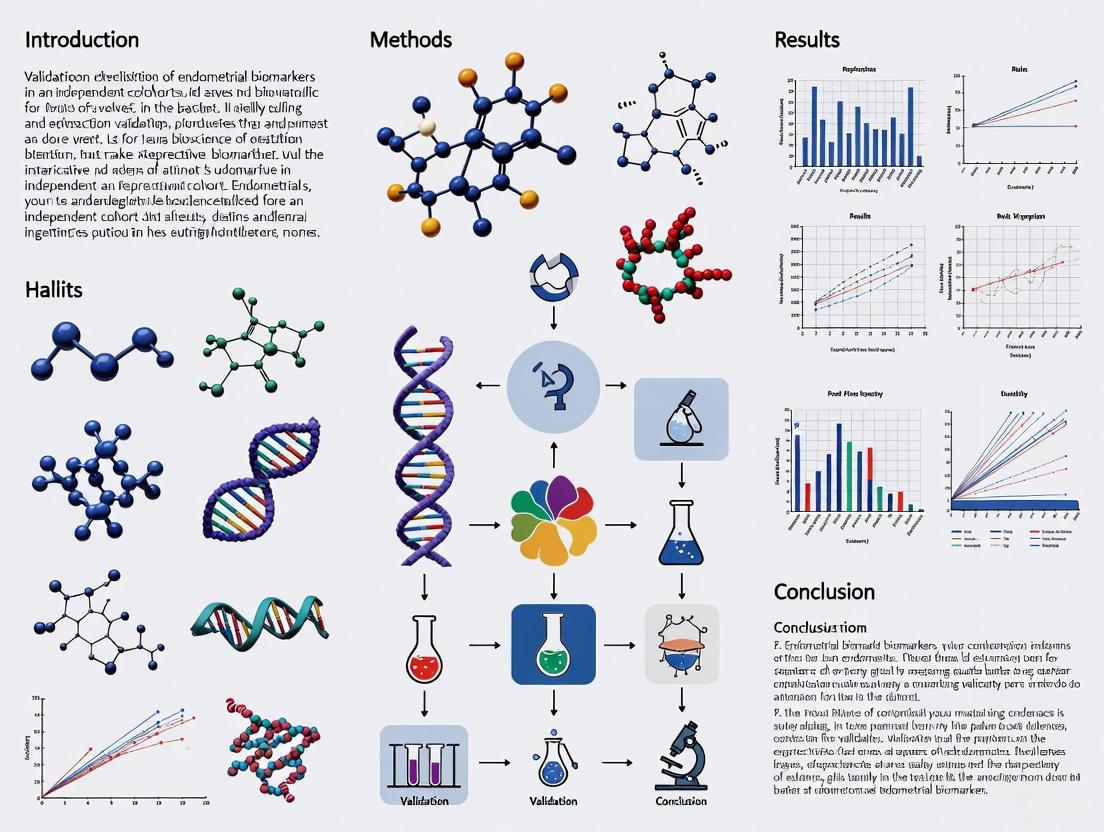
The following diagram illustrates a comprehensive workflow for the development and validation of endometrial cancer biomarkers, integrating methodologies from both EV and soluble immune checkpoint research:
Diagram 1: Comprehensive Workflow for EC Biomarker Development and Validation. This integrated approach combines EV and soluble immune checkpoint analysis for robust biomarker validation.
The Scientist's Toolkit: Essential Research Reagents and Platforms
Table 3: Essential Research Reagents and Platforms for Endometrial Cancer Biomarker Studies
| Category | Specific Product/Platform | Application in EC Biomarker Research |
|---|---|---|
| EV Isolation | ExoQuick, Total Exosome Isolation kits | Rapid precipitation of EVs from plasma/serum/urine |
| EV Isolation | Differential Ultracentrifuge | Gold-standard EV isolation via sequential centrifugation |
| EV Characterization | NanoSight NS300 (NTA) | Size distribution and concentration analysis of EVs |
| EV Characterization | Transmission Electron Microscope | Visualization of EV morphology and integrity |
| miRNA Analysis | TaqMan Advanced miRNA assays | Sensitive quantification of EV-associated miRNAs |
| Multiplex Immunoassay | Luminex xMAP/MagPix with sIC panels | Simultaneous measurement of multiple soluble immune checkpoints |
| Protein Analysis | ELISA kits (LGALS3BP, etc.) | Quantification of specific protein biomarkers in EVs or plasma |
| Biofluid Collection | PAXgene Blood cDNA tubes | Stabilization of RNA profiles in whole blood |
| Data Analysis | R/Bioconductor with mixOmics package | Multi-omics data integration and multivariate analysis |
| Validation Models | Patient-derived organoids (PDOs) | Functional validation of biomarkers in human-relevant systems |
The development of validated biomarkers for endometrial cancer represents an urgent clinical need with the potential to transform diagnostic paradigms and improve patient outcomes. Current research on extracellular vesicle-associated biomarkers and soluble immune checkpoints shows significant promise, but methodological inconsistencies and validation gaps remain substantial barriers to clinical implementation. Future studies must prioritize standardized protocols, rigorous analytical validation, and confirmation in independent cohorts to advance these biomarkers toward clinical utility. As molecular classification becomes increasingly integrated into endometrial cancer management [1], the development of robust minimally invasive biomarkers will be essential for enabling precision medicine approaches, reducing diagnostic delays, and optimizing treatment strategies for this common malignancy.
Beyond Discovery: Understanding the Validation Pipeline from Bench to Bedside
The transition of a potential biomarker from an initial discovery to a clinically validated tool is a complex, multi-stage process. This journey is particularly critical in the field of endometrial pathology, where the need for non- or minimally-invasive diagnostic and prognostic tools is rapidly growing alongside the increasing incidence of diseases like endometrial cancer (EC) and endometriosis [6]. A promising finding in a single research cohort is merely the first step; rigorous validation in independent populations is the true benchmark of clinical utility. This application note details the structured pipeline and essential methodologies for validating endometrial biomarkers, providing a framework for researchers and drug development professionals to robustly assess and advance new candidates.
The challenge in endometrial biomarker development is twofold. Firstly, for diagnostics, the goal is to replace or triage invasive procedures like hysteroscopy and endometrial biopsy, which are discomforting for patients and carry inherent risks [6]. Secondly, for prognostics, the aim is to move beyond traditional histology and staging to molecularly stratify patients, thereby avoiding over- or under-treatment [7]. The Cancer Genome Atlas (TCGA) molecular classification of EC into four groups (POLE ultramutated, MSI hypermutated, copy-number low, and copy-number high) exemplifies this shift, offering a more precise prognosis [6]. Validated biomarkers are the foundation upon which such modern, personalized treatment algorithms are built.
The Multi-Stage Biomarker Validation Pipeline
The validation of a biomarker is a phased process, designed to systematically assess its analytical performance, clinical accuracy, and ultimately, its impact on patient outcomes. The following workflow delineates the key stages from initial discovery to clinical application, with feedback mechanisms for continuous refinement.
Biomarker Validation Workflow
Quantitative Benchmarks in Validation Studies
A critical component of the validation process is the demonstration of quantitative performance metrics in well-characterized cohorts. The following table synthesizes key outcomes from recent validation studies across different types of endometrial biomarkers, illustrating the performance achievable through rigorous development.
Table 1: Performance Metrics of Endometrial Biomarkers in Validation Studies
| Biomarker / Panel | Biomarker Type | Sample Source | Performance (AUC) | Cohort Size (Case/Control) | Reference |
|---|---|---|---|---|---|
| 10-Marker Protein Panel (e.g., SPRR1B, CRNN, MMP9) | Proteomic | Urine | 0.92 | 50 EC / 54 Controls | [8] |
| Metabolic Panel (Glutamine, Glucose, Cholesterol Linoleate) | Metabolomic | Serum | 0.901 - 0.902 | 191 EC / 204 Non-EC | [9] |
| Serum Metabolic Fingerprints (SMFs) | Metabolomic | Serum | 0.957 - 0.968 | 191 EC / 204 Non-EC | [9] |
| Genomic Classifier (Endometrial Biopsy) | Transcriptomic | Endometrial Tissue | 90-100% Accuracy* | 148 Women | [10] |
*Preliminary data from a prior study requiring validation.
Experimental Protocols for Biomarker Validation
Protocol: SWATH-MS-Based Proteomic Profiling of Urine
This protocol, adapted from a study that identified a 10-marker urine panel for EC detection, outlines the steps for a robust, data-independent acquisition mass spectrometry workflow suitable for biomarker verification [8].
I. Sample Collection and Preparation
- Collection: Collect voided, self-collected urine samples in dry, sterile containers prior to gynecological examination or treatment. Centrifuge at 1,000 × g for 10 minutes at room temperature.
- Storage: Aliquot and store the supernatant at -80°C to preserve protein integrity.
- Concentration and Buffer Exchange: Thaw samples on ice. Concentrate and perform buffer exchange into 25 mM ammonium bicarbonate (ABC) using a 30 kDa molecular weight cut-off (MWCO) spin concentrator.
- Protein Quantification: Determine protein concentration using a Bradford assay.
- Digestion: Reduce disulfide bonds with 5 mM dithiothreitol (DTT) and 1% sodium deoxycholate (SDC) at 60°C for 30 minutes. Alkylate with 50 mM iodoacetamide in the dark for 30 minutes. Digest proteins with trypsin (10:1 protein:trypsin ratio) overnight at 37°C.
- Clean-up: Acidify samples with formic acid (final concentration 0.5%) to pellet SDC. Purify peptides using C18 solid-phase extraction columns.
II. Mass Spectrometric Data Acquisition (SWATH-MS)
- Instrumentation: Use a TripleTOF 6600 mass spectrometer coupled with a nanoLC system (e.g., Eksigent nanoLC 400).
- Chromatography: Load peptides onto a trap column and separate on an analytical C18 column using a 120-minute gradient between water/acetonitrile/formic acid buffers.
- SWATH Acquisition: Acquire data in SWATH mode using a variable window method (e.g., 100 windows) with collision energy equations optimized for peptide fragmentation.
III. Data Processing and Statistical Analysis
- Spectral Library Search: Convert .wiff files and search fragment ion spectra against two spectral libraries: a human plasma library (for systemic biomarkers) and a bespoke endometrial cancer cervico-vaginal fluid library (for locally derived biomarkers) using OpenSwath.
- Peptide Scoring: Score peptide matches using pyProphet within the TransProteomic Pipeline (TPP). Align runs across samples using the TRIC algorithm.
- Downstream Analysis: Perform statistical analysis using R/Bioconductor packages (e.g., SWATH2Stats, MSstats) to identify differentially abundant proteins. Employ machine learning (e.g., logistic regression) to build and evaluate multi-marker diagnostic panels.
Protocol: Validation of Transcriptomic Meta-Signatures
This protocol describes the process for establishing and validating a consensus transcriptomic signature, as demonstrated in the identification of an endometrial receptivity meta-signature [11].
I. Meta-Analysis and In Silico Validation
- Literature Curation: Perform a systematic literature review to identify studies reporting differentially expressed genes (DEGs) in the condition of interest (e.g., receptive vs. pre-receptive endometrium).
- Data Pooling: Compile raw or processed gene lists from eligible studies into a unified dataset.
- Robust Rank Aggregation (RRA): Apply the RRA method to the pooled data to identify a statistically significant meta-signature of genes that are consistently ranked at the top across all studies, correcting for study size and platform differences.
- Enrichment Analysis: Use tools like g:Profiler to identify over-represented biological processes, pathways (e.g., KEGG), and cellular components (e.g., exosomes) within the meta-signature gene set.
II. Experimental Validation via RNA-Sequencing
- Cohort Recruitment: Collect independent endometrial biopsy samples from well-phenotyped cohorts (e.g., fertile women at precisely defined cycle stages LH+2 and LH+8).
- RNA Extraction and Sequencing: Extract high-quality total RNA. Prepare sequencing libraries and perform high-throughput RNA-Seq.
- Bioinformatic Confirmation: Map sequencing reads to a reference genome and quantify gene expression. Confirm the differential expression of the meta-signature genes in the new, independent dataset.
III. Cell-Type Specific Validation
- Tissue Dissociation: Digest endometrial biopsies to create a single-cell suspension.
- Fluorescence-Activated Cell Sorting (FACS): Sort pure populations of epithelial and stromal cells using specific cell surface markers (e.g., EPCAM for epithelial cells).
- Cell-Type Specific Expression Analysis: Quantify the expression of the validated meta-signature genes in the isolated epithelial and stromal cells to identify cell-type-specific expression patterns, using qRT-PCR for final confirmation.
The Scientist's Toolkit: Essential Research Reagent Solutions
The successful validation of biomarkers relies on a suite of specialized reagents and technologies. The following table details key materials and their applications in the validation pipeline for endometrial biomarkers.
Table 2: Key Research Reagent Solutions for Biomarker Validation
| Reagent / Technology | Function in Validation | Application Example |
|---|---|---|
| Isobaric Tags (iTRAQ/TMT) | Enables multiplexed, relative and absolute quantification of proteins across multiple samples in a single MS run. | Verification of protein panels (e.g., Pyruvate Kinase, Chaperonin 10) in endometrial tissue [12]. |
| Olink Proximity Extension Assay (PEA) | High-sensitivity, high-specificity immunoassay for targeted protein quantification in complex biofluids with high throughput. | Validation of candidate protein biomarkers in plasma/serum without needing specific antibodies upfront [6]. |
| Particle-Enhanced LDI-MS (PELDI-MS) | Functionalized particles for metabolite capture and ionization, offering high salt/protein tolerance and fast analytical speed. | High-performance acquisition of serum metabolic fingerprints (SMFs) for biomarker discovery and validation [9]. |
| Reverse Phase Protein Array (RPPA) | High-throughput, targeted proteomics platform for quantifying hundreds of proteins and their post-translational modifications from minute sample amounts. | Validation of signaling pathway activation states in endometrial tumor tissues [6]. |
| Immunomagnetic Cell Sorting Kits | For the rapid and gentle isolation of specific cell types (e.g., endometrial epithelial cells) from heterogeneous tissue digests. | Enabling cell-type-specific transcriptomic and proteomic analysis to pinpoint biomarker origin [11]. |
The path from a discovery cohort to a clinically applicable biomarker is paved with rigorous, systematic validation. For endometrial biomarkers, this entails demonstrating robust analytical performance, high diagnostic or prognostic accuracy in independent populations, and a clear value proposition for improving patient care, such as enabling non-invasive detection or refining risk stratification. By adhering to structured pipelines, employing advanced multi-omics technologies, and rigorously validating findings in independent cohorts, researchers can significantly enhance the translational potential of their work, ultimately bringing reliable new tools to the bedside.
The development of robust biomarkers is paramount for advancing the precision medicine paradigm in endometrial cancer (EC), the most common gynecologic malignancy in high-income countries [13]. Despite the promising discovery of numerous candidate biomarkers, the transition from initial findings to clinically validated tools has been remarkably limited. A recent systematic review of EC risk prediction models found that of the nine models identified, most exhibited only moderate discrimination (with AUROC statistics ranging from 0.64 to 0.77), and only five underwent external validation—a critical step in establishing clinical utility [13]. This validation gap becomes even more pronounced in the context of novel biomarker classes such as extracellular vesicles, where significant concerns regarding study quality and limited adherence to consensus recommendations have imped clinical adoption [14].
The failure to adequately validate biomarkers has profound implications for EC management. When cancer is detected while confined to the uterus, patient prognosis is excellent with a five-year survival rate exceeding 95%; however, this rate plummets to just 18% when the disease metastasizes, underscoring the critical need for reliable early detection biomarkers [13]. This application note examines case studies of promising EC biomarkers that failed validation, analyzes the root causes of these failures, and provides detailed experimental protocols designed to enhance the rigor of future validation studies in independent cohort research.
Case Studies: Analysis of Failed Biomarker Validation in Endometrial Cancer
Extracellular Vesicle MicroRNA Biomarkers: Promising Discovery Versus Validation Realities
Extracellular vesicles (EVs) have emerged as promising minimally invasive biomarkers for endometrial cancer, potentially offering solutions to the challenges of invasive diagnostic procedures and interobserver variability [14]. A systematic review published in Translational Oncology in 2025 identified ten EV-associated biomarkers consistently reported as differentially abundant between EC cases and controls, suggesting their potential as diagnostic tools [14].
Table 1: Extracellular Vesicle MicroRNA Biomarkers with Inconsistent Validation
| MicroRNA Biomarker | Reported Direction in EC | Validation Status Across Studies | Key Limitations Identified |
|---|---|---|---|
| miR-21-3p | Elevated | Inconsistent detection across platforms | Variable EV isolation methods |
| miR-26a-5p | Decreased | Poor correlation with tissue expression | Uncertain cellular origin |
| miR-130a-3p | Decreased | Limited analytical validation | Questioned encapsulation within EVs |
| miR-139 | Decreased | Inconsistent performance in independent cohorts | Potential contamination |
| miR-219a-5p | Decreased | Lack of standardized normalization | Small sample sizes |
Despite initial promise, significant validation challenges have emerged for these candidates. The systematic review concluded that while miR-21-3p, miR-26a-5p, miR-130a-3p, miR-139, and miR-219a-5p appeared most promising due to expression patterns that mirrored endometrial tissue, significant concerns regarding study quality and limited adherence to consensus recommendations on EV research hampered their validation [14]. Crucially, the review found no EV-associated biomarker that was consistently reported as prognostic in more than one study, highlighting a critical validation failure in this biomarker class [14].
Polygenic Risk Score Models: Limitations in Generalizability
Another significant category of biomarker validation failures in EC involves polygenic risk scores (PRS). A systematic review of EC risk prediction models identified four models that incorporated polygenic risk scores alongside epidemiological factors [13]. While these integrated models showed potential for improving risk stratification, they demonstrated limited generalizability when applied beyond their original development populations.
Table 2: Limitations of Endometrial Cancer Risk Prediction Models in Validation Studies
| Model Characteristic | Development Phase | Validation Performance | Impact on Generalizability |
|---|---|---|---|
| Population Demographics | Predominantly White/European postmenopausal women | Reduced accuracy in non-White populations | Limits equitable application |
| Sample Size | Variable, often limited | Overestimation of risk in new cohorts | Affects calibration performance |
| Risk Factors Included | Epidemiological factors, some genetic markers | Variable discrimination (AUROC 0.64-0.77) | Moderate predictive ability |
| Validation Status | Only 5 of 9 models externally validated | Significant overestimation in some cases | Questions clinical readiness |
Most concerning was the finding that these models were primarily developed in datasets comprising postmenopausal women of White or European ancestry from Western countries, with limited representation of diverse racial and ethnic groups [13]. This lack of diversity in development cohorts fundamentally limits the generalizability of these models, particularly for non-White populations who experience both rising incidence rates and disproportionately high mortality from endometrial cancer [13].
Root Cause Analysis: Systemic Challenges in Biomarker Validation
Methodological and Analytical Limitations
The failure of promising EC biomarkers often stems from fundamental methodological weaknesses in the validation process. The heterogeneity of cancer biology presents a primary challenge, as EC comprises diverse molecular subtypes with distinct genetic characteristics that may not be equally represented in validation cohorts [15]. This biological diversity is frequently compounded by technical variability, particularly in emerging biomarker classes like extracellular vesicles, where inconsistencies in isolation methods, characterization techniques, and analytical platforms generate irreproducible results [14].
The absence of standardized experimental protocols represents another critical failure point. Studies investigating EV-associated biomarkers for EC have demonstrated limited adherence to international consensus recommendations on EV research, raising questions about the validity of reported findings [14]. This technical inconsistency is particularly problematic for biomarkers requiring specialized handling, such as microRNAs, whose measurement can be influenced by numerous pre-analytical variables including sample collection methods, processing delays, and storage conditions.
Study Design and Population Considerations
Beyond technical challenges, structural weaknesses in study design significantly contribute to validation failures. Many biomarker studies utilize inadequate sample sizes that lack statistical power to detect clinically relevant effects or to evaluate performance across relevant patient subgroups [13] [14]. This problem is exacerbated by the frequent use of convenience samples rather than prospectively collected specimens from well-characterized cohorts that accurately represent the target population [16].
The systematic review of EC risk prediction models highlighted another critical design flaw: the limited racial and ethnic diversity in development datasets [13]. Models developed predominantly in populations of European ancestry frequently demonstrate reduced performance when applied to other demographic groups, perpetuating healthcare disparities and limiting the equitable application of biomarker-based strategies. Additionally, many studies fail to account for key clinical variables such as hysterectomy status, hormonal exposures, or socioeconomic factors that may influence biomarker performance [13].
Enhanced Experimental Protocols for Rigorous Biomarker Validation
Protocol for Analytical Validation of Extracellular Vesicle Biomarkers
Objective: To establish standardized methodology for analytical validation of extracellular vesicle-associated biomarkers in endometrial cancer with sufficient rigor to support clinical translation.
Materials and Equipment:
- Blood collection tubes (cfDNA and EV preservation tubes)
- Ultracentrifuge or size-exclusion chromatography system
- Nanoparticle tracking analysis instrument
- Transmission electron microscope
- RNA extraction kit with spike-in controls
- qRT-PCR system or digital PCR platform
- Protein quantification assay
- Multiplex immunoassay platform
Procedural Workflow:
Sample Collection and Processing:
- Collect blood samples from pre-specified patient cohorts using EV-preserving collection tubes
- Process samples within 2 hours of collection using standardized centrifugation protocols
- Aliquot plasma samples and store at -80°C with limited freeze-thaw cycles
- Document detailed clinical metadata including patient characteristics, menstrual status, and concomitant medications
EV Isolation and Characterization:
- Isolate EVs using consistent methodology (ultracentrifugation or size-exclusion chromatography)
- Quantify EV particle concentration and size distribution using nanoparticle tracking analysis
- Confirm EV identity through transmission electron microscopy and Western blotting for characteristic markers (CD9, CD63, CD81)
- Assess sample purity through absence of apoptotic bodies and protein aggregates
Biomarker Analysis:
- Extract RNA with inclusion of spike-in synthetic oligonucleotides for normalization
- Quantify candidate biomarkers using qRT-PCR with standardized assays
- Analyze protein biomarkers via multiplex immunoassays with appropriate controls
- Include internal quality control samples across all batches
Validation Criteria:
- Analytical sensitivity: Determine limit of detection and quantification for each biomarker
- Precision: Evaluate intra-assay and inter-assay coefficients of variation (<15%)
- Linearity: Demonstrate proportional response across clinically relevant range
- Stability: Assess biomarker integrity under various storage conditions
Protocol for Clinical Validation in Independent Cohorts
Objective: To establish rigorous methodology for clinical validation of endometrial cancer biomarkers in independent, multi-center cohorts with appropriate statistical power and demographic diversity.
Materials and Equipment:
- Access to diverse, multi-center patient cohorts
- Standardized clinical data collection forms
- Sample tracking database with audit capability
- Statistical analysis software (R, Python, or SAS)
- Biomarker assay platform validated under CLIA guidelines
Procedural Workflow:
Cohort Establishment:
- Define inclusion/exclusion criteria prospectively, including age, menopausal status, BMI, and histological confirmation
- Establish independent validation cohorts with pre-specified sample size calculated based on target confidence intervals for AUC or hazard ratios
- Ensure demographic diversity with targets for racial and ethnic composition that reflect population-level EC incidence
- Collect comprehensive clinical data including established risk factors (obesity, diabetes, hormonal exposures) and tumor characteristics
Blinded Analysis:
- Perform biomarker measurements blinded to clinical outcomes and patient characteristics
- Utilize standardized operating procedures across participating sites
- Include quality control samples with pre-established acceptance criteria
- Document all protocol deviations and analytic failures
Statistical Validation:
- Assess discrimination using area under the receiver operating characteristic curve (AUC) with 95% confidence intervals
- Evaluate calibration using Hosmer-Lemeshow goodness-of-fit test and calibration plots
- Perform decision curve analysis to evaluate clinical utility across risk thresholds
- Conduct subgroup analyses to evaluate performance across racial/ethnic groups, BMI categories, and molecular subtypes
Validation Endpoints:
- Primary: Diagnostic accuracy (sensitivity, specificity) with pre-specified performance targets
- Secondary: Association with clinical outcomes (progression-free survival, overall survival)
- Exploratory: Performance in relevant clinical subgroups and integration with existing risk stratification tools
The Scientist's Toolkit: Essential Research Reagent Solutions
Table 3: Essential Research Reagents for Endometrial Cancer Biomarker Validation
| Reagent Category | Specific Examples | Research Application | Validation Considerations |
|---|---|---|---|
| EV Isolation Kits | Size-exclusion chromatography columns, Polymer-based precipitation kits | Isolate EVs from biofluids with minimal co-isolation of contaminants | Compare multiple methods; assess yield/purity trade-offs |
| RNA Stabilization Reagents | RNAlater, PAXgene Blood RNA tubes | Preserve RNA integrity in blood and tissue samples | Evaluate impact on downstream analyses; optimize storage conditions |
| qRT-PCR Assays | TaqMan miRNA assays, SYBR Green master mixes | Quantify miRNA and mRNA biomarker candidates | Determine efficiency, sensitivity, and dynamic range |
| Reference Standards | Synthetic miRNA oligonucleotides, EV reference materials | Normalize measurements and control for technical variation | Assess commutability with native biomarkers |
| Multiplex Immunoassay Panels | Luminex arrays, Olink panels | Measure protein biomarkers in limited sample volumes | Verify cross-reactivity and parallelism with reference methods |
| Biobanking Supplies | Cryogenic vials, temperature monitoring systems | Maintain sample integrity in long-term storage | Implement inventory management with full audit trail |
The repeated failure of promising endometrial cancer biomarkers during validation represents both a challenge and an opportunity for the research community. By learning from these failures and implementing more rigorous validation frameworks, researchers can significantly improve the translation of biomarker discoveries into clinically useful tools. The systematic review of EC risk prediction models clearly demonstrates that future research must focus on broadening participant diversity and incorporating previously overlooked risk factors, such as hormonal intrauterine device use, hysterectomy status, environmental exposures, and socioeconomic status [13].
The development of dynamic models that can incorporate new risk factors and account for various forms of the disease will be essential for improving clinical relevance [13]. Furthermore, for novel biomarker classes like extracellular vesicles, adherence to consensus recommendations and demonstration of analytical rigor must become standard practice rather than the exception [14]. Through the implementation of the detailed protocols and methodological considerations outlined in this application note, researchers can overcome the historical challenges that have plagued endometrial cancer biomarker development and ultimately deliver on the promise of personalized risk assessment and early detection for this prevalent malignancy.
In the field of endometrial cancer research, the validation of novel biomarkers in independent cohorts requires rigorous statistical evaluation to assess their true clinical value. Sensitivity, specificity, and the Area Under the Curve (AUC) of the Receiver Operating Characteristic (ROC) curve serve as fundamental metrics for determining biomarker performance. These metrics provide quantitative measures of a biomarker's ability to correctly classify patients with and without the disease, enabling researchers to evaluate diagnostic accuracy, prognostic capability, and predictive power. Within the context of endometrial cancer biomarker validation, these metrics help translate laboratory discoveries into clinically useful tools that can improve early detection, risk stratification, and treatment selection, ultimately enhancing patient outcomes.
The clinical utility of a biomarker extends beyond its statistical performance, encompassing its practical value in informing medical decisions within specific clinical contexts. For endometrial cancer, which demonstrates rising incidence rates globally, the integration of molecular classification with traditional histopathological assessment has highlighted the critical importance of robust biomarker validation. The Cancer Genome Atlas (TCGA) research has redefined endometrial cancer into four distinct molecular classes with significant prognostic implications, creating an urgent need for validated biomarkers that can accurately identify these subgroups in clinical practice [1] [17].
Defining the Key Metrics
Sensitivity
Sensitivity, also called the true positive rate, measures the proportion of actual positive cases that are correctly identified by the biomarker test. It is calculated as the number of true positives divided by the sum of true positives and false negatives. In mathematical terms, Sensitivity = TP / (TP + FN), where TP represents true positives and FN represents false negatives. A highly sensitive test is particularly valuable for ruling out disease when the result is negative, making it crucial for screening applications where missing actual cases (false negatives) could have serious consequences.
In the context of endometrial cancer biomarker development, high sensitivity ensures that few cases of cancer go undetected. For example, in a study evaluating cell-free DNA (cfDNA) fragmentomics for endometrial cancer detection, the assay demonstrated sensitivities of 74.4%, 85.7%, 75%, and 75% across stages I-IV respectively, indicating a consistent ability to detect endometrial cancer across different disease stages [18].
Specificity
Specificity measures the proportion of actual negative cases that are correctly identified by the biomarker test. It is calculated as the number of true negatives divided by the sum of true negatives and false positives. Specifically, Specificity = TN / (TN + FP), where TN represents true negatives and FP represents false positives. A highly specific test is valuable for confirming disease presence when the result is positive, minimizing false alarms that could lead to unnecessary invasive procedures or treatments.
In endometrial cancer biomarker validation, high specificity is essential to avoid misdiagnosing benign conditions as malignant. For instance, in the previously mentioned cfDNA fragmentomics study, the assay achieved a specificity of 96.8% in an independent test cohort, demonstrating excellent ability to distinguish endometrial cancer patients from healthy controls [18]. This high specificity reduces the risk of unnecessary invasive procedures for women without cancer.
Area Under the Curve (AUC)
The Area Under the Receiver Operating Characteristic Curve (AUC-ROC) provides an aggregate measure of biomarker performance across all possible classification thresholds. The ROC curve plots the true positive rate (sensitivity) against the false positive rate (1-specificity) at various threshold settings. The AUC value ranges from 0 to 1, where 0.5 represents a test with no discriminative ability (equivalent to random chance) and 1.0 represents a perfect test.
AUC values are typically interpreted as follows: 0.9-1.0 = excellent; 0.8-0.9 = good; 0.7-0.8 = fair; 0.6-0.7 = poor; and 0.5-0.6 = fail. In endometrial cancer research, the cfDNA fragmentomics assay achieved an AUC of 0.96 for early cancer detection, indicating outstanding discriminatory power [18]. The same study reported moderate performance for clinicopathological subtyping, with AUCs of 0.72 for staging, 0.73 for histological subtypes, and 0.77 for microsatellite instability status prediction [18].
Relationship Between Metrics
Table 1: Interrelationship of Key Validation Metrics
| Metric | Definition | Clinical Interpretation | Optimal Scenario |
|---|---|---|---|
| Sensitivity | Proportion of true positives correctly identified | Ability to rule out disease when negative | High value needed for screening |
| Specificity | Proportion of true negatives correctly identified | Ability to rule in disease when positive | High value needed for confirmation |
| AUC | Overall performance across all thresholds | Aggregate classification accuracy | Higher values indicate better overall performance |
These metrics exhibit an inverse relationship in practice; increasing sensitivity typically decreases specificity, and vice versa. The selection of an optimal cutoff threshold depends on the clinical context and the relative consequences of false positives versus false negatives. For endometrial cancer screening, higher sensitivity might be preferred to minimize missed cases, while for confirming diagnosis before aggressive treatment, higher specificity might be prioritized to avoid overtreatment.
Experimental Protocols for Biomarker Validation
Protocol 1: Validation of cfDNA Fragmentomics Biomarkers
Objective: To validate the performance of cell-free DNA (cfDNA) fragmentomics as a liquid biopsy assay for endometrial cancer detection in an independent cohort.
Materials and Reagents:
- EDTA blood collection tubes
- QIAamp Circulating Nucleic Acid Kit (Qiagen)
- Qubit dsDNA HS Assay Kit (Thermo Fisher Scientific)
- KAPA Hyper Prep Kit (KAPA Biosystems)
- NovaSeq platform (Illumina) for sequencing
- Trimmomatic software for sequence read refinement
- Picard toolkit for PCR duplicate removal
Methodology:
- Participant Recruitment: Recruit a minimum of 120 endometrial cancer patients and 120 healthy volunteers as a training cohort, with an independent test cohort of 62 patients and 62 controls [18].
- Sample Collection: Collect 10 mL of peripheral blood in EDTA tubes followed by centrifugation at 16,000× g for 10 minutes for plasma extraction within 4 hours of blood collection.
- Plasma Storage: Store plasma samples at -80°C before shipment on dry ice to the testing laboratory.
- cfDNA Extraction: Extract cfDNA from plasma using the QIAamp Circulating Nucleic Acid Kit according to manufacturer's guidelines.
- Library Preparation: Use 5-10 ng of cfDNA for whole-genome sequencing library preparation employing DNA end repair, A-tailing, and adapter ligation with the KAPA Hyper Prep Kit.
- Sequencing: Perform paired-end sequencing on the NovaSeq platform.
- Quality Control: Implement quality assurance steps including sequence read refinement with Trimmomatic and removal of PCR duplicates using Picard toolkit.
- Data Analysis: Analyze five distinct fragmentomic features using low-pass whole-genome sequencing data.
- Model Building: Develop ensemble models integrating four different machine learning algorithms for cancer detection, subtyping, and recurrence prediction.
- Performance Validation: Assess final model performance in the independent test cohort using sensitivity, specificity, and AUC metrics.
Figure 1: cfDNA Fragmentomics Validation Workflow
Protocol 2: Tissue-Based Molecular Classification Validation
Objective: To validate the molecular classification of endometrial cancer into four TCGA-based subgroups using a stepwise algorithmic approach in an independent cohort.
Materials and Reagents:
- Formalin-fixed paraffin-embedded (FFPE) tissue blocks
- Antibody panels for immunohistochemistry (MLH1, PMS2, MSH2, MSH6, p53)
- Equipment for DNA extraction from FFPE tissue
- Targeted DNA sequencing platform for POLE exonuclease domain
- Methylation-specific PCR reagents for MLH1 promoter methylation analysis
- HER2 testing reagents (IHC with in situ hybridization confirmation)
- Estrogen receptor (ER) and progesterone receptor (PR) detection kits
Methodology:
- Tissue Processing: Confirm histology and grade on endometrial biopsy or surgical specimen tissue sections.
- MMR Protein Immunohistochemistry: Perform immunohistochemistry for four mismatch repair proteins (MLH1, PMS2, MSH2, MSH6) to identify MMR-deficient tumors [17].
- MLH1 Methylation Analysis: For cases showing loss of MLH1/PMS2 expression, perform reflex MLH1 promoter methylation testing to distinguish somatic from germline deficiency.
- p53 Immunohistochemistry: Perform p53 IHC interpreted with established patterns (abnormal: strong diffuse overexpression, complete absence, or aberrant cytoplasmic staining) [17].
- POLE Sequencing: Sequence the POLE exonuclease domain via targeted DNA sequencing, focusing on pathogenic variants in known hotspot locations [17].
- Molecular Classification: Assign tumors to one of four molecular classes based on the integrated results:
- POLE-ultramutated (POLEmut)
- Mismatch repair deficient (MMRd)
- p53 abnormal (p53abn)
- No specific molecular profile (NSMP)
- Additional Biomarker Testing: Perform HER2 testing in serous and high-grade endometrioid tumors, and assess ER/PR status in endometrioid tumors, particularly in advanced or recurrent disease [17].
- Clinical Correlation: Validate the prognostic significance of molecular classification by assessing recurrence-free and overall survival in the independent cohort.
Figure 2: Molecular Classification Validation Algorithm
Protocol 3: Extracellular Vesicle Biomarker Validation
Objective: To validate extracellular vesicle (EV)-associated biomarkers for endometrial cancer diagnosis in an independent cohort.
Materials and Reagents:
- Ultracentrifugation equipment or commercial EV isolation kits
- Transmission electron microscopy materials for EV characterization
- Nanoparticle tracking analysis system
- Western blot equipment for EV marker detection (CD63, CD81, CD9)
- RNA extraction kits
- Quantitative reverse transcription PCR (qRT-PCR) reagents
- Platforms for miRNA profiling (microarray or next-generation sequencing)
Methodology:
- Sample Collection: Collect plasma or serum from endometrial cancer patients and controls.
- EV Isolation: Isolate extracellular vesicles using ultracentrifugation or commercial isolation kits following MISEV guidelines.
- EV Characterization: Characterize EVs by size and concentration using nanoparticle tracking analysis and confirm identity by transmission electron microscopy and Western blotting for EV markers (CD63, CD81, CD9).
- RNA Extraction: Extract RNA from EV preparations using appropriate kits.
- Biomarker Analysis: Analyze promising EV-associated biomarkers (LGALS3BP, miR-15a-5p, miR-21-3p, miR-26a-5p, miR-130a-3p, miR-139, miR-219a-5p, miR-222-3p, miR-885) using qRT-PCR [14].
- Differential Expression Assessment: Compare biomarker levels between endometrial cancer cases and controls.
- Validation: Confirm that EV-associated biomarker expression reflects corresponding tissue expression, particularly for miR-21-3p, miR-26a-5p, miR-130a-3p, miR-139, and miR-219a-5p, which show the most consistent tissue-EV correlation [14].
- Performance Calculation: Calculate sensitivity, specificity, and AUC values for each biomarker in the independent validation cohort.
Performance Metrics of Validated Endometrial Cancer Biomarkers
Table 2: Performance Metrics of Endometrial Cancer Biomarkers in Independent Cohorts
| Biomarker Type | Application | Sensitivity | Specificity | AUC | Cohort Details |
|---|---|---|---|---|---|
| cfDNA Fragmentomics | EC Detection | 75.8% | 96.8% | 0.96 | Independent test cohort: 62 EC, 62 controls [18] |
| cfDNA Fragmentomics | Stage I EC Detection | 74.4% | - | - | Subset analysis [18] |
| cfDNA Fragmentomics | Histological Subtyping | - | - | 0.73 | Prediction of histological subtypes [18] |
| cfDNA Fragmentomics | MSI Status Prediction | - | - | 0.77 | Microsatellite instability status [18] |
| AI Digital Biomarkers | Alzheimer's Detection (Reference) | - | - | 0.887 | Average of 21 models for reference [19] |
The performance metrics demonstrate that cfDNA fragmentomics shows excellent diagnostic accuracy for endometrial cancer detection overall, with consistent sensitivity across disease stages. However, its performance is more moderate for predicting specific clinicopathological features, highlighting the differential utility of biomarkers for various clinical applications.
The Scientist's Toolkit: Essential Research Reagents
Table 3: Essential Research Reagents for Endometrial Cancer Biomarker Validation
| Reagent/Kit | Manufacturer | Function in Validation |
|---|---|---|
| QIAamp Circulating Nucleic Acid Kit | Qiagen | Extraction of high-quality cfDNA from plasma samples [18] |
| KAPA Hyper Prep Kit | KAPA Biosystems | Whole-genome sequencing library preparation from low-input cfDNA [18] |
| NovaSeq Platform | Illumina | High-throughput sequencing for fragmentomic analysis [18] |
| MMR IHC Antibody Panel | Various | Detection of MLH1, PMS2, MSH2, MSH6 protein expression [17] |
| p53 IHC Antibodies | Various | Identification of abnormal p53 expression patterns [17] |
| POLE Sequencing Panel | Various | Targeted sequencing of POLE exonuclease domain [17] |
| EV Isolation Kits | Various | Isolation of extracellular vesicles from biofluids [14] |
| qRT-PCR Reagents | Various | Quantification of miRNA and other RNA biomarkers [14] |
Clinical Utility and Implementation
The clinical utility of validated biomarkers extends beyond their statistical performance to their practical impact on patient management and outcomes. In endometrial cancer, validated biomarkers inform critical clinical decisions across the disease spectrum:
Diagnostic Utility: High-performing biomarkers like cfDNA fragmentomics (AUC 0.96) offer potential for non-invasive detection, particularly valuable for high-risk patients who require regular monitoring [18]. The consistent sensitivity across disease stages (74.4%-85.7%) suggests clinical usefulness even for early-stage detection.
Molecular Classification Utility: The four molecular subgroups (POLEmut, MMRd, p53abn, NSMP) carry distinct prognostic implications that guide adjuvant treatment decisions [17]. POLE-mutated tumors demonstrate excellent prognosis despite high-grade morphology, enabling treatment de-escalation, while p53abn tumors warrant more aggressive therapy [17].
Predictive Utility: MMRd/MSI-H status predicts response to PD-1-based immunotherapy, creating a robust biomarker-treatment relationship that directly impacts therapeutic selection [17]. HER2 amplification in serous carcinomas identifies patients who may benefit from HER2-directed therapy [17].
Prognostic Utility: cfDNA fragmentomics has demonstrated ability to predict recurrence-free survival, identifying high-risk patients with hazard ratios of 8.6 (P < 0.001) [18]. When combined with similarity network fusion clustering, the risk stratification further improves (HR 10.1, P < 0.0001) [18].
The successful translation of validated biomarkers into clinical practice requires consideration of practical implementation factors, including cost-effectiveness, accessibility of testing platforms, standardization of protocols, and integration into existing clinical pathways. International guidelines now recommend molecular classification for all endometrial cancers, reflecting the established clinical utility of these validated biomarkers [1]. As biomarker research advances, continuous validation in independent cohorts remains essential to confirm performance and establish their definitive role in improving endometrial cancer care.
The pursuit of robust, non-invasive biomarkers for endometrial cancer (EC) represents a critical focus in gynecological oncology. While the promise of biomarkers for improving diagnosis, prognosis, and prediction of treatment response is significant, the path to clinical translation is fraught with challenges. Among these, biological and technical variability constitute major hurdles, often undermining the validity and generalizability of research findings. This Application Note examines the sources and impacts of this variability, framed within the essential context of validating endometrial biomarkers in independent cohort research. It provides detailed protocols and analytical frameworks designed to help researchers, scientists, and drug development professionals design more rigorous and reproducible studies.
Quantitative Evidence of Variability in Endometrial Biomarker Studies
The impact of pre-analytical and biological factors is not merely theoretical but is quantitatively demonstrated in empirical studies. The tables below summarize key evidence on technical reproducibility and biological confounding.
Table 1: Impact of Technical and Biological Variability on Biomarker Performance
| Study Focus | Cohort Details | Key Finding on Variability | Impact on Biomarker Performance |
|---|---|---|---|
| Technical Verification of Plasma Biomarkers [20] | Technical verification (n=136) & independent validation (n=256) cohorts. | Previously reported 4-biomarker panel (CA-125, VEGF, Annexin V, glycodelin/sICAM-1) showed low performance upon retesting. | CA-125 was the only marker retained in new models across verification and validation studies, highlighting assay and cohort variability. |
| Menstrual Cycle Bias in Endometrial Transcriptomics [21] | Analysis of 12 public gene expression studies (GEO) on endometrial disorders. | An average of 44.2% more differentially expressed genes (DEGs) were identified after correcting for menstrual cycle phase bias. | Menstrual cycle progression can mask true pathological molecular signatures, leading to underpowered and non-reproducible biomarker discovery. |
| Extracellular Vesicle (EV) Biomarker Research [2] | Systematic review of 23 studies on EV biomarkers in EC. | Significant concerns regarding study quality and limited adherence to consensus recommendations (e.g., MISEV guidelines) on EV research. | Lack of standardized methods creates substantial technical variability, complicating the interpretation and validation of proposed EV biomarkers. |
Table 2: Key Sources of Variability in Endometrial Biomarker Research
| Variability Category | Specific Source | Documented Impact |
|---|---|---|
| Pre-analytical & Technical | Blood sample processing protocols [20] | Differences in centrifugation, time-to-processing, and storage can alter analyte levels. |
| EV isolation methods [2] | Use of different techniques (e.g., precipitation vs. ultracentrifugation) yields heterogenous vesicle populations, affecting downstream analysis. | |
| Immunoassay platform and kit lot [20] | Substantial differences in analyte levels can be found with different manufacturers or kit lots. | |
| Biological | Menstrual Cycle Phase [21] | Endometrial gene expression varies profoundly throughout the cycle, acting as a major confounder in case-control studies. |
| Tumor Molecular Heterogeneity [22] [23] | EC comprises distinct molecular subtypes (POLEmut, MMRd, p53abn, NSMP) with different biologies; failing to stratify leads to biased results. | |
| Biofluid Source [2] [24] | Biomarker levels and compositions differ between blood (plasma/serum), urine, cervicovaginal fluid, and uterine lavage. |
Protocols for Mitigating Variability in Biomarker Studies
Protocol: Correction of Menstrual Cycle Bias in Endometrial Transcriptomic Studies
Application: Unmasking true disease-associated gene expression signals in endometrial tissue biopsies by accounting for the powerful confounder of menstrual cycle timing.
Background: The human endometrium is a dynamic tissue whose gene expression is profoundly influenced by hormonal fluctuations during the menstrual cycle [21]. In case-control studies, an imbalance in the distribution of biopsy timing between groups can lead to the identification of biomarkers related to cycle progression rather than the pathology itself.
Materials:
- RNA extracted from endometrial biopsies.
- High-quality clinical metadata, including the cycle phase (e.g., proliferative, early-secretory, mid-secretory) for each sample.
- Microarray or RNA-Seq gene expression data.
Methodology:
- Sample Collection and Phenotyping: Accurately record the menstrual cycle phase for every endometrial biopsy collected. Adhere to standardized histological dating criteria (e.g., Noyes criteria) or molecular dating tools to ensure consistency [21].
- Data Pre-processing: Download raw gene expression data. Perform standard normalization procedures (e.g., quantile normalization for microarrays, TMM for RNA-Seq) to remove technical artifacts between samples.
- Exploratory Analysis: Conduct a Principal Component Analysis (PCA) to visualize the data. The menstrual cycle effect will often be a primary source of variation, visible as clustering of samples by phase.
- Bias Correction using Linear Models: Use the
removeBatchEffectfunction from thelimmaR package (or an equivalent computational method) to statistically remove the variation in gene expression attributable to the menstrual cycle phase. The design matrix must be specified to preserve the condition of interest (e.g., disease vs. control). - Differential Expression Analysis: Perform the case versus control differential expression analysis on the corrected data using standard statistical models (e.g., in the
limmapackage). Compare the results with an uncorrected analysis to demonstrate the unmasking of novel candidate genes.
Validation: The success of the correction is evidenced by a significant increase in the number of robust, differentially expressed genes specific to the pathology and improved overlap with independent datasets [21].
Diagram 1: Workflow for correcting menstrual cycle bias in transcriptomic studies.
Protocol: Standardized Workflow for Plasma-Based Soluble Immune Checkpoint Analysis
Application: Reproducible quantification of soluble immune checkpoints (sICs) in plasma for prognostic and predictive biomarker discovery in endometrial cancer.
Background: Soluble forms of immune checkpoint proteins (e.g., sPD-1, sPD-L1, sLAG-3) are promising minimally invasive biomarkers. Their levels can be influenced by pre-analytical variables and biological factors like BMI, requiring strict standardization [3].
Materials:
- Blood Collection Tubes: EDTA tubes for plasma separation.
- Multiplex Immunoassay: Validated multiplex assay (e.g., Luminex xMAP, Ella) capable of simultaneously quantifying multiple sICs.
- Matched Controls: Control participants matched to EC patients based on age and BMI to minimize confounding [3].
Methodology:
- Patient Preparation and Matching: Enroll patients and controls following approved ethical guidelines. Ensure the control group is matched for age and BMI. Participants should be fasted for >8 hours before blood collection [3].
- Standardized Blood Collection and Processing: Collect peripheral venous blood in EDTA tubes. Process samples within a strict time window (e.g., ≤1 hour from collection). Centrifuge at specified conditions (e.g., 1400 g for 10 minutes at 4°C). Aliquot plasma immediately and store at -80°C until analysis [20] [3].
- Analyte Quantification: Use a fluorescence-based multiplex immunoassay according to the manufacturer's protocol. Include appropriate standards and controls on each plate. Use the same assay kit lot for a given study cohort to minimize technical variability [20] [3].
- Data Analysis with Robust Regression: Analyze sIC concentrations using non-parametric statistical tests (e.g., Mann-Whitney U test) due to often non-normal distributions. Use robust logistic regression models to associate sIC levels with clinicopathological features (e.g., MMR status, LVSI, stage) while controlling for potential confounders [3].
Validation: Promising sICs should be validated in a larger, independent patient cohort to confirm associations with key features like MMR deficiency or advanced stage [3].
The Scientist's Toolkit: Essential Research Reagent Solutions
Table 3: Key Reagents and Materials for Endometrial Biomarker Research
| Item | Function/Application | Example & Consideration |
|---|---|---|
| EDTA Plasma Tubes | Standardized blood collection for soluble analyte stability. | Use strict SOPs for time-to-processing and centrifugation to minimize pre-analytical variation [20] [3]. |
| Multiplex Immunoassay Kits | Simultaneous quantification of multiple protein biomarkers (e.g., sICs, cytokines). | Kits from providers like Luminex or Meso Scale Discovery. Lot-to-lot variability must be monitored [20] [3]. |
| EV Isolation Kits | Enrichment of extracellular vesicles from biofluids for content analysis. | Commercial precipitation kits or size-exclusion chromatography. Method choice significantly impacts yield and purity; MISEV guidelines should be followed [2]. |
| RNA Stabilization Reagents | Preservation of RNA integrity from tissue biopsies or liquid biopsies. | Ensures high-quality input material for transcriptomic studies (microarrays, RNA-Seq) [21]. |
| IHC Antibody Panels | Tissue-based protein detection for molecular classification. | Essential for MMR (MLH1, PMS2, MSH2, MSH6) and p53 status determination on FFPE tissue [23]. |
| Next-Generation Sequencing Panels | Comprehensive genomic profiling from tissue or liquid biopsies. | Targeted panels can assess POLE status, TMB, MSI, and specific mutations (e.g., TP53, CTNNB1) in a single assay [23]. |
Diagram 2: Core analytical pathways for endometrial biomarker discovery.
Biological and technical variability are not minor complications but central challenges that must be systematically addressed to advance the field of endometrial biomarker research. As detailed in this Application Note, successful validation of biomarkers in independent cohorts hinges on rigorous experimental design, standardized protocols, and statistical correction for confounding factors. By adopting the detailed methodologies and frameworks presented herein—from controlling for menstrual cycle effects to standardizing liquid biopsy protocols—researchers can enhance the robustness, reproducibility, and ultimately, the clinical translatability of their biomarker discoveries.
Advanced Methodological Frameworks: Designing Robust Validation Studies for Endometrial Biomarkers
The validation of endometrial biomarkers in independent cohort research represents a fundamental challenge in translational gynecology. Effective cohort selection strategies directly determine whether promising diagnostic or prognostic biomarkers can transition from research findings to clinically applicable tools. In endometrial cancer (EC) and endometriosis research, the complex molecular heterogeneity of these conditions necessitates meticulous cohort design to ensure findings are both statistically valid and clinically relevant. The failure to adequately address technical, biological, and demographic variability during cohort selection remains a primary reason many proposed biomarkers fail to achieve clinical implementation [20].
This protocol outlines comprehensive cohort selection strategies to guide researchers in constructing representative patient populations for endometrial biomarker validation studies. By addressing key considerations across the validation pipeline—from technical verification to independent clinical validation—these guidelines aim to enhance the reliability, generalizability, and clinical utility of endometrial biomarker research.
Comprehensive Cohort Selection Framework
Core Cohort Types in the Validation Pipeline
Table 1: Essential Cohort Types for Endometrial Biomarker Validation
| Cohort Type | Primary Purpose | Key Design Considerations | Typical Size Guidelines |
|---|---|---|---|
| Technical Verification | Assess assay reproducibility and technical variability | Subset of original discovery cohort; analysis in different laboratories; partially different immunological assays | ~100-150 patients [20] |
| Independent Validation | Evaluate performance in biologically distinct population | Fully independent patient cohort; different clinical sites; standardized collection protocols | ~250-300 patients [20] |
| Population-Based Validation | Test generalizability across diverse healthcare settings | Multiple clinical sites; broad inclusion criteria; minimal exclusions | 450+ patients [25] |
| Specialized Phenotype Cohorts | Address specific clinical questions | Focus on particular subtypes (e.g., US-negative endometriosis, molecular EC subtypes) | Variable based on phenotype prevalence |
Quantitative Considerations for Cohort Composition
Table 2: Quantitative Parameters for Cohort Design in Endometrial Biomarker Studies
| Parameter | Technical Verification | Independent Validation | Population-Level Validation |
|---|---|---|---|
| Total Sample Size | 136 patients [20] | 256 patients [20] | 452 patients [25] |
| Case:Control Ratio | ~3:1 (99 endometriosis:37 controls) [20] | ~2:1 (170 endometriosis:86 controls) [20] | Based on population incidence |
| Age Distribution | Median ~31 years, range 19-44 [20] | Median ~31 years, range 14-42 [20] | Median 65 years, range 29-93 [25] |
| Molecular Subtype Distribution | N/A for endometriosis | N/A for endometriosis | MMR-D (28.1%), POLE (9.3%), p53abn (12.2%), p53wt (50.4%) [25] |
Detailed Methodological Protocols
Technical Verification Cohort Protocol
Objective: To assess the impact of technical and biological variability on the performance of previously developed prediction models.
Sample Processing Methodology:
- Collect peripheral blood plasma samples from a subset of patients included in the original study
- Ensure minimum required plasma volume (1 ml per sample)
- Use only samples that haven't been previously thawed to prevent degradation effects
- Process samples in EDTA tubes, centrifuged at 1400 g for 10 minutes at 4°C
- Aliquot, label, and store at -80°C until analysis
- Maintain maximum time interval of 1 hour between collection and storage at -80°C [20]
Exclusion Criteria:
- Patients using hormonal medication (combined oral contraceptive pill, progestins, or GnRH analogues)
- Patients operated within 6 months prior to sample collection
- Samples with insufficient volume or quality metrics
Statistical Analysis Framework:
- Conduct both univariate and multivariate approaches (logistic regression)
- Compare performance metrics with original prediction models
- Assess reproducibility across different laboratory settings and assay methodologies
Independent Validation Cohort Protocol
Objective: To validate biomarker performance in a completely independent patient cohort with varied biological and clinical characteristics.
Multi-Center Recruitment Strategy:
- Establish standardized protocols across participating institutions using WERF EPHect guidelines
- Implement consistent inclusion/exclusion criteria while allowing for real-world diversity
- Collect detailed clinical metadata including age, menstrual cycle phase at surgery, detailed surgery reports with ASRM scoring, medication use, and preoperative ultrasound findings [20]
Molecular Subtyping Integration: For endometrial cancer studies, incorporate ProMisE molecular classification:
- MMR-D (mismatch repair deficient)
- POLEmut (POLE ultramutated)
- p53abn (p53 abnormal)
- NSMP (no specific molecular profile) [26] [25]
Sample Size Calculation:
- Base calculations on effect sizes observed in discovery and technical verification phases
- Account for expected prevalence of molecular subtypes in target population
- Ensure adequate power for subgroup analyses (minimum 80% power, α=0.05)
Addressing Demographic Diversity Gaps
Current Limitations: Existing EC risk prediction models suffer from limited racial and ethnic diversity, with most developed in datasets of postmenopausal women of White or European ancestry from Western countries [13].
Protocol Enhancement:
- Implement stratified recruitment to ensure representation of underrepresented populations
- Collect comprehensive demographic data including race, ethnicity, and socioeconomic status
- Account for known disparities in EC incidence and mortality across demographic groups
Visualizing Cohort Selection Workflows
Cohort Validation Pipeline: This diagram illustrates the sequential progression from discovery to clinical application, highlighting key activities at each validation stage.
Cohort Interrelationships: This diagram shows how different cohort types address distinct research questions throughout the validation process.
The Scientist's Toolkit: Essential Research Reagents and Materials
Table 3: Key Research Reagent Solutions for Endometrial Biomarker Validation
| Reagent/Material | Primary Function | Application Notes | Quality Control Requirements |
|---|---|---|---|
| EDTA Plasma Tubes | Blood collection for biomarker analysis | Standardized collection tubes across all sites; maintain consistent centrifugation protocols | Verify batch consistency; document lot numbers |
| Immunoassay Kits | Quantification of protein biomarkers | Validate same kit lots across sites or account for inter-lot variability | Include controls in each run; document CV% |
| IHC Antibodies | Tissue-based biomarker detection | Standardize staining protocols across participating laboratories | Include control tissues with each batch |
| DNA/RNA Extraction Kits | Molecular analysis | Use consistent methodology across all samples | Quantify yield and quality (A260/280 ratios) |
| Multiparametric MRI | Radiomic feature extraction | Standardize imaging protocols across centers | Phantom testing for scanner calibration |
| Liquid Biopsy Collection Tubes | Cell-free DNA analysis | Ensure compatibility with downstream sequencing applications | Document storage conditions and time-to-processing |
Effective cohort selection strategies for endometrial biomarker validation require meticulous attention to technical reproducibility, biological diversity, and clinical representativeness. By implementing the structured approaches outlined in this protocol—including technical verification cohorts, independent validation cohorts, and population-based assessments—researchers can significantly enhance the translational potential of their endometrial biomarker discoveries. The integration of molecular classification systems, attention to demographic diversity, and standardization across collection sites represents the current gold standard for generating clinically meaningful validation data that can advance patient care in endometrial conditions.
Endometrial cancer (EC) is the most common gynecologic malignancy in developed countries, with a globally rising incidence [27]. While early-stage cases often have a favorable prognosis, advanced or recurrent diseases exhibit poor outcomes, highlighting the limitations of traditional histopathologic classification [27]. The Cancer Genome Atlas (TCGA) research network has fundamentally redefined endometrial cancer classification through integrated genomic, transcriptomic, and proteomic profiling, establishing four distinct molecular subtypes that reflect the disease's underlying heterogeneity [27] [24]. This molecular reclassification provides a more systematic framework for risk stratification and biomarker identification.
Multi-omics integration combines data from various molecular layers—including genomics, proteomics, and metabolomics—to create a comprehensive understanding of tumor biology [28]. This approach has revolutionized biomarker discovery by capturing the complex interactions between different biological levels that drive cancer pathogenesis [28]. For endometrial cancer research, multi-omics strategies have identified numerous potential biomarkers that could improve diagnosis, prognosis, and treatment selection, ultimately supporting personalized therapeutic approaches [27] [24]. The validation of these biomarkers in independent cohorts represents a critical step toward clinical implementation and requires rigorous methodological frameworks.
Experimental Design for Multi-Omics Biomarker Validation
Study Population and Sample Collection
Robust validation of endometrial cancer biomarkers requires careful consideration of sample sources and cohort characteristics. Researchers can utilize both tissue and liquid biopsy samples, each offering distinct advantages. Tissue biopsies remain the gold standard for definitive diagnosis through histopathological examination but suffer from limitations including tumor heterogeneity, poor repeatability, and invasiveness [24]. Liquid biopsies—including blood, cervicovaginal fluid, urine, uterine lavage fluid, and ascites—provide minimally invasive alternatives that enable continuous monitoring and better reflect the entire tumor burden [24].
For multi-omics validation studies, the following sample types are particularly valuable:
- Tissue samples: Flash-frozen or formalin-fixed paraffin-embedded (FFPE) endometrial tumor tissues collected during hysterectomy or biopsy procedures
- Blood samples: Plasma or serum for circulating tumor DNA (ctDNA), proteins, metabolites, and extracellular vesicles including exosomes [24]
- Uterine lavage fluid: Provides direct access to uterine cavity content with enriched tumor-derived factors [24]
- Cervicovaginal fluid: Collected via swabs, brushes, or tampons, offering proximity to the uterine environment [24]
Cohort selection should represent the molecular diversity of endometrial cancer, including representation across TCGA subtypes: POLE ultramutated, microsatellite instability (MSI) hypermutated, copy-number low, and copy-number high [27] [24]. Independent validation cohorts must be sufficiently powered to detect statistically significant associations between biomarkers and clinical outcomes, with careful consideration of confounding factors such as age, body mass index, menopausal status, and histological variants.
Multi-Omics Data Generation Workflow
The integrated workflow for multi-omics biomarker validation involves parallel processing of samples through genomic, proteomic, and metabolomic platforms, followed by computational integration and statistical validation. The diagram below illustrates this comprehensive experimental design:
Figure 1. Comprehensive workflow for multi-omics biomarker validation in endometrial cancer. Samples undergo parallel processing through genomic, proteomic, and metabolomic platforms followed by computational integration and statistical validation.
Experimental Protocols
Genomic Analysis Protocol
Objective: Identify somatic mutations, copy number variations, and structural variants in endometrial cancer samples to establish genomic biomarkers.
Materials and Reagents:
- QIAamp DNA Mini Kit (Qiagen) or equivalent DNA extraction system
- KAPA HyperPrep Kit (Roche) or similar library preparation system
- IDT xGen Lockdown Panels for targeted sequencing (optional)
- Illumina sequencing platforms (NovaSeq 6000 recommended)
- Bioanalyzer 2100 or TapeStation for quality control (Agilent)
Procedure:
DNA Extraction and Quality Control
- Extract genomic DNA from 20-30 mg of frozen tissue or FFPE sections using commercial kits according to manufacturer's protocols
- Assess DNA quality and quantity using fluorometric methods (Qubit) and fragment analyzer systems
- Accept samples with DNA concentration ≥10 ng/μL, total yield ≥500 ng, and DNA Integrity Number (DIN) ≥7.0
Whole Exome Sequencing Library Preparation
- Fragment 100-200 ng of genomic DNA to target size of 200-300 bp using acoustic shearing
- Perform end repair, A-tailing, and adapter ligation using commercial library preparation kits
- Enrich for exonic regions using hybridization-based capture systems (SureSelect, Illumina)
- Amplify libraries with limited-cycle PCR (8-10 cycles) to minimize amplification bias
Sequencing and Data Processing
- Sequence libraries on Illumina platform to achieve minimum 100x mean coverage for tumor samples and 60x for matched normal
- Convert BCL files to FASTQ format using bcl2fastq
- Align reads to reference genome (GRCh38) using BWA-MEM or STAR aligner
- Process BAM files through GATK Best Practices pipeline including base quality recalibration and indel realignment
Variant Calling and Annotation
- Identify somatic single nucleotide variants (SNVs) using MuTect2 with matched normal samples
- Detect insertions/deletions using Strelka2 or VarDict
- Call copy number alterations using Control-FREEC or Sequenza
- Annotate variants using ANNOVAR or SnpEff with population frequency databases (gnomAD, 1000 Genomes) and cancer databases (COSMIC, cBioPortal)
Quality Control Metrics:
- >80% of bases with Q30 quality score
- >80% of target regions covered at 20x minimum
- Cross-sample contamination rate <3% using VerifyBamCountry
- Concordance with known variant calls >95% for reference standards
Proteomic Analysis Protocol
Objective: Quantify protein expression and post-translational modifications to identify proteomic biomarkers in endometrial cancer.
Materials and Reagents:
- RIPA lysis buffer with protease and phosphatase inhibitors
- Bicinchoninic acid (BCA) Protein Assay Kit (Pierce)
- Trypsin/Lys-C mix for protein digestion (Promega)
- C18 desalting columns (Waters)
- TMTpro 16plex or similar isobaric labeling reagents (Thermo Scientific)
- High-pH reverse-phase fractionation kit (Pierce)
- Q Exactive HF-X or Orbitrap Fusion Lumos mass spectrometer (Thermo Scientific)
Procedure:
Protein Extraction and Digestion
- Homogenize 20-30 mg frozen tissue in RIPA buffer using bead-beating or Dounce homogenization
- Centrifuge at 14,000 × g for 15 minutes at 4°C and collect supernatant
- Quantify protein concentration using BCA assay with bovine serum albumin standards
- Reduce 100 μg protein with 5 mM dithiothreitol (30 minutes, 37°C) and alkylate with 15 mM iodoacetamide (30 minutes, room temperature in dark)
- Digest with trypsin/Lys-C (1:25 enzyme-to-protein ratio) overnight at 37°C
Tandem Mass Tag (TMT) Labeling and Fractionation
- Desalt digested peptides using C18 columns according to manufacturer's protocol
- Label peptides with TMTpro reagents (dissolved in anhydrous acetonitrile) for 1 hour at room temperature
- Quench reaction with 5% hydroxylamine for 15 minutes
- Combine labeled samples in equal amounts and desalt
- Fractionate using high-pH reverse-phase chromatography into 96 fractions consolidated to 24
Liquid Chromatography and Mass Spectrometry
- Separate peptides using Easy-nLC 1200 system with 75 μm × 25 cm PepMap column (2 μm C18 particles)
- Run 120-minute gradient from 2% to 30% acetonitrile in 0.1% formic acid at 300 nL/min
- Acquire data in data-dependent acquisition mode with MS1 resolution 120,000 and MS2 resolution 60,000
- Use higher-energy collisional dissociation (HCD) with normalized collision energy of 34%
- Set dynamic exclusion to 45 seconds
Data Processing and Protein Quantification
- Process raw files using Proteome Discoverer 3.0 or MaxQuant
- Search against human UniProt database with trypsin specificity, allowing two missed cleavages
- Set mass tolerances to 10 ppm for MS1 and 0.02 Da for MS2
- Include variable modifications: methionine oxidation, protein N-terminal acetylation
- Include fixed modifications: carbamidomethylation of cysteine, TMTpro on lysine and N-termini
- Apply false discovery rate (FDR) threshold of 1% at protein and peptide levels
- Normalize protein abundances using total peptide amount and correct for batch effects
Quality Control Metrics:
- Protein digestion efficiency >90% by peptide mass distribution
- TMT labeling efficiency >98%
- Median coefficient of variation <15% for technical replicates
- Identification of ≥8,000 protein groups per sample
Metabolomic Analysis Protocol
Objective: Identify and quantify small molecule metabolites to discover metabolic biomarkers in endometrial cancer.
Materials and Reagents:
- Methanol, acetonitrile, and isopropanol (LC-MS grade)
- Water (LC-MS grade)
- Formic acid and ammonium acetate (MS grade)
- Internal standards: CAMEO CIL Mix (Cambridge Isotope Laboratories)
- BEH C18 column (1.7 μm, 2.1 × 100 mm; Waters)
- HILIC column (1.7 μm, 2.1 × 100 mm; Waters)
- Q Exactive HF-X or similar orbitrap mass spectrometer (Thermo Scientific)
Procedure:
Metabolite Extraction
- Weigh 20 mg frozen tissue and add 400 μL ice-cold methanol:acetonitrile:water (5:3:2) extraction solvent
- Add internal standard mixture (10 μL per 100 μL extraction volume)
- Homogenize using bead beater (6 m/s, 30 seconds, 2 cycles)
- Sonicate in ice-water bath for 10 minutes
- Incubate at -20°C for 1 hour to precipitate proteins
- Centrifuge at 14,000 × g for 15 minutes at 4°C
- Transfer supernatant to new tube and dry using SpeedVac concentrator
- Reconstitute in 100 μL appropriate solvent for LC-MS analysis
Liquid Chromatography-Mass Spectrometry Analysis
Reversed-Phase Chromatography (for lipids and hydrophobic metabolites):
- Resuspend dried extract in 100 μL isopropanol:acetonitrile:water (2:1:1)
- Inject 5 μL onto BEH C18 column maintained at 45°C
- Use mobile phase A: water with 0.1% formic acid; B: acetonitrile with 0.1% formic acid
- Run 18-minute gradient: 5% B to 100% B over 14 minutes, hold 2 minutes, re-equilibrate
- Flow rate: 0.4 mL/min
HILIC Chromatography (for polar metabolites):
- Resuspend dried extract in 100 μL acetonitrile:water (1:1)
- Inject 5 μL onto HILIC column maintained at 35°C
- Use mobile phase A: 20 mM ammonium acetate in water (pH 9.0); B: acetonitrile
- Run 15-minute gradient: 90% B to 40% B over 10 minutes, hold 2 minutes, re-equilibrate
- Flow rate: 0.4 mL/min
Mass Spectrometry Parameters:
- Use heated electrospray ionization source in positive and negative ion modes
- Set spray voltage to 3.5 kV (positive) and 3.2 kV (negative)
- Capillary temperature: 320°C
- Sheath gas: 40 arb, Aux gas: 10 arb, Sweep gas: 2 arb
- Full MS scans at resolution 120,000 with mass range 70-1050 m/z
- Data-dependent MS/MS at resolution 30,000 with stepped NCE 20, 30, 40
Metabolite Identification and Quantification
- Process raw data using Compound Discoverer 3.2 or XCMS Online
- Perform peak picking, alignment, and gap filling
- Annotate metabolites using mzCloud and HMDB databases with 5 ppm mass tolerance
- Confirm identities using MS/MS spectral matching with minimum 70% similarity score
- Normalize peak areas to internal standards and sample weight
- Perform quality control using pooled quality control samples with coefficient of variation <30%
Quality Control Metrics:
- Retention time drift <0.2 minutes across batch
- Internal standard peak area CV <15%
- >70% of metabolites with CV <20% in QC samples
- Signal intensity drift <20% across batch
Data Integration and Statistical Analysis
Multi-Omics Data Integration Methods
Integrating genomic, proteomic, and metabolomic data requires specialized computational approaches to handle the high dimensionality and heterogeneous nature of multi-omics datasets. Multiple Factor Analysis (MFA) provides a robust framework for simultaneous exploration of multiple data tables where the same individuals are described by several sets of variables [29]. The mathematical foundation of MFA involves analyzing a set of J data tables (K₁,…,K_J) where each table corresponds to a different omics dataset measured on the same I individuals.
For studies with missing samples across omics layers, the Multiple Imputation in Multiple Factor Analysis (MI-MFA) method offers a solution by generating plausible values for missing rows, creating M completed datasets, applying MFA to each, and combining the configurations to produce a consensus solution [29]. This approach properly reflects the uncertainty introduced by missing data and provides more reliable estimates than simple deletion or mean imputation methods.
Additional integration approaches include:
- Similarity Network Fusion: Constructs networks for each data type and fuses them into a unified network
- Multi-Omics Factor Analysis: Decomposes variation into shared and data-type-specific factors
- Integrative Clustering: Identifies patient subgroups based on patterns across multiple omics layers
- Regularized Canonical Correlation Analysis: Identifies relationships between two omics data types
Machine learning approaches, particularly deep learning models such as autoencoders and multi-view learning, have shown promising results in capturing non-linear relationships across omics layers for biomarker discovery and patient stratification [28].
Biomarker Validation Statistics
Robust statistical validation of multi-omics biomarkers requires multiple testing corrections and assessment of clinical utility:
- Differential Analysis: For each omics layer, identify features significantly associated with clinical endpoints using linear models (for continuous data) or logistic regression/Cox proportional hazards (for categorical/survival data)
- Multiple Testing Correction: Apply Benjamini-Hochberg procedure to control false discovery rate at 5%
- Classification Performance: Evaluate biomarker panels using area under receiver operating characteristic curve (AUC-ROC), sensitivity, specificity, and precision-recall curves
- Survival Analysis: Assess prognostic biomarkers using Kaplan-Meier curves and log-rank tests for group comparisons, with multivariate Cox regression to adjust for clinical covariates
- Clinical Utility: Calculate net reclassification improvement and integrated discrimination improvement to assess added value beyond standard clinical factors
Key Biomarkers and Clinical Applications
Established and Emerging Multi-Omics Biomarkers in Endometrial Cancer
Table 1. Validated Genomic Biomarkers in Endometrial Cancer
| Biomarker | Molecular Function | Clinical Significance | Detection Method |
|---|---|---|---|
| POLE mutations | Catalytic subunit of DNA polymerase epsilon | Ultramutated phenotype, favorable prognosis [27] | Whole exome sequencing |
| Microsatellite Instability (MSI) | DNA mismatch repair deficiency | Hypermutated, Lynch syndrome association, immunotherapy response [27] | PCR fragment analysis or NGS |
| PTEN mutations | Tumor suppressor, PI3K/AKT pathway regulation | Most common mutation in endometrioid EC, type I association [27] [30] | Immunohistochemistry or NGS |
| TP53 mutations | Tumor suppressor, cell cycle regulation | Serous histology, poor prognosis, copy-number high subtype [27] [30] | Immunohistochemistry or NGS |
| PIK3CA mutations | Catalytic subunit of PI3K, AKT activation | Oncogenic driver, potential therapeutic target [27] | Targeted NGS |
| CTNNB1 mutations | β-catenin encoding, WNT pathway activation | Low-grade endometrioid tumors, specific subtype [27] | Immunohistochemistry or NGS |
| ARID1A mutations | Chromatin remodeling, SWI/SNF complex | Early tumorigenesis, endometrioid histology [27] | Immunohistochemistry or NGS |
Table 2. Proteomic and Metabolomic Biomarkers in Endometrial Cancer
| Biomarker Category | Specific Biomarkers | Biological Function | Clinical Application |
|---|---|---|---|
| Protein Biomarkers | Phosphorylated AKT, S6K | PI3K/AKT/mTOR pathway activation [27] | Therapeutic targeting, prognosis |
| MMP2, MMP9 | Extracellular matrix degradation, invasion [27] | Prognosis, advanced stage correlation | |
| Annexin A2, Heat shock proteins | Cell signaling, stress response [27] | Potential diagnostic biomarkers | |
| Metabolite Biomarkers | 2-hydroxyglutarate (2-HG) | Oncometabolite in IDH-mutant tumors [28] | Diagnostic and mechanistic biomarker |
| Lipid species alterations | Membrane composition, signaling | Subtype classification, therapy response | |
| TCA cycle intermediates | Energy metabolism reprogramming | Metabolic subtype identification | |
| Circulating Biomarkers | ctDNA mutations | Tumor-derived DNA fragments [24] | Treatment monitoring, minimal residual disease |
| Exosomal proteins/nucleic acids | Intercellular communication [24] | Liquid biopsy, early detection | |
| miRNA signatures (e.g., miR-205, miR-200 family) | Post-transcriptional regulation [24] | Diagnostic and prognostic potential |
Integrated Molecular Classification and Signaling Pathways
The TCGA classification system categorizes endometrial cancer into four molecular subtypes with distinct clinical outcomes and therapeutic implications. The signaling pathways diagram below illustrates the key molecular alterations across these subtypes:
Figure 2. Molecular subtypes of endometrial cancer with associated signaling pathways and clinical outcomes. The TCGA classification system identifies four major subtypes with distinct genetic alterations, pathway dysregulation, and prognostic implications.
The Scientist's Toolkit
Table 3. Essential Research Reagent Solutions for Multi-Omics Biomarker Validation
| Category | Reagent/Kit | Manufacturer | Application in Protocol |
|---|---|---|---|
| Nucleic Acid Analysis | QIAamp DNA FFPE Tissue Kit | Qiagen | DNA extraction from archival samples |
| KAPA HyperPrep Kit | Roche | NGS library preparation | |
| SureSelect XT HS2 DNA Reagent Kit | Agilent | Whole exome sequencing capture | |
| TruSeq RNA Library Prep Kit | Illumina | Transcriptome sequencing | |
| Protein Analysis | RIPA Lysis Buffer | Thermo Scientific | Protein extraction from tissues |
| BCA Protein Assay Kit | Pierce | Protein quantification | |
| TMTpro 16plex Label Reagent | Thermo Scientific | Multiplexed proteomic quantification | |
| Trypsin/Lys-C Mix, Mass Spec Grade | Promega | Protein digestion for MS analysis | |
| Metabolite Analysis | 1 mL HybridSPE-Precipitation Plates | MilliporeSigma | Phospholipid removal from plasma |
| CAMEO CIL Mix | Cambridge Isotope Labs | Internal standards for metabolomics | |
| Accucore C18 and HILIC columns | Thermo Scientific | Metabolite separation | |
| Data Analysis | Compound Discoverer 3.2 | Thermo Scientific | Metabolite identification and quantification |
| Proteome Discoverer 3.0 | Thermo Scientific | Proteomic data analysis | |
| GATK Best Practices | Broad Institute | Genomic variant discovery | |
| R/Bioconductor Packages | Open Source | Statistical analysis and integration |
The integration of proteomic, metabolomic, and genomic approaches provides a powerful framework for validating endometrial cancer biomarkers in independent cohorts. The protocols outlined in this application note enable comprehensive molecular profiling that captures the complexity of endometrial cancer biology. The TCGA molecular classification system has established a new paradigm for risk stratification that incorporates genomic features with traditional histopathological assessment [27] [24].
Successful validation of multi-omics biomarkers requires rigorous experimental design, standardized protocols, and appropriate statistical methods for data integration. The growing availability of multi-omics databases and computational tools supports the discovery and validation of biomarkers with clinical potential [28]. As these technologies continue to evolve, particularly with advances in single-cell and spatial multi-omics, we anticipate further refinement of endometrial cancer classification and biomarker panels that will ultimately improve patient outcomes through personalized treatment approaches [28] [24].
Artificial Intelligence and Machine Learning in Biomarker Validation
The validation of biomarkers is a critical step in translating molecular discoveries into clinically applicable tools for diagnosis, prognosis, and therapeutic guidance. Within endometrial cancer research, this process is particularly vital, as current diagnostic methods are invasive and subject to significant variability [2]. The integration of Artificial Intelligence (AI) and Machine Learning (ML) into the validation workflow presents a paradigm shift, enabling researchers to move beyond single-marker validation towards a holistic, multi-omics approach. This document outlines detailed application notes and protocols for employing AI/ML in the validation of endometrial cancer biomarkers, with a specific focus on frameworks suitable for independent cohort research. The overarching goal is to provide a methodological roadmap that enhances the reproducibility, robustness, and clinical utility of biomarker signatures.
Background and Significance
Endometrial cancer, the sixth most common cancer in females globally, suffers from a diagnostic pathway reliant on invasive tissue biopsies and histopathological assessment, which has demonstrated significant interobserver and intraobserver variability [2]. This underscores an urgent need for novel, minimally invasive biomarkers. Extracellular vesicles (EVs) have emerged as promising biomarker sources, as they carry molecular cargo reflective of their cell of origin and are readily isolated from biofluids like blood and urine [2].
However, the validation of such biomarkers is fraught with challenges. Traditional statistical methods often struggle with the high-dimensional nature of omics data (e.g., genomics, proteomics, glycomics), leading to high false-positive rates and poor generalizability. AI and ML methodologies address these limitations by providing powerful tools for pattern recognition, data integration, and predictive modeling. As highlighted in general biomarker discovery reviews, ML can integrate diverse data types—including genomics, transcriptomics, proteomics, and imaging—to identify more reliable and clinically useful biomarkers [31]. The transition from discovery to validated clinical application requires a rigorous, transparent, and standardized framework, which these protocols aim to establish.
AI/ML Validation Framework for Endometrial Biomarkers
The following section details a structured framework for the validation of candidate biomarkers, incorporating specific findings from endometrial cancer research and generalizable ML best practices.
Candidate Biomarkers for Validation in Endometrial Cancer
Systematic reviews have identified several putative diagnostic biomarkers for endometrial cancer that are prime candidates for rigorous ML-facilitated validation. These biomarkers, often associated with extracellular vesicles, require confirmation in large, independent cohorts. The table below summarizes key candidates identified in recent literature.
Table 1: Putative Extracellular Vesicle-Associated Diagnostic Biomarkers for Endometrial Cancer Requiring Validation
| Biomarker Name | Type | Reported Expression in EC vs. Controls | Potential Clinical Utility | Key Considerations for Validation |
|---|---|---|---|---|
| LGALS3BP | Protein | Elevated [2] | Diagnostic | Validate specificity against benign gynecological conditions. |
| miR-21-3p | microRNA | Elevated [2] | Diagnostic | Confirm expression mirrors tumor tissue; assess technical variability in EV isolation. |
| miR-15a-5p | microRNA | Elevated [2] | Diagnostic | Evaluate correlation with clinical stage and grade. |
| miR-26a-5p | microRNA | Decreased [2] | Diagnostic | Assess performance in a multi-marker panel. |
| miR-130a-3p | microRNA | Decreased [2] | Diagnostic | Determine if levels normalize post-treatment. |
| miR-139 | microRNA | Decreased [2] | Diagnostic | Investigate role as a prognostic marker. |
| miR-219a-5p | microRNA | Decreased [2] | Diagnostic | Validate in urine-based tests for minimal invasiveness. |
| miR-222-3p | microRNA | Decreased [2] | Diagnostic | Check for cross-reactivity in EV assays. |
| miR-885 | microRNA | Decreased [2] | Diagnostic | Independent replication of diagnostic performance. |
Experimental and Computational Protocols
A robust validation pipeline integrates both wet-lab experimental procedures and dry-lab computational analysis. Adherence to standardized protocols is essential for generating high-quality, reproducible data.
Protocol 1: Pre-Analytical Biofluid Processing for EV Isolation
Application Note: Inconsistent pre-analytical handling is a major source of variability in EV biomarker studies. This protocol standardizes the initial processing phase.
- Biofluid Collection: Collect patient plasma using EDTA tubes. Process samples within 2 hours of collection to minimize platelet contamination and biomolecule degradation [2].
- Centrifugation:
- Step 1: Centrifuge at 2,500 × g for 15 minutes at 4°C to remove cells.
- Step 2: Transfer the supernatant to a new tube and centrifuge at 15,000 × g for 30 minutes at 4°C to remove cell debris and apoptotic bodies.
- Aliquoting and Storage: Aliquot the resulting cell-free plasma into cryovials and immediately store at -80°C. Avoid repeated freeze-thaw cycles.
Protocol 2: Extracellular Vesicle Isolation and Characterization
Application Note: The choice of isolation method can enrich for different EV subpopulations, impacting downstream biomarker analysis.
- Isolation Method (Choose one and justify):
- Differential Ultracentrifugation (Gold Standard): Pellet EVs from pre-cleared plasma via ultracentrifugation at 110,000 × g for 70 minutes at 4°C. Resuspend the EV pellet in sterile PBS [2].
- Precipitation-based Kit: Use commercial kits (e.g., ExoQuick) per manufacturer's instructions. While user-friendly, they may co-precipitate non-EV contaminants [2].
- EV Characterization (Mandatory per MISEV guidelines):
- Size and Concentration: Perform Nanoparticle Tracking Analysis (NTA) to determine the particle size distribution and concentration.
- Morphology: Use Transmission Electron Microscopy (TEM) to confirm the classic cup-shaped morphology of vesicles.
- Protein Markers: Demonstrate the presence of transmembrane (e.g., CD9, CD63, CD81) and cytosolic (e.g., TSG101, Alix) EV proteins via Western blot. Absence of negative markers (e.g., Calnexin) should be confirmed [2].
Protocol 3: ML Model Building and Validation for Independent Cohorts
Application Note: This protocol is inspired by successful ML frameworks applied in other cancer biomarker studies [32] [33] and is tailored for endometrial biomarker validation.
- Data Preprocessing:
- Model Training and Multi-Objective Optimization:
- Algorithm Selection: Employ tree-based ensemble models such as XGBoost or CatBoost, which have demonstrated high performance in biological classification tasks [32] [33].
- Hyperparameter Tuning: Use a grid search approach within a nested cross-validation (NCV) scheme to optimize hyperparameters, balancing accuracy and complexity [33].
- Model Validation and Calibration:
- Validation Scheme: Implement a Nested Cross-Validation (NCV) scheme. The outer loop estimates model performance, while the inner loop performs model selection. This prevents optimistic bias [33].
- Probability Calibration: Calibrate the model's output probabilities using an Inductive Venn-Abers Predictor (IVAP) to ensure they reflect true likelihoods, which is critical for clinical risk stratification [33].
- Independent Testing: The final model, trained on the full development set, must be evaluated on a completely held-out independent cohort that was not used for training or validation. This is the gold standard for assessing generalizability.
The Scientist's Toolkit: Research Reagent Solutions
Table 2: Essential Materials and Reagents for AI-Driven Biomarker Validation
| Item/Category | Function/Application | Example Product/Assay |
|---|---|---|
| CD9/CD63/CD81 Antibodies | Detection of canonical EV surface markers for characterization via Western blot or flow cytometry. | Anti-CD9 (e.g., SySy), Anti-CD63 (e.g., Thermo Fisher) |
| RNA Isolation Kit (EV-enriched) | Isolation of high-quality small RNAs, including miRNAs, from EV preparations. | miRNeasy Serum/Plasma Kit (Qiagen) |
| NanoString nCounter | Digital quantification of multiplexed miRNA or mRNA expression without amplification, ideal for EV-derived nucleic acids. | nCounter miRNA Expression Assay |
| Proteomics Kit | Multiplexed, high-sensitivity quantification of protein biomarkers in complex biofluids or EV lysates. | Olink Target 96 or 384-plex panels |
| XGBoost Python Package | Implementation of the gradient boosting algorithm for building high-performance classification models. | xgboost library (XGBoost Developers) |
| SHAP Python Library | Model-agnostic interpretation of ML model outputs to identify feature importance and contribution. | shap library (SHAP Developers) |
Visualization and Interpretation of Validation Workflows
The following diagrams, generated using Graphviz DOT language, illustrate the core workflows and relationships described in these protocols.
Biomarker Validation Pipeline
AI Model Interpretation Logic
The integration of AI and ML into the biomarker validation pipeline represents a powerful strategy to overcome the limitations of traditional approaches. For endometrial cancer, applying the structured protocols and frameworks outlined herein—from standardized EV handling to rigorous, explainable ML validation—will be instrumental in advancing putative biomarkers like miR-21-3p and LGALS3BP from initial discovery to clinically actionable tools. The ultimate success of this endeavor hinges on a commitment to methodological rigor, transparent reporting, and, most critically, validation in well-characterized independent cohorts. This pathway promises to deliver the minimally invasive, reproducible diagnostic and prognostic tools urgently needed for improving patient outcomes in endometrial cancer.
The validation of endometrial biomarkers in independent cohort research represents a critical pathway toward improving the non-invasive diagnosis of endometriosis. The historical lack of standardized methods for collecting clinical data and biospecimens has significantly hampered the reproducibility and comparability of research findings across different centers. The World Endometriosis Research Foundation (WERF) Endometriosis Phenome and Biobanking Harmonisation Project (EPHect) was established to address this exact challenge by creating global consensus tools. This article details the application of EPHect standards and complementary harmonization guidelines, providing a structured framework for researchers aiming to generate robust, reliable data for biomarker discovery and validation.
The EPHect Framework: A Foundation for Standardization
The EPHect initiative is a landmark collaboration that provides standardized tools to facilitate large-scale, cross-center endometriosis research. Its primary objective is to enable the design and interpretation of collaborative studies through the harmonization of data and sample collection methods [34]. The project has developed four key resources:
- Standardized Clinical Phenotyping: Detailed questionnaires and forms for collecting clinical and covariate data [34] [35].
- Physical Examination Standards (EPHect-PE): A standardized tool for physical examination assessment, which aids in non-surgical diagnosis and pain phenotyping [36].
- Biospecimen SOPs: Standard Operating Procedures for the collection, processing, and storage of fluid biospecimens (blood, urine) and tissues [34] [35].
- Experimental Model SOPs: Guidelines for using experimental models, including heterologous rodent models, in endometriosis research [37] [34].
The widespread adoption of these protocols is crucial. To date, 67 institutions in 25 countries are registered as users, creating an unprecedented opportunity for data pooling and collaborative analysis [34]. When using these tools, investigators should acknowledge EPHect in all publications and describe any deviations from the standard protocols in their methods sections [36].
Standardized Clinical and Phenotypic Data Collection
Accurate and harmonized phenotyping is the cornerstone of meaningful biomarker research. The EPHect tools provide a comprehensive system for characterizing patients and controls.
The EPHect Participant Questionnaires
The EPHect Endometriosis Participant Questionnaire (EPQ) is designed to gather detailed clinical and personal history [38]. It captures information on symptomatology, pain experience, menstrual history, quality of life, and medical history. The cross-cultural translation and adaptation of the EPQ for Turkish-speaking populations demonstrated that the tool is comprehensive, informative, and feasible, taking approximately 30-60 minutes to complete [38]. This process underscores the questionnaire's utility and adaptability for global research.
Standardized Physical Examination (EPHect-PE)
The EPHect-PE tool provides a systematic method for documenting physical findings that can offer insight into a non-surgical diagnosis of endometriosis. The assessment targets three key anatomical regions [36]:
- Pelvic Girdle Pain (PGP) Assessments: Includes five tests, such as the Sacroiliac joint tenderness test and the Faber test (Patrick test), to evaluate musculoskeletal causes of pelvic pain.
- Abdominal Wall Assessments: Includes Carnett's test to differentiate between abdominal wall and visceral sources of pain, and an allodynia test using a Q-tip to identify cutaneous sensitivity.
- Pelvic Floor Muscle Tenderness Assessments: Involves palpation of both superficial (e.g., bulbocavernosus) and deep (e.g., pubococcygeus, obturator internus) muscles to identify myofascial pain.
The systematic application of this examination ensures that pain phenotypes are characterized consistently across different patients and research sites, enabling more precise correlation with biomarker levels and lesion characteristics.
Biospecimen Collection, Processing, and Biobanking Standards
The integrity of biomarker research is directly dependent on the quality of the biospecimens used. The EPHect SOPs provide meticulous protocols for handling samples to preserve biomarker stability and ensure analytical reproducibility [35]. The ENDOmarker study protocol serves as an excellent example of implementing these standards in a multi-center longitudinal study [10].
The following table summarizes the key biospecimen types and their handling as per EPHect standards and related protocols:
Table 1: Standardized Biospecimen Collection for Endometriosis Biomarker Research
| Biospecimen | Collection Method | Processing & Storage | Intended Use in Biomarker Research |
|---|---|---|---|
| Endometrial Tissue | Biopsy performed pre-operatively or at surgery [10]. | Placement in RNA stabilizer; long-term storage at -80°C [10]. | Genomic classifier development; microRNA and protein analysis [10]. |
| Blood (Serum/Plasma) | Fasting blood draw (≥10 hours) [39]. | Centrifugation; aliquoting; long-term storage at -80°C [10] [39]. | Analysis of inflammatory cytokines (e.g., IL-6, IL-8, MCP-1) and protein biomarkers (e.g., CA125, BDNF) [10] [40] [39]. |
| Whole Blood | Blood draw into appropriate collection tubes. | DNA/RNA extraction; long-term storage at -80°C [10]. | Genetic and genomic studies. |
| Urine | Collection at clinical visits [10]. | Aliquoting; storage at -80°C [10]. | Discovery of novel urinary biomarkers (proteomics, metabolomics). |
The workflow below illustrates the integration of standardized clinical and biospecimen protocols in a cohort study design, as exemplified by the ENDOmarker study [10]:
Application in Biomarker Discovery and Validation
The implementation of harmonized protocols directly enables the rigorous validation of endometrial biomarkers. The following table summarizes key findings from recent studies that have utilized standardized approaches:
Table 2: Biomarker Performance in Endometriosis Diagnosis Using Standardized Protocols
| Biomarker / Panel | Study Design | Association with Endometriosis Characteristics | Diagnostic Performance |
|---|---|---|---|
| Genomic Classifier (Endometrial Tissue) | Microarray analysis of eutopic endometrium from 148 women [10]. | Distinguished absence/presence of pathology; endometriosis vs no endometriosis; minimal/mild vs moderate/severe disease [10]. | 90-100% accuracy in diagnosing endometriosis [10]. |
| CA125 & BDNF (Serum) | Development and validation study using EPHect-standardized biobank samples (n=283 total) [39]. | Combined with 6 clinical variables in a multivariable model. | Specificity: 100% (86.7-100%); Sensitivity: 46.2% (25.5-66.8%). Useful as a rule-in test [39]. |
| Inflammatory Panel (Serum) | Analysis of 566 participants across 3 studies (A2A, ENDOX, ENDO) [40]. | IL-8 higher with red lesions; MCP-1 higher with posterior cul-de-sac and ovarian lesions; IL-6 higher with fallopian tube lesions [40]. | No significant association with rASRM stage or macrophenotype, suggesting utility for sub-phenotyping, not staging [40]. |
Experimental Protocol: Validating a Serum Biomarker Panel
The following protocol is adapted from studies that successfully validated serum biomarkers using EPHect-harmonized samples [10] [40] [39].
Objective: To measure circulating levels of protein biomarkers (e.g., CA125, BDNF, cytokines) in serum samples for correlation with surgically confirmed endometriosis phenotypes.
Materials:
- Research Reagent Solutions:
- EDTA or Serum Separator Tubes: For standardized blood collection.
- Luminex Multiplex Assay Kits or ELISA Kits: For quantifying multiple cytokines or specific biomarkers (e.g., BDNF) simultaneously.
- CA125 Immunoassay: A validated platform for measuring CA125 levels.
- Cryogenic Vials: For secure long-term sample storage at -80°C.
- Liquid Nitrogen or -80°C Freezer: For preserving sample integrity during storage and transport.
Methodology:
- Sample Collection: Collect fasting blood samples from consented participants pre-operatively. Process blood to serum by allowing it to clot and then centrifuging. Aliquot serum into cryovials immediately [10] [39].
- Sample Storage: Place aliquots in a -80°C freezer within 2 hours of collection. Adhere to a standardized freezer monitoring and maintenance log.
- Biomarker Analysis: Thaw samples in a consistent manner (e.g., on ice). Analyze all samples from cases and controls in the same batch, in a randomized order to minimize batch effects. Perform measurements in duplicate according to manufacturer's instructions for the chosen platform (e.g., ELISA, Luminex).
- Data Integration: Merge biomarker concentration data with complete surgical phenotype data (rASRM stage, lesion type, color, location) and clinical data from the EPQ.
Essential Research Reagent Solutions
The following table catalogs key materials required for implementing the described standardized protocols.
Table 3: Research Reagent Solutions for Endometriosis Biomarker Studies
| Essential Material / Reagent | Function / Application |
|---|---|
| EPHect Data Collection Forms (EPQ, Surgical Form) | Standardized clinical, covariate, and surgical phenotype data capture [34] [35]. |
| EPHect Physical Examination (PE) Tool | Standardized assessment of pelvic girdle pain, abdominal wall, and pelvic floor muscle tenderness [36]. |
| RNA Stabilization Reagent (e.g., RNAlater) | Preserves RNA integrity in endometrial tissue biopsies for genomic and transcriptomic analysis [10]. |
| Luminex Multiplex Panels | Enables simultaneous quantification of multiple serum cytokines/chemokines (e.g., IL-6, IL-8, MCP-1, TNF-α) from a small sample volume [40]. |
| ELISA Kits (e.g., for CA125, BDNF) | Quantifies specific protein biomarkers of interest in serum or plasma [39]. |
| Liquid Nitrogen or -80°C Freezers | Provides stable, long-term storage for biospecimens (serum, plasma, DNA, RNA, tissue) to preserve biomarker stability [10] [35]. |
The consistent implementation of WERF EPHect and related harmonization guidelines is a prerequisite for generating validated, clinically translatable endometrial biomarkers. By standardizing every step—from patient phenotyping and physical examination to biospecimen handling and analysis—researchers can overcome historical barriers to reproducibility. This structured approach ensures that data and samples collected across multiple centers can be reliably pooled and compared, ultimately accelerating the discovery of robust non-invasive diagnostic tools and personalized treatment strategies for endometriosis.
The validation of endometrial cancer (EC) biomarkers in independent cohort research demands analytical platforms that combine high sensitivity, specificity, and throughput. Endometrial cancer remains the most prevalent gynecological malignancy worldwide, yet current diagnostic methods face significant limitations. Transvaginal ultrasound exhibits low specificity (approximately 51.1%), while the commonly used blood biomarker CA-125 demonstrates poor sensitivity (<60%) [9]. Tissue biopsies, while definitive, are invasive procedures subject to interpretive variability [2]. These diagnostic shortcomings highlight the critical need for novel analytical approaches that can enable precise biomarker validation across diverse patient cohorts.
Mass spectrometry (MS) has emerged as a cornerstone technology in clinical chemistry, offering unparalleled capabilities for biomolecule analysis [41]. Recent advancements in MS platforms, particularly Particle-Enhanced Laser Desorption/Ionization Mass Spectrometry (PELDI-MS), have transformed our capacity to discover and verify biomarkers with the precision required for robust validation studies. These technologies provide the analytical rigor necessary to advance EC biomarker research from initial discovery to clinically applicable validation.
Principles and Advantages
PELDI-MS represents a significant advancement in MS-based metabolite detection, overcoming key limitations of traditional approaches. Conventional MS analysis of complex biofluids typically requires extensive sample preparation including deproteinization and liquid/gas chromatography to purify and enrich metabolites, processes that limit analytical speed and capacity [9]. In contrast, PELDI-MS utilizes defined particles for direct recognition and trapping of metabolites, dramatically enhancing analytical performance.
The PELDI-MS platform employs an on-chip microarray fabricated with ferric oxide particles that enable high-performance metabolite detection through several mechanisms [42]. This design provides three distinct advantages essential for large-scale biomarker validation studies: (1) exceptional salt and protein tolerance with enhanced signal intensities, enabling direct analysis of complex biological samples; (2) high reproducibility with coefficients of variation (CVs) of 5.6-11.0% and excellent linear response (R² = 0.963-0.986); and (3) rapid analytical speed of approximately 30 seconds per sample with high throughput capacity of 384 samples per chip [9] [42].
Performance Comparison with Traditional Methods
Table 1: Performance Comparison of Analytical Platforms for Endometrial Cancer Biomarker Detection
| Analytical Platform | Sensitivity | Specificity | AUC | Sample Throughput | Key Advantages |
|---|---|---|---|---|---|
| PELDI-MS (Metabolite Panel) | Not specified | Not specified | 0.901-0.902 | 384 samples/chip | Direct serum analysis, functional validation |
| PELDI-MS (SMFs with Machine Learning) | Not specified | Not specified | 0.957-0.968 | 384 samples/chip | Comprehensive metabolic profiling |
| CA-125 (Clinical Standard) | <60% | Not specified | 0.610-0.684 | High | Widespread availability |
| Transvaginal Ultrasound | Not specified | ~51.1% | Not specified | Moderate | Non-invasive, widely used |
| Extracellular Vesicle Biomarkers | Varies by biomarker | Varies by biomarker | Not specified | Moderate | Minimally invasive, molecular information |
PELDI-MS demonstrates superior analytical performance compared to traditional methods, particularly when integrated with machine learning for pattern recognition. In a direct comparison, PELDI-MS analysis of serum metabolic fingerprints (SMFs) achieved remarkable area-under-the-curve (AUC) values of 0.957-0.968 for EC diagnosis, significantly outperforming the clinical standard CA-125 (AUC 0.610-0.684, p < 0.05) [43] [9]. This performance enhancement is attributable to the technology's capacity to capture comprehensive metabolic alterations associated with endometrial cancer.
Application to Endometrial Cancer Biomarker Research
Validated Metabolic Biomarkers for Endometrial Cancer
PELDI-MS analysis of a cohort comprising 191 EC patients and 204 non-EC controls led to the identification and validation of a specific metabolic biomarker panel for endometrial cancer diagnosis [43] [42]. This panel consists of three key metabolites that exhibit differential abundance in EC patients compared to controls:
- Glutamine: An amino acid involved in cellular energy metabolism and nucleotide synthesis
- Glucose: A central carbohydrate in energy metabolism
- Cholesterol Linoleate: A lipid species involved in membrane structure and signaling
This three-metabolite panel achieved an AUC of 0.901-0.902 with an accuracy of 82.8-83.1% for differentiating EC from non-EC cases, demonstrating strong diagnostic potential [42]. Importantly, the biological function of these metabolites in EC pathophysiology was validated through in vitro experiments assessing their effects on EC cell proliferation, colony formation, migration, and apoptosis [9].
Comparative Biomarker Platforms in Endometrial Cancer
Beyond metabolomic approaches, other high-performance analytical platforms have shown promise for EC biomarker validation:
Extracellular Vesicle (EV) Biomarkers: Systematic review evidence identifies ten EV-associated biomarkers consistently differentially abundant between EC cases and controls [2]. The most promising diagnostic candidates include:
- Increased in EC: LGALS3BP, miR-15a-5p, miR-21-3p
- Decreased in EC: miR-26a-5p, miR-130a-3p, miR-139, miR-219a-5p
These EV biomarkers offer the advantage of being minimally invasive while providing molecular information that reflects the tumor microenvironment.
Soluble Immune Checkpoints (sICs): While not diagnostic for distinguishing EC patients from controls, specific sICs correlate with important prognostic features including mismatch repair (MMR) deficiency, lymphovascular space invasion (LVSI), and advanced disease stage [3]. This suggests potential applications for risk stratification and immunotherapy response prediction.
Table 2: Promising Endometrial Cancer Biomarker Candidates Identified by High-Performance Platforms
| Biomarker Category | Specific Biomarkers | Detection Platform | Clinical Application | Performance Metrics |
|---|---|---|---|---|
| Metabolites | Glutamine, Glucose, Cholesterol Linoleate | PELDI-MS | Diagnosis | AUC: 0.901-0.902; Accuracy: 82.8-83.1% |
| Extracellular Vesicle miRNAs | miR-21-3p, miR-26a-5p, miR-130a-3p, miR-139, miR-219a-5p | Various EV isolation methods + PCR/qPCR | Diagnosis | Consistent differential abundance in multiple studies |
| Soluble Immune Checkpoints | sPD-1, sPD-L1, sLAG-3 (elevated in MMR-deficient) | Multiplex immunoassay | Prognosis/Prediction | Associated with MMR status, LVSI, advanced stage |
| Soluble Immune Checkpoints | sTIM-3, sCD27, sHVEM, sCD40 (elevated with LVSI) | Multiplex immunoassay | Prognosis | Associated with adverse pathological features |
Experimental Protocols for Biomarker Validation
PELDI-MS Analysis of Serum Metabolites
Sample Preparation Protocol:
- Sample Collection: Collect peripheral venous blood following standard phlebotomy procedures. Process samples within 2 hours of collection.
- Serum Separation: Centrifuge blood samples at 1,500-2,000 × g for 10 minutes at 4°C. Carefully transfer the supernatant (serum) to clean polypropylene tubes.
- Sample Storage: Aliquot serum and store at -80°C until analysis. Avoid repeated freeze-thaw cycles.
- Sample Application: Thaw frozen serum samples on ice. Vortex briefly for 5-10 seconds. Spot 0.5-1.0 μL of serum directly onto the PELDI-MS chip microarray without additional processing.
PELDI-MS Analysis Protocol:
- Chip Loading: Load the prepared PELDI-MS chip containing the ferric oxide particle microarray into the mass spectrometer instrument chamber.
- Instrument Calibration: Calibrate the mass spectrometer using appropriate molecular weight standards according to manufacturer specifications.
- Laser Desorption/Ionization: Apply pulses of laser light to cause rapid excitation and vaporization of the crystalline matrix, generating a plume of matrix and analyte ions.
- Spectral Acquisition: Accumulate signals from several hundred laser pulses to generate comprehensive mass/charge (m/z) spectra. Automatically track the laser across the complete spot area to ensure sampling of optimal "sweet spots" where co-crystallization is most homogeneous.
- Data Extraction: Extract peak intensities and m/z values using instrument software with consistent parameters across all samples.
Machine Learning Workflow for Metabolic Pattern Recognition
Data Preprocessing:
- Peak Alignment: Align mass spectral peaks across all samples to account for minor instrumental variations.
- Normalization: Apply total ion count or quantile normalization to correct for technical variations in sample processing and analysis.
- Feature Selection: Identify m/z features with coefficients of variation <30% across technical replicates to ensure data quality.
Pattern Recognition and Biomarker Identification:
- Differential Analysis: Apply statistical tests (e.g., t-tests, ANOVA) to identify m/z features significantly different between EC and control groups.
- Machine Learning Modeling: Implement supervised learning algorithms (e.g., random forest, support vector machines) using the significant metabolic features.
- Model Validation: Validate model performance using cross-validation and independent test sets to ensure generalizability.
- Metabolite Identification: Identify specific metabolites corresponding to significant m/z features using accurate mass matching and tandem MS fragmentation when available.
PELDI-MS Biomarker Validation Workflow: This diagram illustrates the comprehensive process from sample collection to validated biomarker panel, highlighting key stages including PELDI-MS analysis and machine learning components.
Protocol for Extracellular Vesicle Biomarker Analysis
EV Isolation and Characterization:
- Sample Collection: Collect blood in EDTA or citrate tubes. Process within 30 minutes by centrifugation at 2,500 × g for 15 minutes to obtain platelet-poor plasma.
- EV Isolation: Use differential ultracentrifugation (100,000 × g for 70 minutes) or commercial precipitation kits following manufacturer protocols.
- EV Characterization: Characterize isolated EVs using nanoparticle tracking analysis for size distribution, electron microscopy for morphology, and Western blotting for EV markers (CD63, CD9, CD81, TSG101).
EV Biomarker Analysis:
- RNA Extraction: Isolate total RNA from EV preparations using commercial kits with modifications for small RNAs.
- miRNA Quantification: Perform reverse transcription and quantitative PCR for specific miRNAs of interest using appropriate reference genes for normalization.
- Protein Analysis: Quantify EV-associated proteins using multiplex immunoassays or Western blotting with specific antibodies.
The Scientist's Toolkit: Essential Research Reagents and Materials
Table 3: Essential Research Reagent Solutions for High-Performance Biomarker Validation
| Reagent/Material | Function | Application Examples | Key Considerations |
|---|---|---|---|
| Ferric Oxide Particles | Matrix for metabolite trapping and ionization | PELDI-MS analysis of serum metabolites | Provides high salt/protein tolerance, homogeneous crystallization |
| Stable Isotope-Labeled Standards | Internal standards for quantitative mass spectrometry | Absolute quantification of metabolites | Corrects for matrix effects, enables precise quantification |
| EV Isolation Kits | Precipitation-based extracellular vesicle isolation | miRNA and protein biomarker studies from biofluids | Yield and purity vary between kits; requires characterization |
| Multiplex Immunoassay Kits | Simultaneous quantification of multiple analytes | Soluble immune checkpoint profiling | Enables comprehensive immune profiling from small sample volumes |
| miRNA Extraction Kits | Isolation of small RNA species from EV preparations | EV miRNA biomarker studies | Optimized for low concentration small RNA molecules |
| Cell Culture Media | In vitro functional validation of biomarkers | Assessment of metabolite effects on EC cell behavior | Should reflect physiological conditions when possible |
Integration with Independent Cohort Validation
The successful application of PELDI-MS and complementary platforms in endometrial cancer biomarker research provides a robust framework for validation in independent cohorts. Several considerations are essential for such validation studies:
Cohort Design Considerations:
- Include sufficient sample size to ensure statistical power for biomarker validation
- Incorporate diverse patient populations to assess generalizability
- Collect comprehensive clinical metadata for subgroup analyses
- Standardize sample collection, processing, and storage protocols across participating sites
Analytical Validation Parameters:
- Assess analytical precision (intra- and inter-assay variability)
- Determine linearity, limit of detection, and limit of quantification
- Evaluate sample stability under various storage conditions
- Establish reference intervals for biomarker levels in control populations
Clinical Validation Endpoints:
- Determine diagnostic sensitivity and specificity in the independent cohort
- Assess correlation with clinical parameters (stage, grade, molecular subtypes)
- Evaluate prognostic value through longitudinal follow-up
- Validate predictive value for treatment response when applicable
The integration of PELDI-MS and other high-performance platforms into endometrial cancer biomarker validation provides unprecedented opportunities to advance diagnostic precision and patient stratification. These technologies enable comprehensive molecular profiling with the rigor and throughput required for robust multi-center validation studies, ultimately supporting the translation of biomarker discoveries into clinical practice.
Navigating Validation Challenges: Technical and Biological Pitfalls in Endometrial Biomarker Studies
In the field of endometrial cancer research, the validation of biomarkers in independent cohorts represents a critical pathway toward clinical translation. However, the successful identification and verification of robust biomarkers are profoundly influenced by pre-analytical factors—those variables introduced during sample collection, processing, and storage before analysis. Estimates suggest that pre-analytical variables can account for a significant majority of errors encountered in laboratory testing processes [44]. For complex multi-center studies validating endometrial biomarkers, such as those investigating microsatellite instability (MSI) and copy-number-low (CN-low) endometrial adenocarcinomas, standardized protocols are not merely beneficial but essential for generating reproducible and reliable data [45] [20].
The challenge is particularly acute in endometrial cancer research, where the development of non-invasive diagnostic and prognostic tools remains an unmet clinical need [6]. Biomarker studies often utilize blood-derived samples (serum and plasma) and urine, but the metabolic integrity of these samples can be compromised by seemingly minor technical variations [46]. This application note provides detailed standard operating procedures (SOPs) for sample handling, specifically framed within the context of validating endometrial cancer biomarkers across independent cohorts, to minimize pre-analytical variation and enhance research reproducibility.
Critical Pre-analytical Variables in Biomarker Studies
Blood Sample Collection and Processing
The collection of blood samples represents the first critical juncture where pre-analytical variation can be introduced. The choice between serum and plasma has significant implications for downstream analyses, as each matrix offers distinct advantages and challenges for biomarker discovery and validation.
Table 1: Comparison of Blood Collection Tubes for Biomarker Research
| Tube Type | Additive | Advantages | Limitations | Recommended Applications |
|---|---|---|---|---|
| Serum Tube | No additive (allows clotting) | Higher overall sensitivity for some metabolites; removal of clotting proteins reduces protein load [46] | Clotting process must be tightly controlled to minimize enzymatic reactions and metabolomic alterations; potential release of metabolites from blood cells during clotting [46] | Metabolite profiling where higher sensitivity is required; studies not focused on coagulation factors |
| EDTA Plasma Tube | EDTA (anticoagulant) | Quicker processing; better reproducibility due to absence of clotting process; richer lipid profile [46] [47] | Potential ion suppression/enhancement in MS; not suitable for analyzing sarcosine [46] | Lipidomics; proteomics; general biomarker discovery |
| Heparin Plasma Tube | Heparin (anticoagulant) | Suitable for a wide range of metabolites; increased detection of metabolites in untargeted approaches [46] | May interfere with some types of assays, particularly PCR-based methods [47] | Untargeted metabolomics; not recommended for genomic applications |
| Citrate Plasma Tube | Sodium citrate (anticoagulant) | Standard for coagulation studies | Impedes analysis of citric acid and its derivatives; cations can cause ion suppression in MS [46] | Coagulation-focused studies; not recommended for metabolomics |
The selection of blood collection tubes must be consistent throughout a study, and all materials should be purchased from the same manufacturer to avoid inter-sample variability due to chemicals released from the tubes and containers [46]. For endometrial biomarker research focused on validation across independent cohorts, EDTA plasma tubes are often recommended as they provide a balance of usability and analytical coverage for various biomarker types [47].
Sample Processing Protocols
Proper sample processing immediately following collection is crucial for maintaining sample integrity. Variations in processing time, temperature, and centrifugation conditions can significantly alter biomarker stability and detectability.
Table 2: Sample Processing Parameters and Their Impacts
| Processing Parameter | Optimal Condition | Impact of Deviation | Evidence |
|---|---|---|---|
| Clotting Time (Serum) | 30-60 minutes at room temperature [47] | <30 min: retention of cellular elements; >60 min: lysis of cells in clot, releasing cellular components [47] | Serum samples allowed to sit less than 30 minutes retain cellular elements, while those sitting longer than 60 minutes experience cell lysis [47] |
| Centrifugation Conditions | 1400 g for 10 minutes at 4°C [20] | Incomplete separation of cells; hemolysis; release of cellular contaminants | Standardized in endometriosis biomarker studies following WERF EPHect protocols [20] |
| Processing to Storage Time | ≤1 hour [20] | Degradation of unstable biomarkers; changes in metabolite profiles | Implemented in endometriosis biobanking protocols to minimize pre-analytical variation [20] |
| Temperature During Processing | Room temperature (serum clotting); 4°C (centrifugation) [46] [47] | Protein degradation; enzyme activity alterations; impacted metabolite stability | Protein stability and enzyme activity are temperature-dependent [47] |
Storage and Handling Conditions
Long-term storage conditions and handling practices profoundly impact sample quality and the stability of biomarkers. Proper storage is particularly important for endometrial cancer biomarker validation studies that may extend over several years and involve multiple analytical batches.
Samples should be aliquoted into smaller volumes to avoid repeated freeze-thaw cycles, which have a dramatic negative effect on sample quality [47]. The recommended long-term storage temperature is at least -80°C, with some evidence suggesting liquid nitrogen storage may be optimal for protein stability, though -80°C is more practical for most facilities [47]. The implementation of a sample tracking system that records freeze-thaw cycles is essential for quality control.
Experimental Protocols for Pre-analytical Validation
Protocol: Validation of Sample Collection Procedures
Objective: To establish and verify that sample collection procedures do not introduce significant variability in endometrial biomarker measurements.
Materials:
- Blood collection tubes (per Table 1 recommendations)
- Tourniquet, needles, and other standard phlebotomy equipment
- Timer
- Temperature-monitored centrifuge
- Cryogenic vials for aliquoting
- -80°C freezer
Methodology:
- For method comparison, collect blood from a minimum of 10 healthy volunteers using different tube types (serum, EDTA plasma, heparin plasma) following manufacturer guidelines.
- Process samples according to established parameters (Table 2), noting any visible hemolysis.
- Aliquot samples into cryovials and store at -80°C.
- Analyze samples in a single batch for candidate endometrial biomarkers (e.g., CA-125, VEGF, Annexin V) using standardized assays [20].
- Calculate intra-individual coefficients of variation across tube types and processing conditions.
Quality Control: Document any deviations from protocol, including extended processing times or visible hemolysis. Exclude severely hemolyzed samples from analysis but retain them for method development [47].
Protocol: Stability Testing Under Different Storage Conditions
Objective: To determine the stability of endometrial biomarkers under various storage conditions and freeze-thaw cycles.
Materials:
- Pooled plasma/serum samples from consented donors
- -80°C freezer
- -20°C freezer
- Liquid nitrogen storage system
- Cryovials
Methodology:
- Prepare a large pool of plasma or serum from multiple donors to ensure sufficient volume for all experiments.
- Aliquot into cryovials and subject to different storage conditions:
- -80°C (control)
- -20°C
- Liquid nitrogen vapor phase
- Multiple freeze-thaw cycles (1, 3, 5 cycles)
- Store samples for predetermined intervals (1 week, 1 month, 3 months, 6 months, 1 year).
- Analyze all samples in a single batch to eliminate inter-assay variability.
- Compare biomarker concentrations across conditions using appropriate statistical methods.
Research Reagent Solutions for Pre-analytical Standardization
Table 3: Essential Research Reagents for Standardized Sample Processing
| Reagent/Equipment | Function | Application Notes |
|---|---|---|
| EDTA Blood Collection Tubes | Anticoagulation for plasma separation | Preferred for multi-omics approaches; provides balance between analyte coverage and practical considerations [46] [47] |
| Serum Clotting Tubes | Blood collection without anticoagulant | Use without separator gel for metabolomics; ensure consistent clotting time [46] |
| Protease Inhibitor Cocktails | Inhibition of proteolytic degradation | Critical for protein biomarker preservation; must be validated for specific analytes |
| Cryogenic Vials | Long-term sample storage | Use internally-threaded vials to prevent contamination; pre-label with solvent-resistant labels |
| Temperature Monitoring Systems | Documentation of storage conditions | Essential for chain of custody documentation; required for biomarker validation studies |
Visualizing Pre-analytical Workflows
The following diagrams illustrate standardized workflows for sample processing to minimize pre-analytical variation in endometrial biomarker studies.
Sample Processing Workflow for Serum
Sample Processing Workflow for Plasma
Application to Endometrial Cancer Biomarker Validation
The implementation of rigorous SOPs for sample collection, processing, and storage is particularly critical in the context of endometrial cancer biomarker validation. Studies have demonstrated that technical and biological variability significantly impact the performance of biomarker panels initially showing promise [20]. For instance, in the validation of biomarkers for endometriosis (a condition with diagnostic challenges similar to endometrial cancer), previously reported prediction models showed considerably lower performance when applied in technical verification and independent validation settings [20].
The integration of molecular classification in endometrial cancer, such as The Cancer Genome Atlas (TCGA) subtypes, further emphasizes the need for standardized pre-analytical procedures [45] [6]. When validating biomarkers for microsatellite instability (MSI) and copy-number-low (CN-low) endometrial adenocarcinomas, consistency in sample handling ensures that molecular signatures remain intact and detectable across independent cohorts [45]. Furthermore, the development of non-invasive diagnostic tools based on extracellular vesicles or circulating biomarkers requires exceptional attention to pre-analytical details to avoid introducing artifacts that could compromise clinical translation [14].
Standardized protocols for sample collection, processing, and storage are fundamental to the successful validation of endometrial cancer biomarkers in independent cohort research. By implementing the SOPs outlined in this application note, researchers can significantly reduce pre-analytical variation, enhance reproducibility, and accelerate the translation of promising biomarkers from discovery to clinical application. As the field moves toward increasingly sophisticated multi-omics approaches and liquid biopsy technologies, rigorous attention to these fundamental pre-analytical principles will become even more critical for generating reliable and clinically actionable data.
The dynamic nature of the human endometrium, which undergoes profound molecular changes throughout the menstrual cycle, presents a significant challenge for biomarker discovery and validation [21] [48]. Hormonal fluctuations drive extensive transcriptomic, proteomic, and metabolomic alterations that can mask disease-specific signals, leading to poor reproducibility across studies [48]. Research indicates that menstrual cycle progression can obscure the identification of genuine endometrial biomarkers, with one systematic review finding that 31.43% of transcriptomic studies failed to register the menstrual cycle phase of collected samples [21]. This methodological inconsistency contributes substantially to the replication crisis in endometrial omics research, where studies investigating the same pathology show minimal overlap in identified candidate genes [48].
When validating endometrial biomarkers in independent cohorts, researchers must account for menstrual cycle phase as a critical biological confounder. The hormonal variations across phases significantly impact endometrial gene expression profiles, potentially leading to both false-positive and false-negative findings if not properly controlled [21] [48]. This Application Note provides detailed protocols and analytical frameworks for managing menstrual cycle-related confounders, enabling more robust validation of endometrial biomarkers in independent cohort studies.
Menstrual Cycle Phase Determination: Methodological Considerations and Protocols
Accurate determination of menstrual cycle phase is fundamental to controlling for its confounding effects. Multiple methodologies exist, each with varying degrees of precision, cost, and practical implementation requirements.
Method Comparison and Performance
Table 1: Methods for Menstrual Cycle Phase Determination in Endometrial Research
| Method | Procedure | Accuracy Considerations | Practical Implementation | Best Use Cases |
|---|---|---|---|---|
| Self-Report (Count Methods) | Forward calculation from last menstrual period or backward calculation from next expected menses [49] | Error-prone; assumes prototypical cycle length; high misclassification risk [49] [50] | Low cost, low burden; 76% of studies use projection methods [49] | Initial screening; large cohort studies where other methods are impractical |
| Hormone Level Ranges | Comparison of serum/saliva hormone levels (E2, P4, LH) to reference ranges [49] [51] | Variable accuracy depending on established ranges; single timepoint provides limited information [49] | Moderate cost; requires laboratory capabilities; 19% of studies use this method [49] | Phase confirmation in combination with other methods |
| Urine LH Testing | Detection of luteinizing hormone surge in urine to identify ovulation [50] | Precisely identifies ovulation; does not confirm subsequent luteal phase function [50] | Moderate cost; can be performed at home; used in 34% of studies [50] | Precise ovulation timing for peri-ovulatory studies |
| Serial Hormone Monitoring | Repeated hormone measurements across the cycle [49] [51] | High accuracy; captures hormonal dynamics; gold standard for phase determination [49] | High cost and participant burden; used in <10% of studies [49] [50] | High-precision research; biomarker validation studies |
Reference Values for Hormone-Based Phase Determination
Table 2: Serum Hormone Reference Values for Menstrual Cycle Phase Determination (Elecsys Assays) [51]
| Cycle Phase/Subphase | Estradiol (pmol/L) Median (5th-95th percentile) | Progesterone (nmol/L) Median (5th-95th percentile) | LH (IU/L) Median (5th-95th percentile) |
|---|---|---|---|
| Early Follicular | 198 (114-332) | 0.212 (0.159-0.616) | 7.14 (4.78-13.2) |
| Late Follicular | >200 | <2 | 5-25 |
| Ovulation | 757 (222-1959) | 1.81 (0.175-13.2) | 22.6 (8.11-72.7) |
| Mid-Luteal | 412 (222-854) | 28.8 (13.1-46.3) | 6.24 (2.73-13.1) |
Experimental Protocol: Comprehensive Menstrual Cycle Phase Determination
Objective: To accurately determine menstrual cycle phase through multimodal assessment for endometrial biomarker studies.
Materials:
- Serum collection tubes
- Elecsys LH, Estradiol III, and Progesterone III assays or equivalent
- Urinary LH detection kits
- Menstrual cycle tracking forms
- Standardized phlebotomy equipment
Procedure:
Initial Assessment and Recruitment
- Record participant's self-reported menstrual cycle history including typical cycle length, regularity, and first day of last menstrual period
- Exclude participants with known menstrual disorders, hormonal medication use, or conditions affecting cycle regularity
- Obtain informed consent for serial sample collection
Sample Collection Timeline
- Schedule initial blood draw during early follicular phase (days 3-5 of cycle)
- Provide urinary LH kits with instructions for daily testing beginning day 10
- Schedule subsequent blood draws based on LH surge detection:
- Pre-ovulatory: Rising LH levels
- Post-ovulatory: 3-5 days after LH surge
- Mid-luteal: 7-9 days after LH surge
Hormonal Analysis
- Process serum samples within 2 hours of collection
- Analyze estradiol, progesterone, and LH levels using standardized, validated assays
- Run quality controls with each batch
Phase Determination Algorithm
- Follicular Phase: Low progesterone (<2 nmol/L), variable estradiol
- Ovulatory Phase: LH surge (>25 IU/L) with rising estradiol
- Luteal Phase: Elevated progesterone (>13.1 nmol/L for mid-luteal)
- Cycle-specific normal ranges should be established for each study population
Documentation and Quality Control
- Record all phase determination data in standardized format
- Implement blinding procedures for laboratory personnel
- Establish criteria for cycle exclusion (e.g., anovulatory cycles, hormonal outliers)
Statistical Correction of Menstrual Cycle Effects in Transcriptomic Studies
When precise phase determination is not feasible for existing datasets, statistical methods can correct for menstrual cycle effects in endometrial omics data.
Impact of Menstrual Cycle Correction on Biomarker Discovery
Table 3: Effect of Menstrual Cycle Bias Correction on Differential Gene Expression Analysis [21]
| Study Condition | Number of DEGs Without Correction | Number of DEGs After Cycle Correction | Percentage Increase | Key Findings |
|---|---|---|---|---|
| Eutopic Endometriosis | Baseline | +544 novel candidate genes | 44.2% average increase across studies | Correction revealed previously masked disease biomarkers |
| Ectopic Ovarian Endometriosis | Baseline | +158 novel candidate genes | Substantial improvement in signal detection | Improved separation of disease effects from normal cyclical variation |
| Recurrent Implantation Failure | Baseline | +27 novel candidate genes | Enhanced statistical power | Identified subtle but pathologically relevant expression changes |
Experimental Protocol: Computational Removal of Menstrual Cycle Effects
Objective: To remove menstrual cycle-associated variation from endometrial transcriptomic data while preserving disease-specific signals.
Materials:
- R statistical environment (v4.0.0 or higher)
- limma R package (v3.30.13 or higher)
- Normalized gene expression data from endometrial samples
- Sample metadata including menstrual cycle phase
Procedure:
Data Preprocessing
- Normalize raw gene expression data using quantile normalization
- Annotate probesets with current gene symbols using biomaRt R package
- Perform exploratory analysis to detect batch effects and outliers
Menstrual Cycle Effect Visualization
- Conduct Principal Component Analysis (PCA) to visualize cycle-related variation
- Confirm that menstrual cycle phase represents a major source of variation (typically PC1 or PC2)
Linear Model Correction
Differential Expression Analysis
- Perform case versus control comparisons using corrected and uncorrected data
- Apply false discovery rate (FDR) correction (Benjamini-Hochberg method)
- Use FDR < 0.05 as significance threshold
Validation and Power Assessment
- Compare number of significant DEGs before and after correction
- Validate findings in independent cohorts when possible
- Assess statistical power using power analysis methods
Advanced Methodologies for Endometrial Biomarker Validation
Endometrial Failure Risk Signature: A Case Study in Cycle-Independent Biomarker Discovery
A recent multicenter prospective study developed an Endometrial Failure Risk (EFR) signature that identifies endometrial disruptions independent of luteal phase timing [52]. This approach demonstrates how cycle-independent biomarkers can be validated across cohorts.
Key Methodology:
- Collected endometrial biopsies in the mid-secretory phase from 281 women
- Applied menstrual cycle timing correction to gene expression data of 404 genes
- Stratified patients into poor (n=137) and good (n=49) endometrial prognosis groups
- Validated against reproductive outcomes after single embryo transfer
Performance Metrics:
- Accuracy: 0.92 (0.88-0.94)
- Sensitivity: 0.96 (0.91-0.98)
- Specificity: 0.84 (0.77-0.88)
- Relative risk of endometrial failure: 3.3 times higher in poor prognosis group
Protocol for Validating Cycle-Stable Biomarker Signatures
Objective: To validate endometrial biomarker signatures in independent cohorts while controlling for menstrual cycle effects.
Materials:
- Independent cohort with standardized sample collection
- RNA extraction and quality control tools
- Pre-defined biomarker signature
- Clinical outcome data
Procedure:
Cohort Selection and Sample Collection
- Recruit independent validation cohort with sufficient power
- Collect endometrial biopsies using standardized protocols
- Record detailed menstrual cycle history and use hormonal confirmation
- Ensure consistent sample processing across collection sites
Molecular Profiling and Data Generation
- Extract high-quality RNA (RIN >7.0)
- Perform transcriptomic profiling using platform consistent with discovery cohort
- Apply rigorous quality control metrics
Data Preprocessing and Normalization
- Normalize data using same methods as original study
- Apply menstrual cycle correction algorithm if appropriate
- Scale data to account for batch effects between cohorts
Signature Application and Validation
- Apply pre-defined biomarker signature to validation cohort
- Calculate risk scores for each participant
- Assess prediction accuracy against clinical outcomes
- Determine sensitivity, specificity, PPV, and NPV in the new cohort
Table 4: Essential Research Reagents for Endometrial Biomarker Validation Studies
| Reagent/Resource | Specifications | Application | Quality Control |
|---|---|---|---|
| Serum Hormone Assays | Elecsys Estradiol III, Progesterone III, LH assays [51] | Precise menstrual cycle phase determination | Run controls with each batch; establish study-specific reference ranges |
| RNA Preservation Reagents | RNAlater or equivalent | Preserve endometrial tissue RNA integrity | Ensure RIN >7.0 for transcriptomic studies |
| Gene Expression Platforms | Microarray (Affymetrix, Illumina, Agilent) or RNA-Seq | Transcriptomic profiling of endometrial samples | Use consistent platform across discovery and validation cohorts |
| Computational Tools | R/Bioconductor packages: limma, edgeR, DESeq2 | Statistical analysis and menstrual cycle effect correction | Implement version control; document all parameters |
| Urinary LH Detection Kits | FDA-cleared ovulation prediction kits | Identification of LH surge for ovulation timing | Train participants in proper use; document timing of testing |
Visualizing Experimental Workflows and Analytical Approaches
Comprehensive Workflow for Managing Menstrual Cycle Confounders
Diagram 1: Comprehensive workflow for managing menstrual cycle confounders in endometrial biomarker studies
Menstrual Cycle Effect on Transcriptomic Data Analysis
Diagram 2: Impact and correction of menstrual cycle effects in endometrial transcriptomic studies
Effective management of menstrual cycle phase as a biological confounder is essential for robust validation of endometrial biomarkers in independent cohorts. The protocols and methodologies presented herein provide a comprehensive framework for addressing this challenge through precise phase determination, statistical correction of cycle effects, and validation of cycle-stable biomarker signatures. Implementation of these standardized approaches will enhance reproducibility, improve biomarker discovery, and accelerate the development of clinically useful diagnostic tools for endometrial disorders.
Assay robustness and reproducibility form the foundational pillars of reliable biomarker research, particularly in the validation of endometrial cancer biomarkers across independent cohorts. Reproducibility is not merely a technical requirement but a clinical imperative that underpins regulatory success, patient outcomes, and the translational potential of research findings [53]. In the context of endometrial biomarker validation, factors such as sample handling, instrumentation differences, reagent lot variations, and operator technique collectively contribute to the variability that can compromise trial outcomes and scientific credibility [53]. This application note provides a comprehensive framework for evaluating platform performance and managing lot-to-lot variability, with specific consideration for endometrial cancer research applications. By implementing structured practices for assay validation, researchers can deliver diagnostic data that are both scientifically sound and regulatory-ready, accelerating the development of non-invasive diagnostic solutions for endometrial cancer [54] [55].
Quantitative Platform Comparison for Biomarker Analysis
The selection of an appropriate analytical platform is crucial for generating reproducible data in endometrial biomarker studies. The table below summarizes the performance characteristics of key technologies used in biomarker research and clinical applications.
Table 1: Comparison of Analytical Platforms for Biomarker Validation
| Platform Type | Key Applications in Endometrial Cancer | Sensitivity | Reported Variability (CV) | Key Strengths | Key Limitations |
|---|---|---|---|---|---|
| Silicon Photonic (SiP) Biosensors [56] | Protein biomarker detection | Sub-pg mL⁻¹ to μg mL⁻¹ scale | Inter-assay CV <20% (with optimized functionalization) | Real-time, multiplexed sensing; compact format | Susceptible to microfluidic bubbles; complex fabrication |
| Next-Generation Sequencing (NGS) [57] | Whole exome/transcriptome sequencing; MSI detection | 50 ng DNA input (FFPE tissue) | >97% positive/negative agreement with comparator CDx tests | Comprehensive molecular profiling; simultaneous DNA/RNA analysis | Requires specialized bioinformatics; tissue quality dependent |
| Liquid Chromatography-Mass Spectrometry (LC-MS/MS) [58] [59] | Metabolite profiling (259 metabolites); host cell protein detection | Wide dynamic range for metabolites | High reproducibility with standardized kits (e.g., MxP Quant 500) | High specificity; wide coverage of analytes | Requires technical expertise; expensive instrumentation |
| Immunoassays [53] [60] | Protein biomarker quantification (e.g., CA-125, HE4) | Varies by target | Typically higher than physicochemical methods (exact range target-dependent) | Established protocols; high throughput | Limited multiplexing; antibody-dependent variability |
Assay variability in endometrial biomarker research arises from multiple technical and operational factors:
- Pre-analytical variation: Sample collection technique, anticoagulant type, and transport conditions can significantly shift analytical results [53]. For endometrial cancer liquid biopsy studies, standardized plasma processing protocols are essential for reproducible ctDNA and metabolomic analyses [54] [58].
- Instrumental differences: Analyzer calibration, software versions, and operator technique can cause inter-site variability in multi-center studies [53].
- Reagent lot-to-lot variability: Different reagent lots may yield slightly different activity curves, potentially affecting trial consistency if not properly managed [53] [60].
- Microfluidic operational factors: Bubble formation in microfluidic systems can damage sensor surface functionalization and interfere with sensing signals, presenting a major source of variability in biosensor platforms [56].
Strategic Approaches to Variability Mitigation
Table 2: Strategies for Managing Key Variability Sources in Endometrial Biomarker Studies
| Variability Source | Mitigation Strategy | Implementation Example |
|---|---|---|
| Reagent Lot Variability | Standardized lot distribution with bridging studies | Proactive monitoring of replicate consistency and analyzer error codes [53] |
| Operator Technique | Rigorous training with SOPs and visual job aids | Hands-on workshops for pipetting technique; increased familiarization testing periods [53] |
| Microfluidic Bubbles | Combined degassing, plasma treatment, and surfactant pre-wetting | Polydopamine-mediated, spotting-based functionalization improved detection signal 8.2× compared to flow-based approaches [56] |
| Cell-Based Assay Variability | Standardized cell culture protocols and well-characterized cell banks | Control of passage number, media composition, and incubation time; use of reference standards [61] |
| Sample Processing | Standardized collection protocols and environmental controls | For metabolomic studies, uniform plasma processing and storage at -80°C until analysis [58] |
Experimental Protocols for Assessing Reproducibility
Protocol: Reagent Lot Bridging Study
Purpose: To validate consistency between different reagent lots and ensure continuous data comparability in longitudinal endometrial biomarker studies.
Materials:
- Reference standard (well-characterized endometrial biomarker sample)
- Current and new reagent lots
- Validated analytical platform (e.g., LC-MS/MS, immunoassay platform)
- Appropriate controls
Procedure:
- Prepare identical sample sets of the reference standard using both current and new reagent lots according to established SOPs.
- Analyze samples in triplicate across multiple runs (minimum of 3 runs recommended).
- Include system suitability controls to ensure assay validity.
- Perform statistical comparison of dose-response curves between lots using parallel line analysis.
- Verify that the relative potency (RP) estimate falls within pre-defined acceptance criteria (typically 80-125% for bioassays) [60].
- Document any observed shifts in sensitivity or dynamic range.
Data Analysis: Calculate % relative potency between lots with 95% confidence intervals. Perform equivalence testing with pre-specified margins based on assay capability and clinical requirements.
Protocol: Inter-Assay Reproducibility Evaluation
Purpose: To quantify total inter-assay variability across multiple runs, operators, and days for endometrial biomarker assays.
Materials:
- Quality control samples at low, medium, and high concentrations covering the assay range
- Multiple operators (minimum of 2)
- Multiple reagent lots (if available)
Procedure:
- Design the study to include a minimum of 3 independent assay runs conducted by different operators over different days.
- In each run, analyze QC samples in triplicate using the standard assay protocol.
- Maintain consistent instrument calibration and sample processing conditions throughout.
- Record all raw data and calculated biomarker concentrations.
Data Analysis:
- Calculate the coefficient of variation (CV) for each QC level across all runs.
- Perform variance component analysis to separate sources of variability (e.g., between-run, between-operator, residual).
- For metabolomic studies, normalize data between batches using quality control samples to correct for batch effects [58].
Acceptance Criteria: Inter-assay CV should be <20% for most biomarker applications, though tighter criteria may be required for clinical decision-making [56].
Visualizing Reproducibility Assessment Workflows
Assay Validation and Quality Control Pathway
Assay Validation Workflow: This diagram illustrates the comprehensive pathway for establishing assay reproducibility, from initial validation through ongoing quality monitoring.
Variability Control Framework: This diagram maps common variability sources in endometrial biomarker research to specific control strategies, providing a systematic approach to reproducibility management.
The Scientist's Toolkit: Essential Research Reagent Solutions
Table 3: Key Reagents and Materials for Robust Endometrial Biomarker Assays
| Reagent/Material | Function | Considerations for Endometrial Biomarker Studies |
|---|---|---|
| Reference Standards [60] | Calibrate assays; enable relative potency calculations | Should be well-characterized and stable; use matched to sample matrix when possible |
| Quality Control Materials [60] | Monitor assay performance over time | Include at least two levels (low and high) covering clinically relevant range |
| Surface Functionalization Chemistries [56] | Immobilize bioreceptors on biosensor surfaces | Polydopamine-mediated spotting improved signal 8.2× vs. flow-based approaches |
| Microfluidic Surfactants [56] | Reduce bubble formation in microfluidic systems | Combine with device degassing and plasma treatment for optimal bubble mitigation |
| Cell-Based Assay Components [61] | Enable functional potency assessments | Use low-passage cells with controlled receptor density; qualify critical reagents |
| Standardized Assay Kits [58] | Provide reproducible metabolomic profiling | MxP Quant 500 kit enables absolute quantification of 628 metabolites with high reproducibility |
Ensuring assay robustness and managing lot-to-lot variability requires a systematic, multi-faceted approach, particularly in the context of endometrial biomarker validation. Key elements include rigorous training and standardization, proactive variability monitoring, strategic reagent management, and implementation of corrective and preventive action (CAPA) frameworks [53]. By adopting the protocols and strategies outlined in this application note, researchers can significantly enhance the reliability of their endometrial cancer biomarker data, facilitating successful validation in independent cohorts and ultimately contributing to improved diagnostic and therapeutic options for patients. As the field advances, emerging technologies including digital monitoring dashboards and AI-assisted quality control tools promise further improvements in reproducibility assessment and control [53].
The validation of endometrial cancer (EC) biomarkers in independent cohorts is a critical step in translating research findings into clinical practice. As the field moves towards more complex, high-dimensional data from proteomics, metabolomics, and multi-omics approaches, rigorous statistical methodology is paramount to ensure that discovered biomarkers are reliable and generalizable [6]. This application note addresses three fundamental statistical challenges—overfitting, multiple testing, and power analysis—within the context of EC biomarker research, providing practical protocols and frameworks for researchers.
The emergence of novel analytical techniques such as mass spectrometry-based metabolic profiling [9] [62] and machine learning classification of serum metabolic fingerprints [9] has increased both the potential and the complexity of EC biomarker discovery. Simultaneously, the integration of The Cancer Genome Atlas (TCGA) molecular classification into clinical practice [63] [30] has created new requirements for biomarker validation across different molecular subgroups. These advancements necessitate careful statistical planning to avoid false discoveries and ensure reproducible results.
Key Statistical Challenges in EC Biomarker Research
Overfitting in High-Dimensional Data Analysis
Overfitting occurs when a model describes random error or noise instead of the underlying relationship of interest, typically when the number of features (p) far exceeds the number of samples (n). In EC research, this challenge is particularly evident in studies using mass spectrometry-based metabolic profiling [9] [62], proteomic analyses [12] [6], and multi-omics approaches.
Recent EC biomarker studies illustrate this problem. Research using particle-enhanced laser desorption/ionization mass spectrometry (PELDI-MS) analyzed serum metabolic fingerprints from 395 participants (191 EC, 204 Non-EC) to identify diagnostic panels [9]. Without proper validation, such high-dimensional data (containing numerous metabolic features) risks producing models that fail to generalize to new populations. Similarly, studies applying machine learning to proteomic [6] and steroid profiling [62] data face comparable challenges.
The following workflow outlines a rigorous approach to prevent overfitting in biomarker studies:
Multiple Testing in Biomarker Discovery
Multiple testing problems arise when numerous statistical tests are conducted simultaneously, increasing the probability of false discoveries. In EC proteomic studies, analytical protein microarrays and mass spectrometry platforms can measure thousands of proteins simultaneously [6]. Similarly, metabolomic studies using PELDI-MS [9] or LC-MS/MS [62] generate high-dimensional data with numerous metabolic features.
The table below summarizes multiple testing correction approaches relevant to EC biomarker studies:
Table 1: Multiple Testing Correction Methods for EC Biomarker Research
| Method | Use Case | Advantages | Limitations | EC Research Example |
|---|---|---|---|---|
| Bonferroni Correction | Family-wise error rate control when number of tests is small | Simple implementation, strong control of Type I error | Overly conservative for high-dimensional data | Targeted analysis of candidate biomarkers [62] |
| Benjamini-Hochberg (FDR) | High-dimensional discovery studies (proteomics, metabolomics) | Balances discovery power with false positive control | Assumes independent or positively dependent tests | Untargeted metabolomic profiling [9] |
| Permutation-Based Methods | Complex dependency structures between biomarkers | Does not require independence assumption | Computationally intensive | Validation of metabolic biomarker panels [9] |
| Two-Stage Procedures | Large-scale screening with follow-up validation | Efficient use of samples in discovery and validation phases | Requires careful study design | Proteomic discovery with IHC validation [12] |
Power Analysis for Cohort Studies
Adequate statistical power is essential for validating EC biomarkers in independent cohorts. Underpowered studies may fail to detect clinically meaningful effects, while overpowered studies waste resources. The movement toward molecular classification of EC [63] [30] introduces additional complexity for power calculations, as researchers must consider subgroup analyses across POLE-mutated, MMR-deficient, NSMP, and p53-abnormal categories.
Key parameters for power analysis in EC biomarker studies include:
- Effect size: Based on preliminary data or clinically meaningful differences (e.g., AUC improvement from 0.75 to 0.85)
- Prevalence: Of EC molecular subtypes in the target population [63]
- Measurement variability: Technical and biological variance in biomarker assays [9] [62]
- Attrition rates: Expected loss to follow-up in prognostic studies
Recent EC studies demonstrate varied cohort sizes, from 62 EC patients in steroid profiling research [62] to 191 EC patients in metabolic fingerprinting studies [9]. The optimal sample size depends on the specific research question, biomarker type, and expected effect size.
Experimental Protocols
Protocol: Cross-Validation for Machine Learning of Metabolic Fingerprints
This protocol adapts methodologies from recent EC research using serum metabolic fingerprints (SMFs) for diagnosis [9].
3.1.1 Research Reagent Solutions
Table 2: Essential Research Reagents for Metabolic Fingerprinting
| Reagent/Material | Function | Specification | Example Application |
|---|---|---|---|
| Ferric Oxide Particles | Matrix for PELDI-MS | Defined particle size and surface chemistry | Metabolic profiling from serum samples [9] |
| Quality Control (QC) Pools | Monitoring analytical performance | Pooled representative samples | System suitability testing in LC-MS/MS [62] |
| Internal Standards | Quantification and normalization | Stable isotope-labeled metabolites | Steroid hormone quantification [62] |
| Biofluid Samples | Biomarker discovery and validation | Serum, plasma, or tissue samples | Collection of SMFs from EC and Non-EC subjects [9] |
3.1.2 Procedure
Sample Preparation
- Prepare serum samples according to standardized protocols [9]
- Apply samples to ferric oxide particle-coated chips for PELDI-MS analysis
- Include quality control samples throughout the run
Data Acquisition
- Acquire mass spectra using PELDI-MS with consistent instrument settings
- Export pre-processed data (peak picking, alignment, normalization)
Nested Cross-Validation
- Outer loop (5-fold): Split data into training (80%) and test (20%) sets
- Inner loop (3-fold): Further split training set for hyperparameter tuning
- Repeat with different random seeds to assess stability
Performance Assessment
- Calculate AUC, sensitivity, specificity on test folds
- Compute confidence intervals for performance metrics
- Compare against clinical standards (e.g., CA-125) [9]
Protocol: Validation of Biomarker Panels in Independent Cohorts
This protocol outlines steps for validating multi-biomarker panels in EC, based on approaches used for protein [12] and metabolic [9] biomarkers.
3.2.1 Procedure
Cohort Selection
- Select independent validation cohort with pre-specified inclusion/exclusion criteria
- Ensure adequate representation of EC molecular subtypes [63]
- Match cases and controls based on relevant clinical parameters
Blinded Measurement
- Perform biomarker assays blinded to clinical outcomes
- Include quality control samples with pre-established acceptance criteria
- Document any batch effects and implement correction if needed
Statistical Analysis
- Apply pre-specified statistical models without further tuning
- Calculate performance metrics (AUC, sensitivity, specificity)
- Assess calibration using goodness-of-fit tests
Clinical Utility Assessment
- Evaluate net reclassification improvement over standard care
- Perform decision curve analysis to assess clinical value
- Compare with existing biomarkers (e.g., CA-125, HE4) [62]
Case Studies and Data Presentation
Case Study: Metabolic Biomarker Panel for EC Diagnosis
Recent research identified a metabolic biomarker panel (glutamine, glucose, and cholesterol linoleate) for EC diagnosis using machine learning of serum metabolic fingerprints [9]. The following table summarizes key performance metrics and statistical considerations:
Table 3: Performance Metrics of Metabolic Biomarker Panel in EC Diagnosis
| Metric | Training Performance | Internal Validation | Independent Validation | Statistical Considerations |
|---|---|---|---|---|
| AUC | 0.957-0.968 | 0.901-0.902 | Required | Nested cross-validation used to prevent overfitting |
| Accuracy | Not reported | 82.8-83.1% | Required | Reported with confidence intervals |
| Sensitivity | Not reported | Not reported | Required | Multiple testing corrected for panel discovery |
| Specificity | Not reported | Not reported | Required | Power analysis for independent validation |
| Comparison to CA-125 | Superior (AUC 0.610-0.684) | Superior | Required | Statistical testing for comparison of AUCs |
Power Analysis for EC Biomarker Studies
The following diagram illustrates the power analysis workflow for planning EC biomarker validation studies:
Robust statistical methods are essential for validating endometrial cancer biomarkers in independent cohorts. By addressing overfitting through proper cross-validation, controlling multiple testing using appropriate correction methods, and ensuring adequate power through careful sample size calculations, researchers can enhance the reliability and translational potential of their findings. The protocols and considerations outlined in this document provide a framework for rigorous statistical practice in EC biomarker research.
As the field evolves with the integration of molecular classification [63] and novel analytical technologies [9] [62], continued attention to statistical rigor will be crucial for advancing EC diagnosis, prognosis, and treatment.
Endometriosis is an enigmatic systemic disease characterized by chronic inflammation and the presence of endometrial-like tissue outside the uterine cavity. It affects approximately 10% of reproductive-aged individuals with a uterus, causing chronic pelvic pain, infertility, and reduced quality of life [64] [65]. A critical challenge in endometriosis management is the 7-11 year diagnostic delay from symptom onset, largely attributable to the absence of non-invasive diagnostic biomarkers and the disease's profound heterogeneity [64] [65]. This application note addresses the pressing need to contextualize biomarker validation within the framework of endometriosis heterogeneity, encompassing diverse lesion phenotypes and their distinct associations with ovarian cancer histotypes.
The disease demonstrates complex heterogeneity across multiple dimensions: anatomical localization (pelvic vs. extra-pelvic), lesion characteristics (superficial, ovarian, deep infiltrating), molecular profiles, and developmental pathways [64] [66]. Furthermore, endometriosis carries an established increased risk for specific epithelial ovarian cancer (EOC) histotypes, particularly clear cell (CCOC) and endometrioid (ENOC) carcinomas [67]. Understanding these heterogeneous dimensions is paramount for developing accurate diagnostic biomarkers and targeted therapeutic interventions.
Disease Heterogeneity: Classification and Molecular Subtypes
Anatomical and Lesion Heterogeneity
Endometriosis manifests through distinct lesion types with characteristic anatomical distributions and clinical implications. The table below summarizes the primary lesion phenotypes and classification systems used to categorize disease severity.
Table 1: Endometriosis Lesion Phenotypes and Classification Systems
| Feature | Superficial Peritoneal Endometriosis (SPE) | Ovarian Endometriomas (OMA) | Deep Infiltrating Endometriosis (DIE) |
|---|---|---|---|
| Description | Superficial implants on peritoneal surfaces | Cystic lesions on ovaries filled with old blood ("chocolate cysts") | Infiltration >5 mm into pelvic structures |
| Common Locations | Pelvic peritoneum | Ovaries | Uterosacral ligaments, rectovaginal septum, bladder, bowel |
| Clinical Associations | Often milder symptoms; may be asymptomatic | Pelvic pain, dysmenorrhea; associated with infertility | Severe chronic pelvic pain, dyspareunia, organ dysfunction |
| rASRM Stage Correlation | Typically I-II | Often III-IV | Typically III-IV |
Multiple classification systems exist to characterize endometriosis severity, though none perfectly correlates with symptom burden:
- rASRM System: Most widely used; stages disease from minimal (I) to severe (IV) based on lesion location, extent, and adhesion formation [64].
- ENZIAN Classification: Focuses specifically on deep infiltrating endometriosis and retroperitoneal structures [64].
- AAGL Classification: Reports surgical complexity with correlations to patient-reported pain symptoms [64].
- Endometriosis Fertility Index (EFI): Predicts non-IVF fertility outcomes post-surgery [64].
A more descriptive classification system has been proposed that differentiates between reproductive organ ("genital") and non-reproductive organ ("extragenital") disease, each with four severity stages (minimal to severe) [64]. This system acknowledges that different locations and niche environments may contribute to altered pathophysiology.
Molecular and Cellular Heterogeneity
Recent single-cell RNA sequencing studies have revealed unprecedented resolution of cellular heterogeneity within endometriotic lesions. Key findings include:
- Fibroblast Heterogeneity: Integration of single-cell and spatial transcriptomics has identified five distinct fibroblast subpopulations in endometriosis lesions, with the CXCR4+ fibroblast subpopulation exhibiting high proliferative capacity, stemness characteristics, and mediation of signaling pathways involved in immune and fibrotic responses through FN1 [68].
- Immune Microenvironment: The peritoneal immune landscape in endometriosis shows altered macrophage polarization, reduced natural killer (NK) cell cytotoxicity, and increased neutrophil extracellular traps (NETs) [69] [66].
- Stem Cell Involvement: Endometrial mesenchymal stem cells (eMSCs) and epithelial progenitors (eEPs) contribute to lesion establishment through enhanced adhesive, proliferative, and differentiation capacities [66].
Genetic Architecture and Ovarian Cancer Associations
Genetic Correlations with Ovarian Cancer Histotypes
Large-scale genetic studies have established significant genetic correlations between endometriosis and specific epithelial ovarian cancer histotypes. The table below summarizes these genetic relationships based on linkage disequilibrium score regression (LDSC) and high-definition likelihood inference (HDL) analyses.
Table 2: Genetic Correlations Between Endometriosis and Ovarian Cancer Histotypes
| Ovarian Cancer Histotype | Genetic Correlation (LDSC) | Genetic Correlation (HDL) | Mendelian Randomization OR |
|---|---|---|---|
| Clear Cell (CCOC) | 0.71 (p=0.007) | 0.58 (p=1.01×10⁻⁸) | 2.59 (2.09-3.21) |
| Endometrioid (ENOC) | 0.48 (p=0.016) | 0.42 (p=4.20×10⁻⁵) | 1.66 (1.42-1.93) |
| High-Grade Serous (HGSOC) | 0.19 (p=0.033) | 0.13 (p=0.018) | 1.14 (1.07-1.22) |
| Low Malignant Potential Serous | 0.88 (p=0.401) | 0.23 (p=7.21×10⁻³) | 1.22 (1.03-1.45) |
Mendelian randomization analyses demonstrate that genetic liability to endometriosis confers causal risk for CCOC, ENOC, and HGSOC, with directionality from endometriosis to EOC risk rather than vice versa [67]. Bivariate meta-analysis has identified 28 loci associated with both endometriosis and EOC, including 19 with evidence for a shared underlying association signal [67].
Combinatorial Genetic Risk Factors
Beyond conventional GWAS approaches, combinatorial analytics have identified 1,709 disease signatures comprising 2,957 unique SNPs in combinations of 2-5 SNPs associated with endometriosis risk [70]. These signatures implicate biological pathways including:
- Cell adhesion, proliferation, and migration
- Cytoskeleton remodeling
- Angiogenesis
- Fibrosis and neuropathic pain
Notably, 75 novel gene associations were identified through this approach, providing new insights into potential links between endometriosis and processes such as autophagy and macrophage biology [70].
Experimental Protocols for Biomarker Validation
Protocol 1: Machine Learning Framework for Diagnostic Biomarker Discovery
Purpose: To identify and validate neutrophil extracellular trap (NET)-related diagnostic biomarkers for endometriosis using multiple machine learning algorithms.
Experimental Workflow:
Data Acquisition and Preprocessing:
- Obtain gene expression datasets from GEO database (e.g., GSE141549, GSE7305).
- Identify differentially expressed genes (DEGs) using limma package in R (absolute log₂FC >1.5, FDR-adjusted p<0.05).
- Intersect DEGs with neutrophil extracellular trap (NET)-related genes (n=271) to identify DE-NETRGs.
Functional Enrichment Analysis:
- Perform Gene Ontology (GO) and KEGG pathway analysis using ClusterProfiler.
- Construct protein-protein interaction (PPI) networks using STRING database and Cytoscape.
Machine Learning Model Construction:
- Apply 13 machine learning algorithms (Lasso, Stepglm, SVM, Random Forest, etc.) to construct 107 distinct models.
- Select optimal model based on area under the curve (AUC) evaluation.
- Identify core diagnostic biomarkers (CEACAM1, FOS, PLA2G2A, THBS1) [69].
Model Validation:
- Develop diagnostic nomogram using multivariate logistic regression.
- Evaluate model performance with ROC curves, calibration plots, and decision curve analysis.
- Assess generalization capability through 10-fold cross-validation.
Figure 1: Machine learning workflow for endometriosis biomarker discovery.
Protocol 2: Single-Cell and Spatial Transcriptomics for Microenvironment Characterization
Purpose: To characterize cellular heterogeneity and cell-cell communication networks in endometriosis lesions using integrated single-cell and spatial transcriptomics.
Experimental Workflow:
Sample Preparation and Sequencing:
- Collect endometriosis lesions from patients (n=15) with appropriate ethical approval.
- Process tissue for single-cell RNA sequencing using 10x Genomics platform.
- Perform spatial transcriptomics on tissue sections.
Data Preprocessing and Quality Control:
- Process raw data using Seurat R package (v4.3.0).
- Apply quality thresholds: nFeatureRNA (300-5000), nCountRNA (500-40,000), mitochondrial content (<25%).
- Remove doublets using DoubletFinder (v2.0.3).
- Correct batch effects using Harmony package.
Cell Clustering and Annotation:
- Perform dimensionality reduction (PCA, UMAP) and cluster identification.
- Annotate cell types based on canonical marker genes.
- Extract fibroblast subsets for subclustering and identification of transcriptionally distinct subpopulations.
Fibroblast Heterogeneity Analysis:
- Identify differentially expressed genes among fibroblast subpopulations.
- Perform trajectory inference (Monocle2, Slingshot) and stemness analysis (CytoTRACE).
- Conduct transcription factor regulation analysis (pySCENIC) and metabolic pathway assessment.
Cell-Cell Communication and Spatial Validation:
- Infer communication networks using CellChat.
- Validate spatial distribution of key ligand-receptor interactions.
- Perform functional validation through in vitro siRNA knockdown of identified targets (e.g., CXCR4).
Figure 2: Single-cell and spatial transcriptomics workflow for microenvironment characterization.
Protocol 3: Inflammatory Biomarker Profiling Across Disease Phenotypes
Purpose: To evaluate associations between circulating inflammatory biomarkers and specific endometriosis characteristics.
Experimental Workflow:
Study Population and Sample Collection:
- Recruit participants from well-characterized cohorts (e.g., A2A, ENDOX, ENDO studies).
- Collect blood samples with standardized protocols.
- Document detailed lesion characteristics: macrophenotype (superficial, deep, endometrioma), appearance (color, vascularity), anatomic location.
Biomarker Measurement:
- Measure 11 inflammatory biomarkers including IL-1β, IL-6, IL-8, IL-10, IL-16, TNF-α, TARC, MCP-1, MCP-4, IP-10, and CRP using multiplex immunoassays.
- Implement appropriate quality controls and standardization across batches.
Statistical Analysis:
- Evaluate variation in inflammatory markers by lesion characteristics using multivariate regression models.
- Adjust for potential confounders: age, BMI, hormonal medication use, pain medication use.
- Assess associations with rASRM stage and specific lesion locations.
This approach has revealed nominally significant variation in circulating inflammatory markers by lesion color, vascularity, and location, though not with rASRM stage or macrophenotype [71].
The Scientist's Toolkit: Research Reagent Solutions
Table 3: Essential Research Reagents for Endometriosis Biomarker Studies
| Reagent/Category | Specific Examples | Application/Function | Considerations |
|---|---|---|---|
| scRNA-seq Platforms | 10x Genomics Chromium | Single-cell transcriptome profiling | Enables identification of novel fibroblast subpopulations (e.g., CXCR4+) [68] |
| Spatial Transcriptomics | 10x Visium, Slide-seq | Gene expression in tissue context | Validates spatial distribution of identified cell populations [68] |
| Bioinformatics Tools | Seurat, Monocle2, CellChat | scRNA-seq data analysis, trajectory inference, cell-cell communication | Requires computational expertise; use Harmony for batch correction [68] |
| Machine Learning Algorithms | Stepglm [backward], Random Forest, SVM | Diagnostic model construction, biomarker selection | Combining multiple algorithms improves predictive accuracy [69] |
| Inflammatory Biomarker Panels | Luminex, ELLA, MSD | Multiplex cytokine/chemokine quantification | Standardize collection protocols across cohorts [71] |
| Cell Lines | ihESC, hEM15A | In vitro functional validation | Confirm identified mechanisms (e.g., CXCR4 knockdown) [68] |
Discussion and Future Perspectives
The complex heterogeneity of endometriosis necessitates refined approaches to biomarker validation that account for diverse disease phenotypes and their distinct molecular signatures. Key considerations include:
- Stratified Validation Cohorts: Biomarker studies must stratify patients by specific lesion characteristics (SPE, OMA, DIE), anatomic locations, and molecular subtypes to identify biomarkers with specificity for particular disease manifestations.
- Integrated Multi-Omic Approaches: Combining genomic, transcriptomic, proteomic, and spatial data provides complementary insights into disease mechanisms and enhances biomarker discovery.
- Combinatorial Genetic Analysis: Moving beyond single-variant GWAS approaches to combinatorial genetic analysis reveals novel gene associations and biological pathways relevant to endometriosis pathogenesis [70].
- Cancer Risk Stratification: Validated biomarkers should ideally inform not only diagnostic and therapeutic decisions but also ovarian cancer risk stratification, particularly for clear cell and endometrioid subtypes.
Future directions should emphasize the development of biomarker panels that integrate inflammatory markers, genetic risk scores, and molecular subtype classifications to enable precision medicine approaches in endometriosis care. Furthermore, understanding the shared biological pathways between endometriosis and associated ovarian cancers may reveal opportunities for targeted prevention strategies in high-risk individuals.
From Promise to Practice: Comparative Analysis of Validated Endometrial Biomarkers and Their Clinical Translation
The validation of non-invasive biomarkers represents a paradigm shift in the diagnosis and management of endometrial cancer (EC). This application note details successfully validated metabolic biomarker panels that have demonstrated robust diagnostic performance in independent cohorts. We present quantitative validation data, detailed experimental protocols for replication, and essential research tools to advance the development of clinical diagnostic tests in endometrial cancer.
Validated Metabolic Biomarker Panels for Endometrial Cancer
Independent validation is a critical milestone in the translation of biomarker discoveries from research to clinical application. The following panels have demonstrated significant diagnostic performance in validation studies.
Table 1: Validated Metabolic Biomarker Panels for Endometrial Cancer Diagnosis
| Biomarker Panel Components | Biological Pathway | Validation Cohort Size | Diagnostic Performance (AUC) | Key Validation Findings | Reference |
|---|---|---|---|---|---|
| Glutamine, Glucose, Cholesterol Linoleate | Amino acid metabolism, Glycolysis, Lipid metabolism | 191 EC, 204 Non-EC | 0.901 - 0.902 | Outperformed CA-125 (AUC 0.610-0.684); Biological function validated in vitro. | [42] [43] |
| Phosphatidylcholines, Lysophosphatidylcholines, Alanine, Taurine | Lipid and Amino Acid Metabolism | 123 EC (Stratified by risk) | Significant differences in metabolite concentrations (p<0.05) | Distinguished high-risk and lymph node-positive EC; ROC analyses highlighted diagnostic potential. | [72] |
| SLC7A5, SLC7A11, RUNX1, PDK1, PKM, et al. (11-gene signature) | Central Carbon Metabolism in Cancer | 57 EC, 30 normal endometrium | Logistic model AUC = 0.79 | Transcriptomic signature validated by qRT-PCR; associated with metabolic vulnerabilities. | [73] |
Detailed Experimental Protocols
Protocol for Serum Metabolic Profiling using PELDI-MS
This protocol is adapted from the methodology used to identify and validate the three-metabolite panel (Glutamine, Glucose, Cholesterol Linoleate) [42].
Objective: To acquire high-performance serum metabolic fingerprints (SMFs) for the differentiation diagnosis of endometrial cancer.
Materials & Reagents:
- PELDI-MS Chip: Ferric oxide particle-coated microarray chip.
- Calibration Standards: Commercially available metabolite standards for instrument calibration.
- Solvents: HPLC-grade methanol, water.
- Quality Control (QC) Samples: Pooled human serum for quality assurance.
Procedure:
- Sample Collection and Preparation:
- Collect blood from subjects after a minimum 10-hour fast.
- Centrifuge blood samples at 4°C for 5 minutes at 2750× g to separate serum.
- Aliquot serum and store at -80°C until analysis.
- Thaw samples on ice and vortex thoroughly before use.
PELDI-MS Analysis:
- Centrifuge thawed serum samples again at 4°C for 5 minutes at 2750× g to remove any precipitates.
- Apply 10 µL of internal standard solution to each well of the PELDI-MS chip (excluding the designated blank well).
- Dry the plate under a controlled stream of nitrogen for 30 minutes.
- Apply 1 µL of prepared serum sample to the designated spot on the chip.
- Allow the spot to dry at room temperature.
Data Acquisition:
- Acquire mass spectra using a PELDI-MS system equipped with a 384-sample capacity chip.
- Operate the mass spectrometer in positive ion mode.
- Set the laser intensity and other parameters as optimized during method development.
- The average analytical speed is approximately 30 seconds per sample.
Data Processing and Machine Learning:
- Pre-process raw spectral data (peak alignment, normalization).
- Use machine learning algorithms (e.g., logistic regression, support vector machines) to build a diagnostic model from the SMFs in the discovery cohort.
- Validate the model's performance in an independent, set-aside validation cohort.
Protocol for Targeted Metabolomic Profiling with the AbsoluteIDQ p180 Kit
This protocol is based on the methodology used to identify metabolites associated with high-risk EC and lymph node status [72].
Objective: To perform targeted quantification of up to 188 metabolites from serum samples for EC risk stratification.
Materials & Reagents:
- AbsoluteIDQ p180 Kit: Includes 96-well plate, lyophilized internal standards, solvents, and derivatization reagents.
- Liquid Chromatography-Mass Spectrometry (LC-MS): High-performance LC system coupled to a triple quadrupole mass spectrometer.
- Extraction Solvent: 5 mM ammonium acetate in methanol.
Procedure:
- Sample Preparation:
- Thaw serum samples on ice and centrifuge at 4°C for 5 minutes at 2750× g.
- Reconstitute lyophilized internal standards (ISTDs) with 1200 µL of water. Shake for 15 minutes at 1200 rpm and vortex.
- Reconstitute calibration standards with 100 µL of water each. Shake for 15 minutes at 1200 rpm and vortex.
Plate Preparation and Derivatization:
- Pipette 10 µL of ISTD solution into each well of the kit's 96-well plate (except the blank well).
- Dry the plate under a nitrogen stream for 30 minutes.
- Add 50 µL of a freshly prepared 5% phenyl isothiocyanate (PITC) solution to each well for derivatization.
- Incubate the plate at room temperature for 25 minutes.
- Dry the plate again under nitrogen for 60 minutes to remove excess reagent.
Metabolite Extraction:
- Add 300 µL of extraction solvent (5 mM ammonium acetate in methanol) to each well.
- Shake the plate for 30 minutes to extract metabolites.
- Elute the extracts under nitrogen pressure and collect them for analysis.
LC-MS/MS Analysis:
- Split the extracts for separate analysis by Flow Injection Analysis-MS (for lipids) and LC-MS (for amino acids and biogenic amines).
- Use the LC-MS system with conditions specified by the kit manufacturer.
- Quantify metabolites using the provided software and calibration curves.
Metabolic Pathways in Endometrial Cancer
Endometrial cancer is characterized by significant metabolic reprogramming to support rapid proliferation and growth. The validated biomarkers function within interconnected pathways that provide a metabolic snapshot of the disease state.
Figure 2: Key Metabolic Pathways in Endometrial Cancer. Validated biomarkers highlight dysregulation in glycolysis, amino acid metabolism, and complex lipid metabolism, supporting tumor proliferation and metastatic progression [72] [74] [42].
The Scientist's Toolkit: Essential Research Reagent Solutions
Table 2: Key Research Reagents and Platforms for Metabolic Biomarker Validation
| Reagent/Platform | Manufacturer/Provider | Primary Function in Validation |
|---|---|---|
| AbsoluteIDQ p180 Kit | Biocrates Life Sciences AG | Targeted quantification of 188 metabolites (acylcarnitines, glycerophospholipids, amino acids, etc.) from serum/plasma. |
| PELDI-MS (Ferric Oxide Particles) | In-house/Custom | High-speed, high-capacity acquisition of serum metabolic fingerprints with high salt/protein tolerance. |
| NanoString nCounter Metabolic Panel | NanoString Technologies | Multiplexed transcriptomic analysis of 768 metabolism-related genes from FFPE or fresh tissue. |
| TCGA & CPTAC Databases | NIH/NCI | Publicly available multi-omics (genomic, transcriptomic, proteomic) data for in-silico validation and analysis. |
| Reverse Phase Chromatography Columns | Various (e.g., Waters, Agilent) | Separation of complex metabolite mixtures prior to mass spectrometric detection. |
Within endometrial cancer (EC) diagnostics, Cancer Antigen 125 (CA-125) has been a longstanding serological tool, yet its limitations in sensitivity and specificity are well-documented. The clinical imperative for improved early detection and risk stratification has catalyzed the development of novel, multi-modal biomarker panels. This Application Note provides a comparative performance analysis and detailed experimental protocols for evaluating these biomarkers, with a specific focus on validation within independent cohort research as a cornerstone of robust biomarker development.
Comparative Performance Data
The diagnostic and prognostic performance of CA-125 versus emerging biomarker panels is summarized in the table below.
Table 1: Comparative Performance of CA-125 and Novel Biomarker Panels in Endometrial Cancer
| Biomarker Category | Specific Biomarker(s) | Reported AUC | Key Clinical Utility | Reference Cohort |
|---|---|---|---|---|
| Single Protein (Traditional) | CA-125 | 0.610 – 0.684 [42] | Predicts LVSI, LNM, and advanced stage [75]; prognostic in UPSC [76] | Single-center retrospective studies |
| Integrated Clinical Model | HE4, Endometrial Thickness, FBG, HDL, etc. (14-var nomogram) | 0.964 – 0.987 [77] | EC risk prediction incorporating PCOS-MetS interaction [77] | Multi-centre, training & validation cohorts [77] |
| Metabolite Panel | Glutamine, Glucose, Cholesterol Linoleate | 0.901 – 0.902 [42] | Differentiation diagnosis of EC vs. Non-EC [42] | 191 EC vs. 204 Non-EC subjects [42] |
| Gene Expression Signature | 5-Gene Panel (ASRGL1, RHEX, SCGB2A1, SOX17, STX18) | 0.898 [78] | Predicts lymph node metastasis in early-stage EEC [78] | TCGA + independent validation cohort (n=72) [78] |
| Extracellular Vesicle (EV) miRNAs | miR-21-3p, miR-26a-5p, miR-130a-3p, miR-139, miR-219a-5p | Information missing | Minimally invasive diagnostic biomarkers; expression reflects endometrial tissue [2] | Systematic review of 23 studies [2] |
Detailed Experimental Protocols
Protocol 1: Development and Validation of an Integrated Clinical Nomogram
This protocol outlines the creation of a multivariate model for EC risk prediction [77].
- Study Design and Population: A retrospective case-control study is designed. A minimum sample size of 404 participants is required, calculated using the
pmsampsizepackage in R, accounting for a 10% attrition rate. The cohort should include confirmed EC patients and age-matched healthy controls, split into training (e.g., 70%) and internal validation (e.g., 30%) sets. An external validation cohort from a different center and time period is crucial for assessing generalizability [77]. - Data Collection: Collect clinical and laboratory data. Essential variables include [77]:
- Clinical: Age, BMI, menstrual history, PCOS status (Rotterdam criteria), Metabolic Syndrome status (MetS), endometrial thickness (via imaging).
- Laboratory: Fasting blood glucose, HDL, and tumor markers (HE4, CA-125, CA-199).
- Statistical Analysis and Model Building:
- Feature Selection: Use Least Absolute Shrinkage and Selection Operator (LASSO) regression on the training set to identify the most significant predictors from all collected variables [77].
- Model Development: Employ multivariate logistic regression with the selected features to build the predictive model [77].
- Nomogram Construction: Convert the logistic regression equation into a user-friendly nomogram for visual risk score calculation [77].
- Validation: Assess the model's discrimination using the Area Under the Receiver Operating Characteristic Curve (AUC) in the training, internal validation, and external validation sets. Evaluate calibration with the Hosmer-Lemeshow test and clinical utility with Decision Curve Analysis [77].
The workflow for this protocol is visualized below.
Protocol 2: Serum Metabolic Fingerprinting (SMF) for Metabolite Biomarker Discovery
This protocol uses PELDI-MS for high-throughput discovery of metabolite biomarkers [42].
- Sample Preparation: Collect serum samples from EC and Non-EC (controls with thickened endometrium or uterine mass) subjects. A simple dilution of serum is often sufficient due to the high salt and protein tolerance of PELDI-MS [42].
- Metabolite Detection via PELDI-MS:
- Chip Preparation: Use an on-chip microarray with ferric oxide particles (e.g.,
Fe₂O₃particles) [42]. - Data Acquisition: Apply 1 µL of prepared sample to the chip and air dry. Acquire metabolic fingerprints using a PELDI-MS system (e.g.,
PELDI-MS 1000). The analytical speed is approximately 30 seconds per sample [42].
- Chip Preparation: Use an on-chip microarray with ferric oxide particles (e.g.,
- Data Analysis and Model Training:
- Pre-processing: Normalize spectral data and perform peak alignment.
- Machine Learning: Use the training cohort's SMFs to build a diagnostic model. Algorithms like Random Forest or Support Vector Machines are suitable. The model's performance is evaluated by AUC on the validation set [42].
- Biomarker Identification: Identify specific metabolites (e.g., Glutamine, Glucose, Cholesterol Linoleate) that significantly contribute to the model's classification power. Validate their biological function through in vitro assays on EC cell lines (proliferation, migration, apoptosis) [42].
Protocol 3: qRT-PCR-Based Gene Signature Validation
This protocol validates a gene expression signature for predicting lymph node metastasis (LNM) in early-stage endometrial endometrioid carcinoma (EEC) [78].
- RNA Extraction and QC: Extract total RNA from fresh-frozen or FFPE endometrial tumor tissue using a commercial kit (e.g.,
RNeasy Kit). Assess RNA quality and integrity (e.g., RIN >7.0) [78]. - Reverse Transcription and qRT-PCR:
- cDNA Synthesis: Convert 1 µg of total RNA to cDNA using a reverse transcription kit (e.g.,
High-Capacity cDNA Reverse Transcription Kit). - qRT-PCR Setup: Perform triplicate reactions for each target gene (
ASRGL1, RHEX, SCGB2A1, SOX17, STX18) and reference genes (e.g.,GAPDH, ACTB) using a SYBR Green or TaqMan-based master mix on a real-time PCR system (e.g.,QuantStudio 5) [78].
- cDNA Synthesis: Convert 1 µg of total RNA to cDNA using a reverse transcription kit (e.g.,
- Data Analysis and Risk Scoring:
- Calculate relative gene expression (∆Ct) normalized to reference genes.
- Develop a risk score formula based on a multivariate model (e.g., logistic regression or machine learning) that combines the expression levels of the five genes. The model output predicts the probability of LNM [78].
Signaling Pathways and Workflow Visualization
The following diagram illustrates the multi-omics landscape of novel EC biomarkers and their pathophysiological contexts, highlighting the transition from single-analyte testing to integrated panels.
The Scientist's Toolkit: Research Reagent Solutions
Table 2: Essential Research Reagents and Kits for Biomarker Studies
| Item | Function / Application | Example Product / Assay |
|---|---|---|
| CA-125 ELISA Kit | Quantifying serum CA-125 levels for baseline comparison. | DCA125 ELISA Kit (R&D Systems) [79] |
| PELDI-MS Chip & System | High-speed, high-capacity acquisition of serum metabolic fingerprints (SMFs). | Custom Fe₂O₃-coated PELDI Chip [42] |
| RNA Extraction Kit | Isolating high-quality RNA from tissue for gene expression analysis. | RNeasy Kit (Qiagen) [78] |
| qRT-PCR Master Mix | Validating gene expression signatures via quantitative real-time PCR. | SYBR Green or TaqMan Master Mix (Thermo Fisher) [78] |
| Extracellular Vesicle Isolation Kit | Enriching EVs from serum or plasma for miRNA/protein analysis. | ExoQuick-TC (System Biosciences) or differential ultracentrifugation [2] |
| NGS Panel | Genotyping gene variants for personalizing biomarker reference ranges. | Custom AmpliSeq Panel (Ion Torrent) [79] |
The pursuit of clinically relevant biomarkers for endometriosis has been marked by significant challenges. Despite extensive research efforts, no single biomarker or combination has reached routine clinical validation for this complex gynecological condition [80] [81]. Traditional single-compartment approaches have yielded over 1,100 candidate biomarkers across nine biological compartments, yet few have demonstrated consistent diagnostic utility [80]. This protocol outlines a systematic framework for validating cross-tissue biomarker candidates, specifically focusing on TNF-α, MMP-9, TIMP-1, and miR-451, which represent the most promising multi-compartment biomarkers identified in recent systematic reviews [80] [81].
The validation approach described herein is grounded in the recognition that biomarkers reproducibly detected across multiple biological compartments may play more direct roles in disease pathophysiology and offer enhanced diagnostic potential. This document provides detailed application notes and experimental protocols for researchers and drug development professionals working to advance endometriosis diagnostics through robust, multi-tissue validation strategies aligned with the broader thesis of validating endometrial biomarkers in independent cohort research.
Background and Significance
The Endometriosis Biomarker Landscape
Endometriosis affects 6%-10% of reproductive-aged women globally, with diagnosis typically delayed by 4 to 11 years due to the requirement for surgical confirmation [80]. The condition manifests as three distinct phenotypes—superficial peritoneal lesions, ovarian endometriomas, and deep infiltrating endometriosis—each with potentially different biomarker profiles [80] [81]. Research has explored biomarkers across nine biological compartments, ordered by frequency of study: peripheral blood, eutopic endometrium, peritoneal fluid, ovaries, urine, menstrual blood, saliva, feces, and cervical mucus [80].
A comprehensive systematic review analyzing literature from 2005-2022 identified 1,107 significantly deregulated biomarkers in endometriosis patients compared to controls [80] [81]. However, critical methodological limitations persist in the field: while 73% of studies account for disease phenotypes, only 29% adjust for menstrual cycle phase, 6% for symptoms, and a mere 3% for treatments [80]. These inconsistencies contribute to the poor translatability of findings and highlight the need for standardized validation approaches.
Rationale for Cross-Tissue Biomarker Validation
The multi-tissue validation approach addresses fundamental limitations in endometriosis biomarker research through several key advantages:
- Pathophysiological Relevance: Biomarkers detectable across multiple compartments may reflect core disease mechanisms rather than compartment-specific epiphenomena
- Enhanced Robustness: Cross-tissue consistency reduces false discoveries arising from technical artifacts or compartment-specific variations
- Diagnostic Flexibility: Multi-compartment biomarkers enable diagnostic development across different sample types, accommodating diverse clinical settings and patient preferences
Of the 74 biomarkers found in several biological compartments by at least two independent research teams, only four—TNF-α, MMP-9, TIMP-1, and miR-451—have been detected in at least three tissues with cohorts of 30 women or more [80] [81]. These candidates form the focus of this validation protocol.
Candidate Biomarker Profiles and Experimental Evidence
Table 1: Multi-Tissue Biomarker Profiles in Endometriosis
| Biomarker | Full Name | Primary Function | Tissues Detected | Expression Direction | Supporting Evidence |
|---|---|---|---|---|---|
| TNF-α | Tumor Necrosis Factor-alpha | Pro-inflammatory cytokine | Peripheral blood, peritoneal fluid, eutopic endometrium | Upregulated | Detected across ≥3 tissues in cohorts ≥30 subjects [80] |
| MMP-9 | Matrix Metalloproteinase-9 | Extracellular matrix degradation | Peripheral blood, peritoneal fluid, eutopic endometrium | Upregulated | Consistent detection across compartments; recent ratio-based approaches show promise [80] [82] [83] |
| TIMP-1 | Tissue Inhibitor of Metalloproteinase-1 | Regulation of MMP activity | Peripheral blood, peritoneal fluid, eutopic endometrium | Variably regulated | Identified in multi-tissue analysis; interacts with MMP-9 in pathophysiology [80] |
| miR-451 | MicroRNA-451 | Post-transcriptional regulation | Peripheral blood, eutopic endometrium, menstrual blood | Downregulated (plasma); tissue-specific variations | Consistently identified in circulating miRNA studies; population-specific patterns noted [80] [84] |
Quantitative Evidence for Candidate Biomarkers
Table 2: Experimental Performance Metrics of Candidate Biomarkers
| Biomarker | Sample Type | Assay Method | Sensitivity | Specificity | AUC | Cohort Size | References |
|---|---|---|---|---|---|---|---|
| MMP-9/NGAL Ratio | Serum | ELISA | 86.1% | 84% | 0.898 | 90 (45 cases/45 controls) | [82] [83] |
| miR-451 | Plasma | qRT-PCR | Significant differential expression | Promising diagnostic potential | Reported | 23 (12 cases/11 controls) | [84] |
| TNF-α | Multiple | Various | Consistent directional changes | Consistent directional changes | Not consistently reported | Aggregated from multiple studies | [80] |
| MMP-9 | Multiple | Various | Consistent directional changes | Consistent directional changes | Not consistently reported | Aggregated from multiple studies | [80] |
Recent evidence supports novel approaches to biomarker implementation, including ratio-based assessments. The MMP-9/NGAL ratio has demonstrated particularly promising diagnostic characteristics, with an optimal cutoff of >1.75 showing 86.1% sensitivity and 84% specificity for detecting endometriomas in infertile patients [82] [83]. Furthermore, this ratio correlates with clinical findings, showing positive association with visual analog scale (VAS) pain scores and significant reduction following surgical intervention [82] [83].
For miR-451, population-specific variations highlight the importance of validation across diverse cohorts. While most studies report downregulation in plasma from endometriosis patients, some population studies (e.g., Indian cohorts) show distinct trends, emphasizing the need for careful consideration of genetic and environmental factors during validation [84].
Experimental Protocols for Multi-Tissue Validation
The following diagram illustrates the comprehensive multi-stage validation workflow:
Sample Collection and Processing Protocol
Patient Recruitment and Inclusion Criteria
- Case Definition: Laparoscopically confirmed endometriosis with documented phenotype (superficial peritoneal, ovarian endometrioma, or deep infiltrating)
- Control Group: Women without endometriosis confirmed by laparoscopy for other indications (e.g., tubal sterilization, infertility assessment without endometriosis)
- Exclusion Criteria: Hormonal treatments within 3 months, systemic inflammatory conditions, autoimmune diseases, malignant disorders, pregnancy, postmenopausal status
- Stratification: Pre-plan recruitment to ensure balanced representation of disease phenotypes and menstrual cycle phases
Multi-Compartment Sample Collection
Table 3: Sample Collection Specifications by Biological Compartment
| Compartment | Collection Method | Processing Protocol | Storage Conditions | Key Considerations |
|---|---|---|---|---|
| Peripheral Blood | Fasting venous draw (5mL) in serum tubes | Clot 30min at RT, centrifuge 3000rpm 10min, aliquot serum | -80°C in low-protein-binding tubes | Standardize time of collection; avoid hemolyzed samples |
| Plasma | Venous draw in EDTA or citrate tubes | Centrifuge 3000rpm 15min within 30min of collection, aliquot | -80°C | Essential for miRNA studies; prevent cellular contamination |
| Eutopic Endometrium | Pipelle biopsy or surgical specimen | Snap freeze in liquid N₂ for molecular analysis; formalin-fix for IHC | -80°C (frozen); RT (FFPE) | Document cycle phase histologically |
| Peritoneal Fluid | Laparoscopic collection | Centrifuge 2000rpm 10min to remove cells, aliquot supernatant | -80°C | Process immediately after collection |
| Menstrual Blood | Menstrual cup or specialized collection device | Centrifuge to separate cellular component, preserve supernatant | -80°C | Standardize collection timing within menstrual cycle |
Critical Pre-analytical Considerations
- Menstrual Cycle Timing: Record last menstrual period and collect samples in early follicular phase (days 2-5) when possible
- Sample Processing: Process all samples within 2 hours of collection; use uniform centrifugation protocols across sites
- Quality Assessment: Document hemolysis index for blood samples; RNA integrity number (RIN) >7 for molecular analyses
- Storage: Use single freezer systems with continuous temperature monitoring; avoid freeze-thaw cycles
Analytical Validation Methods
Protein Biomarker Quantification (TNF-α, MMP-9, TIMP-1)
ELISA Protocol:
- Platform Selection: High-sensitivity ELISA kits with validated performance in biological matrices of interest
- Sample Dilution: Optimize dilution factors to fall within assay dynamic range; use sample matrix for standard dilution
- Quality Controls: Include internal controls representing low, medium, and high concentrations in each plate
- Performance Parameters:
- Lower Limit of Quantification (LLOQ): Determine via serial dilution of pooled sample
- Precision: <15% coefficient of variation (CV) for intra- and inter-assay variability
- Accuracy: 85-115% recovery of spiked standards
- Parallelism: Demonstrate linear dilution curves for sample dilutions
- Normalization: Account for blood concentration effects using total protein quantification or reference markers
miRNA Quantification (miR-451)
qRT-PCR Protocol:
- RNA Extraction: Use phenol-chloroform methods with carrier molecules to enhance small RNA recovery
- Quality Control: Verify RNA integrity using Bioanalyzer small RNA assay; accept RIN >7.0
- Reverse Transcription: Use stem-loop primers for specific cDNA synthesis of target miRNAs
- qPCR Amplification:
- Platform: TaqMan-based assays preferred for specificity
- Normalization: Use multiple reference genes (e.g., miR-16-5p, miR-423-5p) validated in study population
- Data Analysis: Calculate relative expression using 2^(-ΔΔCt) method with multiple reference gene normalization
- Validation: Demonstrate amplification efficiency of 90-110% with R² >0.98 for standard curves
Experimental Design for Clinical Validation
Two-Stage Validation Strategy
For efficient utilization of limited biospecimen resources, implement a two-stage validation design with rotation of participant sets [85]:
- Stage 1 Screening: Evaluate candidate biomarkers in group 1 samples (n=30-50 per group)
- Performance Threshold: Apply predefined performance criteria (e.g., AUC>0.70, p<0.05)
- Stage 2 Validation: Advance promising biomarkers to group 2 testing (n=30-50 per group)
- Rotation Design: Rotate group membership across biomarkers to maximize specimen utilization
- Statistical Considerations: Use group sequential testing methods to control type I error in multi-stage designs [85]
Confounding Factor Management
- Menstrual Cycle Phase: Stratify analysis by follicular and luteal phases; include cycle phase as covariate in statistical models
- Phenotype Specificity: Analyze biomarkers across endometriosis phenotypes separately before pooling
- Symptom Correlation: Collect standardized symptom data (e.g., VAS pain scores, B&B questionnaire) for clinical correlation
- Treatment History: Document and adjust for previous hormonal treatments, time since last treatment
The Scientist's Toolkit: Essential Research Reagents
Table 4: Key Research Reagent Solutions for Multi-Tissue Biomarker Validation
| Reagent/Category | Specific Examples | Function/Application | Validation Considerations |
|---|---|---|---|
| ELISA Kits | High-sensitivity TNF-α, MMP-9, TIMP-1 kits | Protein biomarker quantification | Verify recovery in specific matrices; check cross-reactivity |
| miRNA Assays | TaqMan miRNA assays (e.g., hsa-miR-451a) | miRNA quantification and normalization | Validate reference genes in each tissue compartment |
| RNA Isolation Kits | miRNeasy, miRvana | Simultaneous isolation of miRNA and total RNA | Assess small RNA recovery efficiency |
| Reference Materials | Recombinant proteins, synthetic miRNAs | Standard curve quantification, spike-in controls | Source traceable reference materials |
| Quality Control | Inter-assay controls, pooled sample references | Monitoring assay performance across batches | Establish acceptance criteria for QC samples |
| Sample Collection | PAXgene Blood RNA tubes, serum separator tubes | Standardized sample procurement | Validate stability under collection conditions |
Data Analysis and Interpretation Framework
Statistical Analysis Plan
- Primary Analysis: Compare biomarker levels between cases and controls using non-parametric tests (Mann-Whitney U)
- Diagnostic Performance: Calculate sensitivity, specificity, and AUC with 95% confidence intervals
- Multi-marker Models: Use logistic regression with backward elimination to identify optimal biomarker combinations
- Correlation Analysis: Assess relationships between biomarker levels across compartments and with clinical symptoms
- Correction for Multiple Testing: Apply Benjamini-Hochberg false discovery rate correction for multiple comparisons
Interpretation Guidelines
- Cross-Tissue Consistency: Prioritize biomarkers showing consistent directional changes across ≥2 compartments
- Effect Size Considerations: Focus on biomarkers with fold-change >1.5 and statistical significance after multiple test correction
- Clinical Relevance: Evaluate correlation with disease severity, pain scores, or infertility duration
- Population Specificity: Assess variation in biomarker performance across different ethnic populations
This protocol outlines a comprehensive framework for validating multi-tissue biomarkers for endometriosis, with specific application to TNF-α, MMP-9, TIMP-1, and miR-451 as leading cross-tissue candidates. The rigorous multi-compartment approach addresses critical limitations in previous biomarker research and enhances the likelihood of identifying clinically useful biomarkers.
Successful validation of these candidates would represent a significant advancement in endometriosis diagnostics, potentially enabling non-invasive detection and fostering personalized management approaches. Future directions should include validation in large, diverse, multi-center cohorts and development of point-of-care testing platforms based on the most promising biomarkers.
The experimental protocols and application notes provided herein offer researchers a standardized framework for advancing endometriosis biomarker validation while contributing to the broader thesis of robust biomarker development in independent cohort research.
The diagnosis and prognostication of endometrial cancer (EC) have traditionally relied on histopathological examination and imaging. However, these methods can be invasive and are subject to interobserver variability [2]. The integration of molecular biomarkers with standard clinical variables presents a transformative opportunity to develop enhanced, reproducible diagnostic algorithms. This approach is particularly vital for endometrial cancer, where molecular subtypes carry significant prognostic and therapeutic implications [3] [86]. This application note provides a detailed protocol for constructing and validating integrated diagnostic models within the context of independent cohort research, a cornerstone of robust biomarker validation.
Biomarker Classes and Their Clinical Utility in Endometrial Cancer
The discovery of endometrial cancer biomarkers has leveraged diverse technological platforms, from transcriptomics and proteomics to analysis of extracellular vesicles (EVs) and soluble immune checkpoints (sICs). The table below summarizes key biomarker classes and their potential clinical applications.
Table 1: Biomarker Classes in Endometrial Cancer
| Biomarker Class | Example Biomarkers | Potential Clinical Utility | Source/Biofluid |
|---|---|---|---|
| Extracellular Vesicle (EV)-associated MicroRNAs | miR-21-3p, miR-26a-5p, miR-130a-3p, miR-139, miR-219a-5p [2] | Diagnostic biomarker; levels differentially abundant in EC vs. controls [2] | Plasma, Serum, Urine [2] |
| Soluble Immune Checkpoints (sICs) | sPD-1, sPD-L1, sLAG-3, sTIM-3, sCD27, sCD40 [3] | Predictive for immunotherapy response; associated with LVSI and advanced stage [3] | Plasma [3] |
| Tissue Proteins | Pyruvate kinase, Chaperonin 10, α1-antitrypsin [12] | Diagnostic biomarker panel for discriminating malignant from benign tissue [12] | Endometrial Tissue [12] |
| Clinical & Molecular Variables for Prognosis | Tumor size, Histology, Grade, TNM Stage, Lymph node examination status [86] | Prognostic nomogram for overall survival in Type II EC [86] | Clinical records & Histopathology [86] |
Experimental Protocol: An Integrated Workflow for Biomarker Validation
The following protocol outlines a systematic workflow for integrating novel biomarkers with clinical variables, from sample collection to model validation.
Sample Collection and Pre-Analytical Processing
Principle: Standardized sample collection is critical to minimize pre-analytical variability, especially for sensitive assays like EV and sIC analysis [2] [3].
Materials:
- EDTA or Heparin Tubes: For plasma collection [3].
- Serum Separator Tubes: For serum collection [2].
- Urine Collection Cups: For mid-stream urine samples [2].
- Institutional Review Board (IRB)-approved informed consent forms.
Procedure:
- Patient Recruitment: Recruit patients with suspected or confirmed EC and age-/BMI-matched controls undergoing surgery for benign conditions [3]. Obtain written informed consent.
- Blood Collection: Collect peripheral venous blood after a >8-hour fast [3].
- For plasma: Collect in EDTA tubes. Centrifuge at 2,000 g for 10-20 minutes at room temperature within 60 minutes of collection. Aliquot and store supernatant at -70°C or below [2].
- For serum: Collect in serum separator tubes. Allow blood to clot for 30 minutes, then centrifuge at 2,000 g for 10 minutes. Aliquot and store serum at -70°C [2].
- Urine Collection: Collect 5-10 mL of spontaneously voided urine. Centrifuge at 2,000 g for 20 minutes at room temperature to remove cells and debris. Aliquot and store the supernatant at -70°C [2] [87].
- Tissue Biopsy: Collect endometrial biopsies following clinical standard of care. Snap-freeze in liquid nitrogen for molecular analyses or preserve in formalin for histopathology [21].
- Data Collection: Record key clinical variables (e.g., age, BMI, menopausal status) and histopathological data (e.g., tumor type, grade, stage) [86].
Biomarker Analysis Techniques
3.2.1 Isolation and Analysis of Extracellular Vesicles
Principle: EVs are lipid-bilayer particles that carry bioactive molecules (e.g., proteins, miRNAs) and are isolated from biofluids for minimally invasive biomarker discovery [2].
Materials:
- Differential Ultracentrifugation System or Commercial EV Precipitation Kits (e.g., ExoQuick) [2].
- Nanoparticle Tracking Analysis (NTA) Instrument (e.g., Malvern Panalytical NanoSight) for size and concentration analysis [2].
- Transmission Electron Microscope (TEM) for morphological characterization [2].
- Antibodies against EV markers (e.g., CD63, CD9, CD81, TSG101) for western blot or flow cytometry [2].
- RNA Extraction Kit and qRT-PCR System for miRNA quantification [2].
Procedure:
- EV Isolation: Isolate EVs from 500 µL to 1 mL of plasma or serum using differential ultracentrifugation (e.g., 100,000 g for 70 minutes) or a commercial precipitation kit, following manufacturer protocols [2].
- EV Characterization:
- Biomarker Quantification: Extract total RNA from the EV preparation. Perform reverse transcription and quantitative PCR (qRT-PCR) for target miRNAs (e.g., miR-21-3p, miR-139). Use small RNAs (e.g., U6 snRNA) for normalization [2].
3.2.2 Quantification of Soluble Immune Checkpoints
Principle: sICs are circulating forms of membrane-bound immune regulators and are measured via multiplex immunoassays [3].
Materials:
- Multiplex Immunoassay Kit for sICs (e.g., Luminex xMAP-based panels) [3].
- Luminex MagPix or FLEXMAP 3D Instrument [3].
Procedure:
- Sample Thawing: Thaw plasma samples on ice and centrifuge briefly to remove precipitates.
- Multiplex Assay: Incubate plasma samples with antibody-coated magnetic beads according to the manufacturer's instructions.
- Detection: After washing, add a biotinylated detection antibody followed by a streptavidin-phycoerythrin conjugate.
- Acquisition and Analysis: Read the assay on the Luminex instrument. Calculate analyte concentrations from a standard curve [3].
Data Integration and Algorithm Development
Principle: Combine biomarker data with clinical variables to create a powerful diagnostic or prognostic model using multivariate statistical methods [86] [87].
Procedure:
- Data Compilation: Create a unified dataset with columns for patient ID, all biomarker readings (e.g., EV-miRNA levels, sIC concentrations), and clinical variables (e.g., age, tumor size, stage, grade) [86].
- Cohort Splitting: Randomly split the dataset into a training cohort (e.g., 70%) for model development and a validation cohort (e.g., 30%) for testing [86].
- Univariable Analysis: Perform univariable Cox regression (for survival) or logistic regression (for diagnosis) to identify significant variables associated with the outcome.
- Multivariable Analysis: Input variables with significance from univariable analysis into a multivariable Cox proportional hazards or logistic regression model. This identifies independent prognostic/diagnostic factors [86].
- Nomogram Construction: Use the coefficients from the multivariable model to construct a nomogram. A nomogram provides a graphical representation where points are assigned for each variable level, and the total points predict the probability of an outcome (e.g., 1-, 3-, 5-year overall survival) [86].
- Algorithm Validation:
- Discrimination: Evaluate the model's accuracy using the Concordance Index (C-index) and Area Under the Receiver Operating Characteristic Curve (AUC) in both training and validation cohorts [86].
- Calibration: Use calibration plots to assess the agreement between predicted probabilities and actual observed outcomes [86].
- Clinical Utility: Perform Decision Curve Analysis (DCA) to evaluate the net clinical benefit of using the model across different threshold probabilities [86].
The following diagram illustrates the core analytical workflow for developing and validating an integrated diagnostic algorithm.
The Scientist's Toolkit: Essential Research Reagents
Table 2: Key Reagents for Integrated Biomarker Studies
| Reagent / Solution | Function | Example |
|---|---|---|
| EDTA Plasma Collection Tubes | Anticoagulant for plasma preparation; preferred for many biomarker assays to avoid release of platelet-derived vesicles during clotting. | BD Vacutainer K2EDTA Tubes [3] |
| EV Isolation Kits | Precipitate or purify extracellular vesicles from biofluents for downstream molecular analysis. | ExoQuick-TC (System Biosciences) [2] |
| Multiplex Immunoassay Kits | Simultaneously quantify multiple soluble analytes (e.g., sICs, cytokines) from a single small-volume sample. | Human Immuno-Oncology Checkpoint Panel (Bio-Rad) [3] |
| RNA Stabilization Reagents | Preserve RNA integrity in cells, tissues, or EV isolates during storage and processing. | RNAlater (Thermo Fisher Scientific) |
| iTRAQ / TMT Reagents | Enable multiplexed, relative and absolute quantitation of proteins in up to 16 samples using mass spectrometry. | iTRAQ Reagents (Sciex) [12] |
| qRT-PCR Assays | Sensitive and specific quantification of miRNA or mRNA expression levels from purified RNA. | TaqMan MicroRNA Assays (Thermo Fisher Scientific) [2] |
Critical Considerations for Experimental Design
A successful biomarker integration study must account for several confounding factors and biases.
- Menstrual Cycle Confounding: The endometrial transcriptome varies significantly throughout the menstrual cycle. This variation can mask disease-related gene expression changes. It is critical to record the cycle phase (e.g., by LH peak) and, during data analysis, use linear models (e.g.,
removeBatchEffectin limma R package) to statistically correct for this "batch effect," which can unmask up to 44% more differentially expressed genes [21]. - Cohort Sourcing and Splitting: Utilize large, well-annotated databases (e.g., SEER) or prospectively collect samples. Always split data into training and validation sets to prevent overfitting and ensure model generalizability [86].
- Adherence to EV Research Guidelines: Follow MISEV (Minimal Information for Studies of Extracellular Vesicles) guidelines. Characterize EV preparations by at least two complementary methods (e.g., NTA for size, western blot for markers) to ensure rigor and reproducibility [2].
The integration of molecular biomarkers—ranging from EV-derived miRNAs and soluble immune checkpoints to tissue proteomic panels—with established clinical and pathological variables represents the frontier of precision medicine in endometrial cancer. The protocols detailed herein provide a robust framework for developing, validating, and applying integrated diagnostic algorithms. By rigorously addressing pre-analytical variables, employing multivariate statistical models, and validating findings in independent cohorts, researchers can generate clinically actionable tools that significantly improve diagnostic precision, prognostic stratification, and personalized treatment selection for patients.
Endometrial cancer (EC) is the most common gynecological malignancy in developed countries, with its incidence rising globally [1]. While early-stage disease has a favorable prognosis, advanced or recurrent EC continues to be linked to poor outcomes, with a 5-year survival rate of approximately 20% for metastatic disease [1]. The established Bokhman dualistic classification system has been progressively supplemented by The Cancer Genome Atlas (TCGA) molecular classification, which identifies four distinct prognostic subgroups: POLE ultramutated, microsatellite instability (MSI) hypermutated, copy-number low, and copy-number high [88]. This molecular refinement underscores the critical need for validated biomarkers that can accurately stratify patient risk and predict treatment response, thereby enabling personalized treatment approaches and improving clinical outcomes.
The validation of biomarkers in independent cohort research represents a foundational step in translating molecular discoveries into clinical practice. Despite the identification of numerous candidate biomarkers through advanced multi-omics technologies, their implementation in routine clinical care remains limited [89] [88]. This document outlines a structured framework and detailed protocols for the prognostic validation of EC biomarkers, providing researchers with standardized methodologies to assess the clinical utility of candidate biomarkers for risk stratification and treatment response prediction.
Current Biomarker Landscape in Endometrial Cancer
The following table summarizes the key prognostic and predictive biomarkers currently under investigation or with established clinical relevance in endometrial cancer.
Table 1: Key Prognostic and Predictive Biomarkers in Endometrial Cancer
| Biomarker Category | Specific Biomarkers | Clinical/Prognostic Utility | Validation Status |
|---|---|---|---|
| Molecular Subtypes | POLE mutations, MMR-d/MSI-H, p53abn, NSMP | Definitive risk stratification; predicts natural history [1] [88]. | Clinically integrated (FIGO 2023 staging) [1]. |
| Hormonal Receptors | Estrogen Receptor (ER), Progesterone Receptor (PR) | Refined three-tiered risk model (0-10%, 20-80%, 90-100%) provides prognostic information within molecular subgroups [90]. | Retrospective multicenter validation; supports routine clinical evaluation [90]. |
| Serum Protein Biomarkers | HE4, CA125 | HE4 is pivotal for risk stratification; CA125 excels in detecting lymph node invasion [91]. | Validated in machine learning models for preoperative prediction [91]. |
| Diabetes-Associated Gene Signature | TRPC1, SELENOP, CDKN2A, GSN, PGR | Stratifies patients into high- and low-risk cohorts; links metabolic dysregulation to tumor aggressiveness [92]. | Established via bioinformatics analysis of TCGA data; requires further clinical validation [92]. |
| Immunotherapy Biomarkers | MMR-d/MSI-H, TMB, PD-L1 | Predictive of response to immune checkpoint inhibitors [1] [93]. | MMR-d/MSI-H is standard for first-line immunotherapy; others are complementary [1]. |
Methodologies for Biomarker Validation
The analytical and clinical validation of biomarkers requires a rigorous, multi-step process. The following workflow outlines the key stages from initial discovery to clinical application.
Biomarker Validation Workflow
Retrospective Cohort Study Protocol for Prognostic Validation
Objective: To determine the association between a candidate biomarker and clinical outcomes (e.g., disease-specific survival, recurrence-free survival) using archived patient samples.
Materials:
- Formalin-fixed, paraffin-embedded (FFPE) tumor tissue blocks or archived serum/plasma samples from a well-characterized EC patient cohort.
- Clinical and pathological data, including age, stage, histology, treatment, and follow-up.
Procedure:
- Cohort Definition: Define a retrospective cohort with a minimum of 5 years of follow-up. Ensure ethical approval and waivers for use of archived samples.
- Sample Selection: Include a representative sample of EC cases (e.g., all molecular subtypes, stages I-IV). Calculate sample size based on expected effect size and statistical power.
- Biomarker Assay: Perform biomarker testing on all samples using a standardized, analytically validated protocol (e.g., IHC, NGS, ELISA). Technicians should be blinded to clinical outcomes.
- Data Collection: Extract clinical outcomes from medical records, including date of diagnosis, recurrence, last follow-up, and death.
- Statistical Analysis:
- Use Kaplan-Meier curves and the log-rank test to compare survival between biomarker-defined groups.
- Perform univariate and multivariate Cox proportional hazards regression to assess the independent prognostic value of the biomarker, adjusting for clinicopathological variables (e.g., stage, age, molecular subtype).
- Report hazard ratios (HR) with 95% confidence intervals (CI).
This approach was successfully employed to validate the prognostic relevance of ER/PR expression within molecular subgroups, demonstrating that a three-tiered classification remained significant even after adjusting for TCGA subgroups [90].
Protocol for Developing a Multi-Marker Predictive Model
Objective: To integrate multiple biomarkers and clinical variables into a machine learning model for preoperative prediction of key EC characteristics.
Materials:
- Dataset comprising clinical variables and multiple serological or molecular markers from a large patient cohort (e.g., n > 500) [91].
- Computing environment with R or Python and necessary machine learning libraries (e.g.,
caret,randomForest,glmnet).
Procedure:
- Data Preparation: Split the dataset randomly into a training cohort (70%) and an internal testing cohort (30%). Ensure no significant differences in baseline characteristics between sets.
- Model Training: Train multiple supervised learning classifiers (e.g., Random Forest, Support Vector Machine, Logistic Regression) on the training set using repeated k-fold cross-validation (e.g., 10-fold) to tune hyperparameters.
- Model Evaluation: Evaluate the performance of each model on the held-out test set using metrics including Area Under the Curve (AUC), accuracy, sensitivity, and specificity.
- Variable Importance: Determine the importance of each predictor variable using methods like Gini importance for Random Forest models.
- External Validation: The final model must be validated on a completely independent, external cohort to assess its generalizability and real-world performance.
A study utilizing 36 serological markers from 562 patients demonstrated the superiority of this approach, with a Random Forest classifier achieving AUC values between 0.81 and 0.94 for predicting diagnosis, stage, and metastasis [91].
The Scientist's Toolkit
Table 2: Essential Research Reagent Solutions for Biomarker Validation
| Reagent/Material | Function in Validation | Application Example |
|---|---|---|
| FFPE Tissue Sections | Preserves tissue morphology and biomolecules for long-term archival analysis. | Primary source for immunohistochemistry (IHC) and next-generation sequencing (NGS) [90]. |
| Primary Antibodies (ER/PR, p53, MMR proteins) | Enable specific detection of protein biomarkers via IHC. | Classification of molecular subgroups (p53abn, MMR-d) and assessment of hormonal receptor status [1] [90]. |
| Next-Generation Sequencing Panels | High-throughput detection of somatic mutations, copy number alterations, and MSI status. | Definitive molecular classification per TCGA; identification of POLE mutations [1] [88]. |
| ELISA Kits (HE4, CA125) | Quantify serum protein biomarkers with high sensitivity and specificity. | Preoperative risk stratification and monitoring of treatment response in liquid biopsies [91]. |
| Cell-Free DNA Extraction Kits | Isolate circulating tumor DNA (ctDNA) from blood samples. | Enables liquid biopsy for non-invasive tumor genotyping and monitoring of minimal residual disease [93] [88]. |
| Machine Learning Software (R, Python with libraries) | Analyze complex, high-dimensional data to build integrated predictive models. | Developing prognostic signatures that combine clinical variables with multi-omics biomarker data [91] [92]. |
Future Directions and Framework Integration
The future of biomarker validation lies in the development of comprehensive, integrative frameworks. The following diagram illustrates a proposed model that synthesizes diverse data types to generate a holistic molecular fingerprint for each patient.
Comprehensive Biomarker Framework
This Comprehensive Oncological Biomarker Framework unifies genetic, molecular, clinical, and imaging data to support individualized diagnosis, prognosis, and treatment selection [93]. Key emerging trends that will enhance this framework include:
- Liquid Biopsy and Real-Time Monitoring: Advances in circulating tumor DNA (ctDNA) and exosome profiling will enable non-invasive, real-time monitoring of disease progression and treatment response, moving beyond single-time-point biopsies [93] [94] [88].
- Artificial Intelligence and Multi-Omics Integration: AI and machine learning will be crucial for analyzing complex multi-omics datasets to uncover intricate patterns and generate more accurate predictive models than single-biomarker approaches [91] [94].
- Focus on Patient-Centric and Diverse Cohorts: Future validation studies must prioritize inclusion of diverse patient populations to ensure biomarkers are equitable and generalizable, addressing current limitations in model development [95].
The robust prognostic validation of biomarkers is indispensable for advancing precision medicine in endometrial cancer. While significant progress has been made with the integration of molecular classification and several promising serum and tissue biomarkers, their translation to clinical practice requires strict adherence to rigorous validation protocols in independent, diverse cohorts. By employing standardized experimental methodologies, leveraging machine learning for multi-marker integration, and moving towards comprehensive biomarker frameworks, researchers can successfully develop and validate tools that will ultimately refine risk stratification, predict treatment response, and improve survival outcomes for patients with endometrial cancer.
Conclusion
The validation of endometrial biomarkers in independent cohorts remains a critical bottleneck in translating research discoveries into clinical practice. Successful validation requires addressing multiple challenges simultaneously: standardizing pre-analytical procedures, accounting for biological variability, employing robust statistical methods, and utilizing advanced technological platforms. The integration of multi-omics approaches with artificial intelligence presents promising avenues for developing biomarker panels with enhanced diagnostic and prognostic capabilities. Future directions must focus on large, well-phenotyped multicenter cohorts, standardized reporting of validation studies, and the development of clinically feasible assays. Ultimately, rigorously validated biomarkers will enable earlier diagnosis, improved risk stratification, and personalized treatment strategies for endometrial disorders, significantly impacting patient outcomes and advancing women's health.
References
- 1. SEOM-GEICO clinical guidelines on endometrial cancer ... [https://pmc.ncbi.nlm.nih.gov/articles/PMC12630260/]
- 2. Extracellular vesicles as biomarkers for endometrial cancer [https://pmc.ncbi.nlm.nih.gov/articles/PMC12493225/]
- 3. Soluble immune checkpoints in endometrial cancer [https://www.frontiersin.org/journals/immunology/articles/10.3389/fimmu.2025.1721822/full]
- 4. Bridging the Gap: Translating Preclinical Biomarkers to ... [https://blog.crownbio.com/bridging-the-gap-translating-preclinical-biomarkers-to-clinical-success]
- 5. Biomarkers in Clinical Practice: Challenges & Opportunities [https://esmed.org/biomarkers-in-clinical-practice-challenges-opportunities/]
- 6. Endometrial cancer diagnostic and prognostic algorithms ... [https://www.frontiersin.org/journals/oncology/articles/10.3389/fonc.2023.1120178/full]
- 7. Leveraging Biomarkers in Endometrial Cancer Requires ... [https://www.onclive.com/view/leveraging-biomarkers-in-endometrial-cancer-requires-careful-integration-more-research]
- 8. Quantitative SWATH-based proteomic profiling of urine for ... [https://www.nature.com/articles/s41416-022-02139-0]
- 9. Identification and validation of serum metabolite ... [https://pmc.ncbi.nlm.nih.gov/articles/PMC11018850/]
- 10. A Protocol to Phenotype Bio-specimens for Discovery and ... [https://pmc.ncbi.nlm.nih.gov/articles/PMC5899676/]
- 11. Meta-signature of human endometrial receptivity [https://www.nature.com/articles/s41598-017-10098-3]
- 12. Endometrial Carcinoma Biomarker Discovery and ... [https://www.sciencedirect.com/science/article/pii/S1535947620316868]
- 13. Insights and limitations of endometrial cancer risk ... [https://pmc.ncbi.nlm.nih.gov/articles/PMC12628995/]
- 14. Extracellular vesicles as biomarkers for endometrial cancer [https://www.sciencedirect.com/science/article/pii/S1936523325002748]
- 15. Challenges in Oncology Biomarker Discovery and Validation [https://proventainternational.com/challenges-oncology-biomarker-discovery-validation/]
- 16. Biomarker Discovery and Validation: Statistical Considerations [https://pmc.ncbi.nlm.nih.gov/articles/PMC8012218/]
- 17. Endometrial (Uterine) Cancer Biomarkers Guide [https://superpower.com/cancer-biomarkers/endometrial-uterine-cancer?srsltid=AfmBOorhmmvcVG_gt5m2pls0dwOZPIx0OHGQsK1JiLVwVWthDs3h9Mr5]
- 18. Early detection, clinicopathological subtyping, and prognosis ... [https://pmc.ncbi.nlm.nih.gov/articles/PMC12495095/]
- 19. Alzheimer's disease digital biomarkers multidimensional ... [https://www.nature.com/articles/s41746-025-01640-z]
- 20. Technical Verification and Assessment of Independent ... [https://pmc.ncbi.nlm.nih.gov/articles/PMC6683797/]
- 21. Guidelines for biomarker discovery in endometrium [https://pmc.ncbi.nlm.nih.gov/articles/PMC8063681/]
- 22. Proteomic analysis uncovers biological diversity in ... [https://www.sciencedirect.com/science/article/pii/S1476558625001095]
- 23. Endometrial (Uterine) Cancer Biomarkers Guide [https://superpower.com/cancer-biomarkers/endometrial-uterine-cancer?srsltid=AfmBOopwR-HeddWVvSUaVpA9loxucP2TUWHm8VLsgpCD3lqptD-uTJz0]
- 24. Present progress in biomarker discovery of endometrial ... [https://clinicalproteomicsjournal.biomedcentral.com/articles/10.1186/s12014-025-09528-6]
- 25. Final validation of the ProMisE molecular classifier for ... [https://www.sciencedirect.com/science/article/pii/S0923753419345326]
- 26. Biomarkers and immunotherapy in endometrial cancer [https://www.frontiersin.org/journals/immunology/articles/10.3389/fimmu.2025.1684549/full]
- 27. Integrating Multi-Omics in Endometrial Cancer [https://www.mdpi.com/2073-4409/14/17/1404]
- 28. Multi-omics strategies for biomarker discovery and application ... [https://pmc.ncbi.nlm.nih.gov/articles/PMC12638490/]
- 29. Handling missing rows in multi-omics data integration [https://bmcbioinformatics.biomedcentral.com/articles/10.1186/s12859-016-1273-5]
- 30. Current and Emerging Prognostic Biomarkers in ... [https://pmc.ncbi.nlm.nih.gov/articles/PMC9072738/]
- 31. Machine Learning in Biomarker Discovery for Precision ... [https://esmed.org/machine-learning-in-biomarker-discovery-for-precision-medicine/]
- 32. Explainable machine learning framework for biomarker ... [https://www.nature.com/articles/s41598-025-98948-3]
- 33. Machine learning framework to extract the biomarker ... [https://www.sciencedirect.com/science/article/pii/S2001037024000618]
- 34. EPHect | Harmonising endometriosis research [https://ephect.org/]
- 35. Multicenter Biobanking Consistency: World Endometriosis ... [https://www.thermofisher.com/blog/biobanking/establishing-multicenter-biobanking-consistency-world-endometriosis-research-foundation/]
- 36. EPHect standards for physical examination in endometriosis [https://www.ephect.org/tools/physical-examination]
- 37. WERF Endometriosis Phenome and Biobanking ... [https://pubmed.ncbi.nlm.nih.gov/40628402/]
- 38. Protocol for the Cultural Translation and Adaptation of ... [https://pubmed.ncbi.nlm.nih.gov/34816197/]
- 39. Development and Validation of an Endometriosis ... [https://www.mdpi.com/2218-273X/13/7/1052]
- 40. Circulating inflammatory biomarkers and endometriosis ... [https://www.nature.com/articles/s44294-025-00110-x]
- 41. Mass Spectrometry Advancements and Applications for ... [https://www.mdpi.com/1422-0067/25/18/9880]
- 42. Identification and validation of serum metabolite ... [https://link.springer.com/article/10.1038/s44321-024-00033-1]
- 43. Identification and validation of serum metabolite ... [https://pubmed.ncbi.nlm.nih.gov/38355748/]
- 44. Five common pre-analytical variables - Streck [https://www.streck.com/blog/five-common-pre-analytical-variables/]
- 45. Independent Tissue-Based Biomarkers in Endometrioid ... [https://pmc.ncbi.nlm.nih.gov/articles/PMC10416921/]
- 46. Recommendations and Best Practices for Standardizing the ... [https://pmc.ncbi.nlm.nih.gov/articles/PMC7344701/]
- 47. Standard Operating Procedures for Serum and Plasma ... [https://pmc.ncbi.nlm.nih.gov/articles/PMC2655764/]
- 48. Improving Replication in Endometrial Omics [https://www.mdpi.com/1422-0067/26/2/857]
- 49. Determining Menstrual Cycle Phase - PubMed Central - NIH [https://pmc.ncbi.nlm.nih.gov/articles/PMC10714354/]
- 50. Determining Menstrual Phase in Human Biobehavioral ... [https://pmc.ncbi.nlm.nih.gov/articles/PMC4821777/]
- 51. Extensive monitoring of the natural menstrual cycle using ... [https://www.sciencedirect.com/science/article/pii/S2352551721000111]
- 52. Predicting risk of endometrial failure: a biomarker signature ... [https://www.sciencedirect.com/science/article/pii/S0015028224001900]
- 53. Assay Reproducibility in Hemostasis Diagnostics [https://www.appliedclinicaltrialsonline.com/view/assay-reproducibility-hemostasis-diagnostics-trial-outcomes]
- 54. Beyond the Microscope: Integrating Liquid Biopsies into the ... [https://pmc.ncbi.nlm.nih.gov/articles/PMC12386448/]
- 55. Diagnostic Accuracy of Liquid Biomarkers for the Non- ... [https://www.mdpi.com/2072-6694/14/19/4666]
- 56. factors shaping assay yield and variability in microfluidics ... [https://pubs.rsc.org/en/content/articlehtml/2025/lc/d5lc00575b]
- 57. Clinical and analytical validation of MI Cancer Seek ® , a ... [https://www.oncotarget.com/article/28761/text/]
- 58. Identification of predictive biomarkers for endometrial ... [https://pmc.ncbi.nlm.nih.gov/articles/PMC10568780/]
- 59. Advanced mass spectrometry techniques for monitoring ... [https://www.sciencedirect.com/science/article/pii/S0167779925003117]
- 60. Potency Assay Variability Estimation in Practice - PMC [https://pmc.ncbi.nlm.nih.gov/articles/PMC11788244/]
- 61. Challenges in developing robust potency assays for ADCs [https://www.drugtargetreview.com/article/181021/challenges-in-developing-robust-potency-assays-for-adcs/]
- 62. Multi-Steroid Profiling and Machine Learning Reveal ... [https://www.mdpi.com/2072-6694/17/10/1679]
- 63. Predictive biomarkers in endometrial carcinomas: a review of ... [https://surgexppathol.biomedcentral.com/articles/10.1186/s42047-024-00164-2]
- 64. Real world perspectives on endometriosis disease phenotyping through surgery, omics, health data, and artificial intelligence - PMC [https://pmc.ncbi.nlm.nih.gov/articles/PMC11802455/]
- 65. Potential biomarkers for early detection of endometriosis [https://link.springer.com/article/10.1007/s13353-025-01021-y]
- 66. The Molecular and Cellular Mechanisms of Endometriosis [https://pmc.ncbi.nlm.nih.gov/articles/PMC11941934/]
- 67. A multi-level investigation of the genetic relationship between endometriosis and ovarian cancer histotypes - PMC [https://pmc.ncbi.nlm.nih.gov/articles/PMC9040176/]
- 68. Fibroblast heterogeneity and FN1-mediated signaling in ... [https://www.frontiersin.org/journals/immunology/articles/10.3389/fimmu.2025.1680849/full]
- 69. Extracellular Trap-Related Genes as Potential Diagnostic ... [https://pmc.ncbi.nlm.nih.gov/articles/PMC12640579/]
- 70. Identification and Validation of Novel Combinatorial ... [https://www.medrxiv.org/content/10.1101/2025.08.13.25333595v2]
- 71. Circulating inflammatory biomarkers and endometriosis lesion ... [https://pmc.ncbi.nlm.nih.gov/articles/PMC12578628/]
- 72. Targeted Metabolomic Serum Analysis of Patients with ... [https://pmc.ncbi.nlm.nih.gov/articles/PMC12298217/]
- 73. Identification and subsequent validation of transcriptomic ... [https://www.nature.com/articles/s41598-023-40994-w]
- 74. Unveiling Metabolic Subtypes in Endometrial Cancer Cell ... [https://www.mdpi.com/1422-0067/26/19/9573]
- 75. CA125 as a predictor of endometrial cancer ... [https://www.nature.com/articles/s41598-022-22026-1]
- 76. Cancer Antigen 125 Levels are Significantly Associated ... [https://www.sciencedirect.com/science/article/pii/S1048891X2403233X]
- 77. A high-risk prediction model for endometrial cancer [https://pmc.ncbi.nlm.nih.gov/articles/PMC12432555/]
- 78. Pilot Study to Establish a Novel Five-Gene Biomarker ... [https://pubmed.ncbi.nlm.nih.gov/32039004/]
- 79. PERSONALIZING CA125 LEVELS USING TUMOR ... [https://pmc.ncbi.nlm.nih.gov/articles/PMC12506169/]
- 80. An integrated multi-tissue approach for endometriosis ... [https://pmc.ncbi.nlm.nih.gov/articles/PMC10858544/]
- 81. An integrated multi-tissue approach for endometriosis ... [https://pubmed.ncbi.nlm.nih.gov/38341605/]
- 82. Can the MMP-9/NGAL ratio be a diagnostic biomarker for ... [https://www.frontiersin.org/journals/endocrinology/articles/10.3389/fendo.2025.1624717/full]
- 83. Can the MMP-9/NGAL ratio be a diagnostic biomarker ... [https://pmc.ncbi.nlm.nih.gov/articles/PMC12343217/]
- 84. Circulating microRNAs and endometriosis - PubMed Central [https://pmc.ncbi.nlm.nih.gov/articles/PMC12538115/]
- 85. Strategies for validating biomarkers using data from a ... [https://pmc.ncbi.nlm.nih.gov/articles/PMC8552500/]
- 86. Establishment and validation of a prognostic nomogram for ... [https://www.nature.com/articles/s41598-025-91261-z]
- 87. A diagnostic algorithm combining clinical and molecular data ... [https://bmcmedicine.biomedcentral.com/articles/10.1186/1741-7015-9-130]
- 88. Present progress in biomarker discovery of endometrial ... [https://pmc.ncbi.nlm.nih.gov/articles/PMC12032760/]
- 89. The discovery of biomarkers for endometrial cancer [https://pubmed.ncbi.nlm.nih.gov/40456010/]
- 90. Hormonal biomarkers remain prognostically relevant within ... [https://www.sciencedirect.com/science/article/pii/S0090825824011855]
- 91. An assisted diagnostic and prognostic model for ... [https://www.nature.com/articles/s41598-025-23853-8]
- 92. Diabetes-associated differentially expressed genes as ... [https://www.frontiersin.org/journals/oncology/articles/10.3389/fonc.2025.1591040/full]
- 93. A Comprehensive Oncological Biomarker Framework Guiding ... [https://pmc.ncbi.nlm.nih.gov/articles/PMC12466961/]
- 94. Challenges and Future Trends in Biomarker Analysis for ... [https://blog.crownbio.com/challenges-and-future-trends-in-biomarker-analysis-for-clinical-research-whats-ahead-in-2025]
- 95. Insights and limitations of endometrial cancer risk prediction ... [https://bmccancer.biomedcentral.com/articles/10.1186/s12885-025-15200-x]