Optimizing Sperm Image Pre-processing: Advanced Techniques for Enhanced AI Analysis in Male Fertility Research
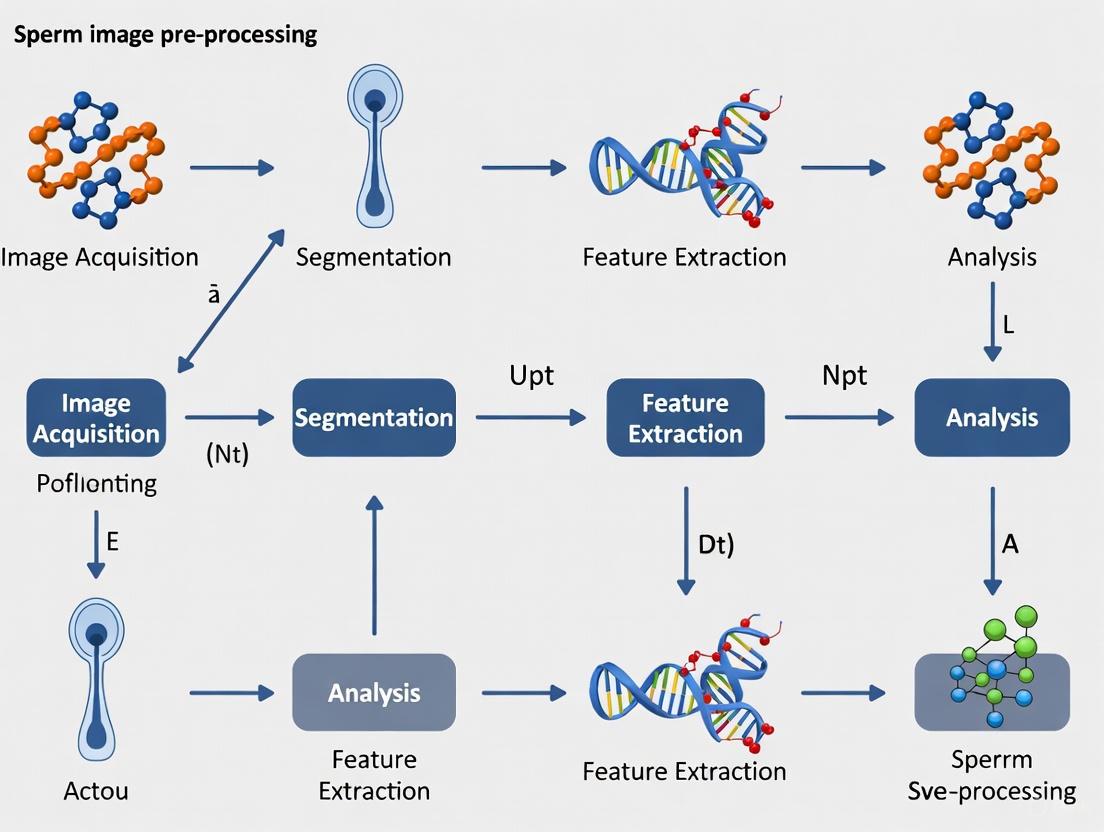
This article provides a comprehensive guide to sperm image pre-processing, a critical step for accurate automated morphology analysis in male fertility diagnostics.
Optimizing Sperm Image Pre-processing: Advanced Techniques for Enhanced AI Analysis in Male Fertility Research
Abstract
This article provides a comprehensive guide to sperm image pre-processing, a critical step for accurate automated morphology analysis in male fertility diagnostics. Aimed at researchers and biomedical professionals, it explores the foundational challenges of manual assessment, details state-of-the-art methodological approaches including data augmentation and noise reduction, and addresses common troubleshooting scenarios. Furthermore, it presents a comparative validation of emerging deep learning architectures, such as Vision Transformers, against conventional methods. The synthesis of these elements offers a roadmap for developing robust, standardized, and highly accurate computational tools for sperm image analysis, with significant implications for improving assisted reproductive technology outcomes.
The Critical Role of Pre-processing in Overcoming Sperm Morphology Analysis Challenges
Frequently Asked Questions (FAQs)
Q1: What are the primary sources of subjectivity in manual sperm morphology assessment? The primary sources of subjectivity are the reliance on visual estimation under a microscope and the application of strict morphological criteria (like Tygerberg's) by human technicians. This leads to significant inter- and intra-laboratory variability in classifying a sperm as "normal." Factors such as technician experience, visual fatigue, and subtle differences in the interpretation of borderline cases for head, midpiece, and tail defects contribute heavily to inconsistent results [1] [2].
Q2: How does manual assessment's reliability compare to Computer-Aided Sperm Analysis (CASA)? While manual assessment is the traditional standard, it is prone to human error and is relatively slow. In contrast, CASA systems offer greater objectivity, reproducibility, and high-throughput analysis. However, CASA performance can be hindered by high sperm concentration, where overlapping sperm cells lead to detection errors, and requires rigorous standardization and validation to ensure accuracy across different instruments [2].
Q3: What are the key WHO reference standards for normal sperm morphology? According to the World Health Organization (WHO) laboratory manual, the lower reference limit for normal sperm morphology is 4% (5th percentile, 95% CI: 3–4%), as established using strict criteria. This means fertility may be impaired if the percentage of morphologically normal forms falls below this threshold [1].
Q4: What specific morphological criteria define a "normal" sperm cell? The WHO standard defines a normal sperm by the following characteristics [2]:
- Head: Smooth, oval configuration, 3–5 μm in length and 2–3 μm in width.
- Midpiece: Slender, less than 1 μm in width, 5–7.5 μm long, and axially attached to the head.
- Tail: Uniform, thinner than the midpiece, approximately 45 μm long, and without sharp bends.
Q5: Why is image pre-processing critical for automated sperm morphology analysis? Consistent and minimal pre-processing is fundamental for accurate automated analysis. It ensures that the input images are standardized, thereby reducing background noise and enhancing relevant features without introducing artifacts. This directly improves the reliability of downstream tasks like segmentation, classification, and morphological measurement. Adherence to image integrity guidelines, such as applying adjustments to the entire image and avoiding oversaturation, is mandatory for scientific validity [3] [4].
Troubleshooting Guides
Guide 1: Addressing High Variability in Morphology Scores Between Technicians
Problem: Significant disagreement in normal morphology percentages when the same sample is assessed by different technicians.
| Possible Cause | Diagnostic Steps | Solution |
|---|---|---|
| Inconsistent application of "strict" criteria. | Review classified images together; have technicians re-score a set of reference images. | Implement regular, mandatory calibration sessions using standardized training slides. Adopt a double-blind scoring system for critical samples. |
| Fatigue and high workload. | Monitor scoring results over time to identify drift. | Enforce periodic rest breaks and limit continuous microscope evaluation sessions. |
| Suboptimal sample preparation. | Check for staining consistency and presence of debris. | Standardize the staining protocol (e.g., Diff-Quik, Papanicolaou) and ensure uniform smear thickness across all samples. |
Guide 2: Managing Borderline Morphology Classifications
Problem: Difficulty in consistently classifying spermatozoa with subtle or mixed defects.
| Possible Cause | Diagnostic Steps | Solution |
|---|---|---|
| Ambiguity in classification rules for specific defects. | Create a shared digital library of "borderline" cases for group discussion and consensus. | Develop a detailed, visual internal standard operating procedure (SOP) with clear examples of accept/reject decisions for vague defects. |
| Lack of high-quality imaging. | Capture still images of borderline cells during analysis. | Use a high-resolution microscope with oil immersion and digital imaging capabilities to capture and archive stills of difficult cells for secondary review and training. |
The following table summarizes the key reference values for semen parameters as defined by the WHO, which provide the essential context for interpreting morphology results [1].
Table 1: WHO Laboratory Manual Lower Reference Limits for Semen Analysis
| Parameter | Lower Reference Limit (5th Percentile) | 95% Confidence Interval |
|---|---|---|
| Semen Volume | 1.5 ml | 1.4 – 1.7 |
| Sperm Concentration | 15 million/ml | 12 – 16 |
| Total Sperm Number | 39 million per ejaculate | 33 – 46 |
| Normal Morphology (Strict Criteria) | 4% | 3 – 4 |
| Total Motility | 40% | 39 – 42 |
| Vitality | 58% | 55 – 63 |
Experimental Protocols
Protocol 1: Standardized Sperm Morphology Staining and Assessment (Based on WHO Guidelines)
Title: Manual Sperm Morphology Assessment Using Strict Criteria
Principle: This protocol describes the staining and evaluation of human spermatozoa for morphological anomalies based on the WHO's strict criteria, aiming to minimize subjectivity through standardized procedures.
Reagents and Materials:
- Microscope slides
- Fixative solution (e.g., 95% ethanol)
- Staining solutions (e.g., Diff-Quik, Hematolor, or Papanicolaou stains)
- Immersion oil
- Bright-field microscope with 100x oil immersion objective
Procedure:
- Smear Preparation: Create a thin, uniform smear of a well-mixed liquefied semen sample on a clean glass slide. Allow to air-dry completely.
- Fixation: Immerse the air-dried smear in 95% ethanol for 15 minutes. Allow to dry.
- Staining: Follow the specific protocol for the chosen stain (e.g., for Diff-Quik: dip in Solution A for 10 seconds, Solution B for 5 seconds, then rinse gently with water).
- Microscopy: Examine the stained smear under oil immersion at 1000x total magnification.
- Assessment: Systematically scan the slide and evaluate at least 200 spermatozoa. Classify each sperm as either "normal" or having one or more defects (head, neck/midpiece, tail, or cytoplasmic droplets) according to the strict morphological criteria [1].
- Calculation: Calculate the percentage of morphologically normal forms.
Safety Notes: Treat all semen samples as potentially infectious and handle using appropriate personal protective equipment (PPE) and biosafety level 2 practices.
Protocol 2: Image Acquisition for Automated Analysis
Title: Standardized Digital Image Capture for CASA and ML Models
Principle: To acquire consistent, high-quality digital images of sperm cells for input into Computer-Aided Sperm Analysis (CASA) systems or machine learning algorithms, ensuring reproducible pre-processing.
Reagents and Materials:
- Prepared sperm morphology slides (from Protocol 1)
- Research-grade microscope with a high-resolution digital camera
- Calibrated micrometer
Procedure:
- System Calibration: Calibrate the digital imaging system using a stage micrometer to define the pixel-to-micrometer ratio accurately.
- Image Settings: Set the microscope Kohler illumination for even lighting. Use a consistent magnification (100x oil immersion objective). Set a fixed resolution (e.g., 1920x1080), bit depth, and avoid using automatic gain or gamma adjustments.
- Image Capture: Capture images from multiple, randomly selected fields of view to ensure a representative sample. Each field should be in sharp focus.
- Data Logging: In the methods section, document all key acquisition details including the microscope model, camera model, objective lens specifications, and software used, as per image integrity standards [4].
- Pre-processing (Minimal): If adjustments like brightness/contrast are necessary for clarity, apply them uniformly across the entire image. Document any such adjustments in the figure legend or methods [3].
Experimental Workflow Visualization
Diagram: Sperm Morphology Analysis Workflow
Diagram: Subjectivity Factors in Manual Assessment
The Scientist's Toolkit: Research Reagent Solutions
Table 2: Essential Materials for Sperm Morphology Research
| Item | Function/Description |
|---|---|
| Diff-Quik Staining Kit | A rapid Romanowsky-type stain for differential staining of sperm cell components (head, midpiece, tail), enabling clear visualization of morphology. |
| Papanicolaou Stain | A more complex, multi-step staining procedure often considered the gold standard for detailed morphological assessment of sperm heads. |
| Computer-Aided Sperm Analysis (CASA) System | An integrated system comprising a microscope, camera, and software for the automated, objective analysis of sperm concentration, motility, and morphology. |
| High-Resolution Microscope & Camera | A research-grade microscope with a 100x oil immersion objective and a high-resolution digital camera is essential for acquiring images for both manual analysis and CASA/ML input. |
| Strict Criteria Classification Guide | A visual guide, often based on the WHO manual, containing reference images of normal and abnormal sperm forms to standardize technician scoring. |
| Ant Colony Optimization (ACO) Algorithm | A nature-inspired optimization algorithm that can be integrated with machine learning models to enhance feature selection and predictive accuracy in classifying sperm health [5]. |
Frequently Asked Questions (FAQs)
Q1: What are the primary sources of noise and debris in sperm images, and how do they impact analysis? The main sources include poorly stained semen smears, insufficient lighting during microscopy, and the presence of cellular fragments or impurities in the seminal fluid [6] [7]. These factors significantly compromise the accuracy of both manual and Computer-Assisted Sperm Analysis (CASA) by obscuring sperm morphology, leading to misclassification of sperm cells and impurities [8] [9]. In automated systems, this can cause an overestimation or underestimation of key parameters like sperm concentration and morphology [8].
Q2: How does staining variability affect the reliability of sperm morphology assessment? Different staining techniques (e.g., Giemsa, Spermac, Papanicolaou) and smear preparation protocols yield varying levels of detail and contrast [10]. This variability is a major cause of significant inter- and intra-laboratory variation, making it difficult to compare results across different studies or clinics [10] [7]. For instance, the same sample assessed with Giemsa (using WHO criteria) versus Spermac stain (using strict criteria) can yield different percentages of normal sperm, directly affecting the diagnosis of teratozoospermia [10].
Q3: What advanced methods are available to mitigate the impact of debris in automated semen analysis? Deep learning-based detection models have shown superior performance in distinguishing sperm from debris compared to traditional image processing [11]. For example, an improved YOLO-v7 model achieved an Average Precision (AP50) of 95.1% for sperm detection and 62.4% for impurity detection, significantly reducing the need for manual intervention [11]. Furthermore, ensuring that operators of automated systems like the SQA-V are highly competent in correctly assessing debris levels is crucial, as misestimation can directly skew results [8].
Q4: Which imaging classification models demonstrate the best robustness against noise? Recent comparative studies indicate that Visual Transformer (VT) models, which are based on global information, exhibit stronger robustness against conventional noise and adversarial attacks compared to Convolutional Neural Network (CNN) models that rely on local information [6]. Under the influence of Poisson noise, one study showed VT models maintained an accuracy of 91.08%, a sperm recall of 93.8%, and an impurity precision of 91.3%, with minimal performance degradation [6].
Troubleshooting Guides
Quantitative Impact of Common Issues on Sperm Analysis
Table 1: Impact of Analysis Challenges on Key Sperm Parameters
| Challenge | Affected Parameter | Impact Description | Quantitative Effect | Citation |
|---|---|---|---|---|
| Noise in Imaging | Deep Learning Model Accuracy | Reduces classification accuracy of sperm and impurities under noisy conditions. | Accuracy drop from 91.45% to 91.08% (Poisson noise); Impurity Precision: 92.7% to 91.3%. | [6] |
| Debris in Sample (Automated System) | Sperm Concentration | Underestimation of debris levels leads to overestimation of sperm concentration. | High correlation with manual count (rho=0.987) requires correct debris assessment. | [8] |
| Progressive Motility | Overestimation of debris levels leads to increased motility readings. | High correlation (rho=0.949) dependent on accurate debris level input. | [8] | |
| Normal Morphology | Overestimation of debris artificially increases % of normal forms. | Moderate correlation (rho=0.694); highly dependent on operator's debris assessment. | [8] | |
| Staining Variability | Normal Morphology Diagnosis | Concordance in teratozoospermia diagnosis using different stains/criteria. | Concordant diagnosis in 45 out of 49 cases (91.8%). | [10] |
| Inter-Observer Agreement | Agreement between different technicians assessing morphology. | Kappa values: 0.700 (WHO criteria) and 0.715 (Strict criteria). | [10] |
Step-by-Step Troubleshooting Protocols
Protocol A: Addressing Staining Variability and Improving Morphology Assessment
- Problem: Inconsistent morphology scores due to different staining methods.
- Objective: Standardize staining and assessment to minimize inter-laboratory variation.
- Materials: Spermac stain kit, Quinn’s Sperm Washing Medium, centrifuge, brightfield microscope with oil immersion.
- Procedure: a. Sample Preparation: After liquefaction, wash an aliquot of semen with Quinn’s Sperm Washing Medium and centrifuge at 300 g for 10 minutes [10]. b. Smear Preparation: Remove the supernatant, resuspend the pellet in 0.5 mL of medium. Place 10 µL of washed semen on a glass slide, air-dry, and fix [10]. c. Staining: Follow the specific protocol for Spermac stain: wash the smear with distilled water, apply the stain, then wash again with distilled water [10]. d. Assessment: Use brightfield illumination at 1000x magnification with oil immersion. Assess at least 200 spermatozoa per smear according to strict (Tygerberg) criteria [10].
- Expected Outcome: This method reduces borderline forms considered as normal and provides a more stringent assessment, enhancing objectivity and decreasing variability [10].
Protocol B: Minimizing Debris Interference in Automated Sperm Analysis
- Problem: Debris causing inaccurate readings for concentration, motility, and morphology on automated systems.
- Objective: To correctly identify and input debris levels to ensure the automated analyzer provides accurate results.
- Materials: SQA-V automated semen analyzer (or similar), microscope.
- Procedure: a. Initial Calibration: Prior to sample analysis, ensure the automated system is properly calibrated. b. Manual Debris Assessment: Using a microscope, independently assess the level of debris in the sample. Categorize it into one of the four standard levels: None/Few, Moderate, Many, or Gross [8]. c. Input and Analysis: Input the correct debris level category into the SQA-V system before initiating the automated analysis of the sample [8]. d. Verification: For critical samples, consider verifying automated results with a manual count, especially if the results are inconsistent with clinical expectations.
- Troubleshooting Tip: Underestimation of debris will falsely increase the sperm concentration reading and decrease motility and morphology percentages. Overestimation of debris will have the opposite effect [8].
Experimental Protocols from Key Research
Deep Learning Model Training for Robust Sperm Image Classification
- Background: Deep learning models can automate and standardize sperm morphology analysis, but their performance is highly dependent on the quality and size of the training dataset [7] [9].
- Objective: To develop a Convolutional Neural Network (CNN) model for classifying sperm morphology according to the modified David classification, enhancing the dataset using augmentation techniques to improve model robustness [7].
- Materials: MMC CASA system for image acquisition, RAL Diagnostics staining kit, Python 3.8 with deep learning libraries (e.g., TensorFlow, PyTorch).
- Procedure: a. Dataset Creation (SMD/MSS): Capture images of individual spermatozoa from stained smears. Have three independent experts classify each spermatozoon into one of 12 morphological defect classes based on the modified David classification [7]. b. Data Augmentation: To balance the representation of different morphological classes and increase dataset size, apply augmentation techniques such as rotation, flipping, and scaling to the original images. One study expanded a dataset from 1,000 to 6,035 images using these methods [7]. c. Image Pre-processing: Resize images to a uniform size (e.g., 80x80 pixels) and convert them to grayscale. Normalize pixel values to a common scale to facilitate model training [7]. d. Model Training and Testing: Randomly partition the augmented dataset into a training set (80%) and a testing set (20%). Train the CNN model on the training set and evaluate its final performance on the unseen testing set [7].
- Expected Outcome: A deep learning model capable of classifying sperm morphology with an accuracy that can range from 55% to 92%, reducing subjectivity and workload [7].
Microfluidic Sperm Separation for High-Quality Sample Preparation
- Background: Traditional sperm separation methods like density gradient centrifugation can cause DNA fragmentation and have low recovery rates. Microfluidic devices leverage sperm's intrinsic behavior (rheotaxis) to gently isolate high-motility sperm [12].
- Objective: To separate motile sperm with improved morphology from raw human semen using a simple, rapid, and centrifugation-free microfluidic device.
- Materials: Fabricated PDMS microfluidic device (four chambers interconnected by channels), raw human semen sample, syringe pump.
- Procedure: a. Device Priming: Introduce a medium into the device to remove air bubbles and prepare the channels. b. Sample Loading: Introduce the raw, unwashed semen sample into the device's inlet. c. Flow Control: Use a syringe pump to create a low shear rate flow (optimized at 40-50 nL/s) through the device. This flow encourages motile and morphologically normal sperm to exhibit rheotaxis (swimming against the flow) and navigate to specific isolation chambers [12]. d. Sample Collection: After a short runtime (under 5 minutes), increase the flow rate to 500 nL/s to recover the separated, high-quality sperm from the outlet of the isolation chambers [12].
- Expected Outcome: The method can achieve up to 100% motility in the isolated sperm fraction and improve the proportion of morphologically normal sperm by up to 56%, providing superior samples for Assisted Reproductive Technology (ART) [12].
Visualization Diagrams
Sperm Analysis Challenge-Solution Framework
Sperm Analysis Challenge-Solution Map
Microfluidic Sperm Separation Workflow
Microfluidic Sperm Separation Process
The Scientist's Toolkit: Research Reagent Solutions
Table 2: Essential Materials and Reagents for Sperm Imaging and Analysis
| Item Name | Function/Application | Key Feature/Benefit | Citation |
|---|---|---|---|
| Spermac Stain | Staining for morphology assessment by strict criteria. | Provides clear delineation of sperm structures (head, acrosome, midpiece, tail) for precise measurement. | [10] |
| Giemsa Stain | Staining for morphology assessment by WHO criteria. | A common stain for general sperm morphology and differential counting of leukocytes/immature cells. | [10] |
| Quinn’s Sperm Washing Medium | Preparation of semen samples for staining. | Used to wash semen samples prior to smear preparation, removing seminal plasma. | [10] |
| RAL Diagnostics Staining Kit | Staining for morphology based on David's classification. | Used in the creation of datasets for deep learning model training. | [7] |
| HyperSperm Preparation Media | Sequential media for sperm capacitation. | Enhances sperm hyperactivation, leading to improved blastocyst development rates in IVF. | [13] |
| PDMS-based Microfluidic Device | Sperm separation from raw semen. | Uses rheotaxis and parallelization for centrifugation-free, rapid (under 5 min) isolation of motile sperm. | [12] |
Technical Support Center
Frequently Asked Questions (FAQs)
Q1: Why does my deep learning model for sperm head classification perform poorly despite having a large number of images? Poor performance with a large image dataset often stems from underlying data quality issues rather than model architecture. Common causes include noisy labels, where sperm images are misclassified by experts [7] [14], class imbalance, where certain morphological defect classes are underrepresented [7] [15], and low image quality due to factors like insufficient lighting or poorly stained semen smears [7]. A data-centric approach, focusing on improving data quality through techniques like confident learning to detect mislabeled images and data augmentation to balance classes, has been shown to improve performance by at least 3% compared to a model-centric approach [14].
Q2: What are the most effective methods to detect and correct mislabeled sperm images in my dataset? The most effective method involves using confident learning, a technique that estimates the noise in labels and identifies examples with a high probability of being mislabeled [14]. This is done by calculating a probability threshold for each classification; instances with a probability distribution below this optimized threshold are flagged as potential noisy labels [14]. These flagged images should then be reviewed and corrected through human annotation [14]. For duplicate images, which can also skew model training, using a multi-stage hashing technique involving Perceptual Hashing (pHash) is effective for removal [14].
Q3: How can I improve my model's ability to generalize to new, unseen sperm samples? Generalizability is heavily influenced by the representativeness and quality of the training data [16] [15]. To improve it:
- Ensure Dataset Diversity: Your training data should cover the biological variability and different staining conditions encountered in real-world clinical practice [15].
- Apply Data Augmentation: Use techniques like rotation to artificially create more varied examples of underrepresented morphological classes, making the dataset more balanced and robust [7] [14].
- Remove Duplicates and Noisy Labels: This prevents the model from overfitting to specific, potentially erroneous, data points [14].
- Implement Continuous Monitoring: After deployment, use automated data quality checks to monitor for performance degradation and retrain the model periodically with new, curated data [17].
Troubleshooting Guides
Problem: Model performance is inconsistent with real-world data after promising validation results. This indicates a data drift or data quality mismatch between your training set and production environment [17].
- Step 1: Profile Incoming Data. Use automated data quality checks to compare the statistical properties (e.g., mean, distribution) of incoming real-world data against your training dataset [17].
- Step 2: Check for New Artifacts. Investigate if new, unseen image artifacts are present, such as different staining patterns or debris introduced during new sample preparation cycles [7] [18].
- Step 3: Retrain with New Data. Create a new version of your model by incorporating a carefully validated subset of the new real-world data into your training pipeline [17]. Continuously monitor performance to ensure improvements [17].
Problem: The deep learning model is biased towards predicting "normal" morphology and misses rare defects. This is a classic symptom of a severe class imbalance in your training dataset [7] [15].
- Step 1: Conduct Class Distribution Analysis. Calculate the number of images per morphological class (e.g., normal, tapered head, coiled tail) to identify underrepresented categories [7].
- Step 2: Apply Data-Level Techniques.
- Step 3: Consider Algorithm-Level Techniques. If data-level methods are insufficient, adjust the loss function (e.g., using weighted cross-entropy) to penalize misclassifications on the minority classes more heavily [15].
Quantitative Data on Data Quality Impact
Table 1: Performance Comparison of Model-Centric vs. Data-Centric Approaches on Benchmark Datasets This table summarizes the findings from a study that systematically compared the two approaches using the same ResNet-18 model architecture [14].
| Dataset | Model-Centric Approach (Accuracy) | Data-Centric Approach (Accuracy) | Relative Performance Improvement |
|---|---|---|---|
| MNIST | Baseline (Not Specified) | Not Specified | ≥ 3% [14] |
| Fashion MNIST | Baseline (Not Specified) | Not Specified | ≥ 3% [14] |
| CIFAR-10 | Baseline (Not Specified) | Not Specified | ≥ 3% [14] |
Table 2: Common Data Quality Issues in Sperm Image Analysis and Their Impact This table outlines specific data issues relevant to the domain of sperm morphology analysis.
| Data Quality Issue | Impact on Deep Learning Model | Relevant Technique for Mitigation |
|---|---|---|
| Noisy Labels [14] | Model learns incorrect patterns, reducing accuracy [15]. | Confident Learning & Human Re-annotation [14] |
| Class Imbalance [7] [15] | Model is biased toward majority classes, failing to detect rare defects [15]. | Data Augmentation [7] [14] |
| Duplicate Images [14] | Inflates validation performance, causes overfitting [14]. | Multi-stage Hashing (pHash, CityHash) [14] |
| Low Image Quality [7] | Obscures morphological features, hindering learning. | Image Pre-processing (Denoising, Normalization) [7] |
Detailed Experimental Protocols
Protocol 1: Implementing a Data-Centric Workflow for Sperm Morphology Classification This protocol is based on methodologies used to create the SMD/MSS dataset and improve model performance through data quality [7] [14].
Data Acquisition & Expert Labeling:
- Acquire images of individual spermatozoa using a system like the MMC CASA system with a 100x oil immersion objective [7].
- Have multiple experts (e.g., three) classify each spermatozoon independently based on a standardized classification system like the modified David classification (which includes 12 classes for head, midpiece, and tail defects) [7].
- Compile a ground truth file that includes the image name, all expert classifications, and morphometric data [7].
Data Quality Enhancement:
- Remove Duplicates: Apply a multi-stage hashing process. Use Perceptual Hashing (pHash) to identify and remove duplicate or near-duplicate images to prevent dataset bias [14].
- Detect Noisy Labels: Use confident learning to analyze the expert classifications and probability distributions from an initial model to identify images with a high likelihood of being mislabeled [14].
- Correct Labels: Re-annotate the images flagged in the previous step through a consensus review by experts [14].
- Address Class Imbalance: Apply data augmentation techniques (e.g., rotation, flipping) to the underrepresented morphological classes to create a more balanced dataset [7] [14].
Model Training & Evaluation:
Diagram 1: Data-centric workflow for sperm image analysis.
Protocol 2: Assessing Image Quality for Microscopy Data This protocol outlines key factors to assess when ensuring the quality of sperm microscopy images, based on standard image quality factors [18].
Sharpness (MTF - Modulation Transfer Function) Assessment:
- Importance: Determines the amount of detail an image can convey; arguably the most important factor for identifying morphological defects [18].
- Method: Use slanted-edge patterns (e.g., with SFR or SFRplus modules) to measure the Spatial Frequency Response (SFR), also called MTF. The 50% MTF frequency correlates well with perceived sharpness [18].
Noise Measurement:
Tonal Response (Contrast) Check:
- Importance: Ensures that the staining allows for clear differentiation between the sperm cell and its background, as well as between different parts of the sperm [18].
- Method: Use grayscale step charts to measure the tonal response curve of the imaging system. Higher contrast generally improves quality but must be balanced to avoid clipping of details [18].
The Scientist's Toolkit: Research Reagent Solutions
Table 3: Essential Materials for Sperm Image Pre-processing and Analysis
| Item | Function / Purpose | Example / Specification |
|---|---|---|
| RAL Diagnostics Staining Kit | Stains sperm smears to provide contrast for morphological assessment under a microscope [7]. | Standard staining kit as used in the SMD/MSS dataset creation [7]. |
| MMC CASA System | An integrated system for Computer-Assisted Semen Analysis. Used for automated image acquisition from sperm smears, often with morphometric capabilities [7]. | Microscope with digital camera and software for capturing and storing individual sperm images [7]. |
| X100 Oil Immersion Objective | A high-magnification microscope objective lens essential for visualizing detailed morphological structures of sperm heads, midpieces, and tails [7]. | Standard optical component for high-resolution microscopy [7]. |
| Slanted-Edge MTF Chart | A test chart used to quantitatively measure the sharpness (Modulation Transfer Function) of the entire imaging system (lens, sensor, software) [18]. | eSFR ISO or SFRplus chart from commercial providers [18]. |
| ColorChecker Chart | Used to assess and calibrate color accuracy and tonal response of the imaging system, ensuring consistency across different samples and sessions [18]. | X-Rite ColorChecker or similar [18]. |
This guide provides technical support for researchers working with key public datasets for sperm morphology analysis: HuSHeM, SMIDS, and SMD/MSS. The standardization of sperm image pre-processing is critical for developing robust, generalizable AI models in male fertility diagnostics. The table below summarizes the core characteristics of these datasets for your initial assessment [7] [19] [20].
Table 1: Key Characteristics of Sperm Morphology Datasets
| Feature | HuSHeM & SCIAN-MorphoSpermGS | SMIDS | SMD/MSS |
|---|---|---|---|
| Primary Focus | Sperm head, flagellum, vacuole, and acrosome morphology [20] | A general-purpose dataset for feature detection; images labelled as normal, abnormal, or non-sperm [19] | Detailed morphological classification based on the modified David classification [7] |
| Image Content | High-resolution images focusing on structural details [20] | RGB images; may include noise, multiple sperm heads, and mixed tails [19] | 1,000 individual spermatozoa images, extended to 6,035 via augmentation [7] |
| Classification System | Morphology of sperm head and other specific components [20] | Binary (Normal/Abnormal) and Non-sperm class [19] | Multi-class (12 defect types across head, midpiece, and tail) [7] |
| Key Application | Advanced morphological studies of specific sperm structures [20] | General sperm detection and classification tasks [19] | Training deep learning models for fine-grained anomaly detection [7] |
Frequently Asked Questions (FAQs)
Q1: Which dataset is most suitable for training a model to perform a detailed, multi-class analysis of sperm defects? The SMD/MSS dataset is explicitly designed for this purpose. It uses the modified David classification, which includes 12 distinct classes of morphological defects across the sperm head, midpiece, and tail, such as tapered heads, microcephalous heads, bent midpieces, and coiled tails [7]. This level of granularity is essential for models that go beyond a simple normal/abnormal binary classification.
Q2: Our research aims to develop a new 3D sperm motility analysis tool. Are any of these datasets appropriate? No. The HuSHeM, SMIDS, and SMD/MSS datasets are primarily focused on static 2D morphology. For 3D motility analysis, you should consider the 3D-SpermVid dataset, a newer repository comprising 121 multifocal video-microscopy hyperstacks that capture sperm movement in a volumetric space over time, enabling the study of 3D flagellar beating patterns [20].
Q3: We are encountering high disagreement in image labels from different human experts. How can we address this? This is a common challenge in sperm morphology analysis. The creators of the SMD/MSS dataset proactively addressed this by implementing an inter-expert agreement analysis. They categorized labels into "No Agreement" (NA), "Partial Agreement" (PA), and "Total Agreement" (TA). When training your model, you can treat the TA subset as a high-confidence ground truth to improve label reliability and model performance. For the PA subset, you might use the majority vote from the agreeing experts [7].
Q4: Our image pre-processing pipeline is struggling with noisy images that contain multiple cells or debris. Which dataset reflects this real-world challenge? The SMIDS dataset explicitly states that its images may include noise, multiple sperm heads, and mixed tails [19]. While this adds complexity, it is highly representative of real-world laboratory conditions. Using this dataset can help you develop and test more robust pre-processing and segmentation algorithms that can handle these challenges effectively.
Troubleshooting Common Experimental Issues
Issue 1: Model Performance is Poor Due to Limited and Imbalanced Data
Problem: You are working with the SMD/MSS dataset and find that your model's accuracy is low for morphological classes that had few original samples.
Solution:
- Implement Data Augmentation: The SMD/MSS team successfully expanded their dataset from 1,000 to 6,035 images using augmentation techniques [7]. Integrate a real-time augmentation pipeline into your training process.
- Recommended Augmentation Techniques: Apply transformations such as:
- Geometric: Rotation, flipping, and scaling.
- Photometric: Adjusting brightness, contrast, and adding slight noise blur to simulate focus variations.
- Strategic Data Splitting: When splitting your data into training and test sets, use stratified partitioning. This ensures that all morphological classes are proportionally represented in both sets, preventing your model from being blind to rare but clinically important defects during evaluation [7].
Issue 2: Inconsistent Results When Transitioning from Clean to Messy Images
Problem: Your model, trained on a clean dataset, fails when applied to new, noisier data from your own lab.
Solution:
- Hybrid Training: Utilize a multi-dataset training approach. Start with a larger, more varied dataset like SMIDS, which includes noise and multiple cells, to teach your model robust feature detection [19].
- Transfer Learning: Then, fine-tune the pre-trained model on the high-quality, meticulously labeled SMD/MSS dataset to refine its ability to perform detailed morphological classification [7]. This two-stage process enhances generalizability.
- Advanced Pre-processing: Incorporate a denoising step in your pre-processing workflow. This can involve techniques to handle insufficient lighting or poorly stained smears, accurately isolating the spermatozoon's signal from the background [7].
Experimental Workflow & Signaling Pathways
The following diagram illustrates a standardized image pre-processing and analysis workflow, integrating best practices for handling these datasets. This workflow is designed to optimize data quality for downstream AI model training.
Data Pre-processing & Model Training Workflow
The Scientist's Toolkit: Essential Research Reagents & Materials
The table below lists key reagents and materials used in the creation of the featured datasets, which are crucial for replicating experimental protocols or designing new studies.
Table 2: Key Research Reagents and Materials for Sperm Image Analysis
| Reagent/Material | Function/Application | Example from Datasets |
|---|---|---|
| RAL Diagnostics Staining Kit | Stains semen smears to enhance visual contrast for morphological analysis under a microscope. | Used in the SMD/MSS dataset preparation [7]. |
| Non-Capacitating Media (NCC) | A physiological medium used as an experimental control to maintain sperm in a non-capacitated state. | Used in the 3D-SpermVid dataset to study baseline motility [20]. |
| Capacitating Media (CC) | Media containing BSA and bicarbonate to induce hyperactivation, a motility pattern essential for fertilization. | Used in the 3D-SpermVid dataset to study changes in 3D flagellar dynamics [20]. |
| Computer-Assisted Semen Analysis (CASA) System | An integrated system (microscope, camera, software) for automated image acquisition and morphometric analysis. | The MMC CASA system was used for image acquisition in the SMD/MSS study [7]. |
| High-Speed Camera (e.g., MEMRECAM Q1v) | Captures high-frame-rate videos required for detailed 2D or 3D motility and flagellar beating analysis. | Critical for acquiring the 3D+t multifocal videos in the 3D-SpermVid dataset [20]. |
A Technical Deep Dive: Implementing Modern Sperm Image Pre-processing Pipelines
This technical support guide is framed within a broader thesis on optimizing sperm image pre-processing techniques for research in male fertility. It addresses the critical challenges researchers face in acquiring high-quality morphological data, bridging traditional stained methods and emerging stain-free technologies. The following FAQs and troubleshooting guides provide targeted, practical solutions for common experimental hurdles.
Frequently Asked Questions (FAQs) and Troubleshooting Guides
FAQ 1: What are the best practices for creating a high-quality stained sperm smear for morphological analysis?
Answer: A well-prepared stained smear is foundational for accurate morphology assessment. Adhere to the following validated protocol [7]:
- Sample Preparation: Use liquefied semen samples with a concentration of at least 5 million/mL. Avoid samples with concentrations exceeding 200 million/mL to prevent image overlap.
- Smear Creation: Prepare smears strictly according to the guidelines outlined in the WHO manual.
- Staining: Use a RAL Diagnostics staining kit or similar Romanowsky stain variants (e.g., Diff-Quik) for clear contrast [7] [21].
- Image Acquisition: Use an optical microscope with a 100x oil immersion objective in bright-field mode. A CASA (Computer-Assisted Semen Analysis) system, such as the MMC system or IVOS II, can be used for sequential image acquisition and storage [7] [21].
Troubleshooting Common Issues:
| Problem | Possible Cause | Solution |
|---|---|---|
| Blurry or low-contrast images | Insufficient staining; Poorly stained semen smear [7]. | Optimize staining time; ensure proper smear thickness and air-drying. |
| High debris in images | Improper sample washing or preparation. | Centrifuge the sample and resuspend in a clean medium before smear preparation. |
| Sperm overlapping in images | Sample concentration too high [7]. | Dilute the sample to an appropriate concentration before creating the smear. |
FAQ 2: How can I assess the morphology of live, unstained sperm for use in assisted reproductive technology?
Answer: Traditional staining renders sperm unusable for further procedures. For unstained live sperm analysis [21]:
- Microscopy Technique: Use Confocal Laser Scanning Microscopy (CLSM) at 40x magnification in confocal mode (Z-stack). This provides high-resolution images without damaging the sperm.
- Sample Preparation: Dispense a 6 µL droplet onto a standard two-chamber slide with a 20 µm depth (e.g., Leja).
- AI Analysis: Train a deep learning model (e.g., ResNet50) on a dataset of images captured via CLSM. This model can classify sperm as normal or abnormal based on criteria like head shape (smooth oval, length-to-width ratio of 1.5–2), absence of vacuoles, and tail uniformity [21].
Troubleshooting Common Issues:
| Problem | Possible Cause | Solution |
|---|---|---|
| Sperm swim out of field of view | Use of high-magnification objective on live samples. | Perform sperm selection under a 20x objective and use a microfluidic chamber or slide with a defined depth (20µm) to restrict movement [21] [22]. |
| Low-resolution images | Use of low magnification for live-cell imaging [22]. | Employ CLSM to achieve high resolution at low magnification. Implement measurement enhancement algorithms to correct boundary errors [22]. |
| Poor AI model accuracy | Limited or low-quality training dataset. | Use data augmentation techniques (flipping, rotation, scaling) to expand and balance your dataset. Manually annotate images with bounding boxes for training [21] [23]. |
FAQ 3: My segmentation model performs poorly with overlapping sperm. How can I resolve this?
Answer: Sperm overlap is a common challenge that standard models like the Segment Anything Model (SAM) struggle with. The CS3 (Cascade SAM) framework provides an effective, unsupervised solution through a cascade process [24]:
- Pre-processing: Adjust brightness, contrast, and saturation, and whiten the background to reduce noise.
- Cascade Segmentation: Apply SAM in stages.
- Stage 1: Segment and remove easily identifiable sperm heads.
- Stage 2-N: Iteratively segment simple, non-overlapping tails and remove them from the image after each round, forcing SAM to focus on increasingly complex, overlapping structures.
- Post-processing: For persistently overlapping tails, enlarge and thicken the lines in the image to make them more distinct for SAM. Finally, match the segmented heads and tails based on distance and angle to assemble complete sperm masks [24].
Troubleshooting Common Issues:
| Problem | Possible Cause | Solution |
|---|---|---|
| SAM fails to segment any tails | The model prioritizes segmentation by color over geometric features [24]. | Remove the sperm heads (which have a different color) from the image. This forces SAM to switch to a geometry-based segmentation for the remaining parts. |
| Incomplete segmentation of overlapping tails | SAM's inherent limitation with slender, intersecting structures [24]. | In the final cascade stage, apply an image transformation that enlarges and bold the overlapping tail regions before re-running SAM. |
Experimental Protocols for Key Methodologies
Protocol 1: Stained Sperm Morphology Analysis Using Deep Learning
This protocol details the creation of a deep-learning model for classifying sperm morphology from stained images, as used in the SMD/MSS dataset study [7].
- Data Acquisition: Capture at least 1,000 images of individual spermatozoa using a CASA system with a 100x oil immersion objective.
- Expert Annotation: Have three independent experts classify each spermatozoon based on a standard classification system (e.g., modified David classification). Resolve disagreements to establish a robust ground truth.
- Data Augmentation: Augment the dataset to at least 6,000 images using techniques like rotation, flipping, and scaling to balance morphological classes and improve model generalizability [7].
- Image Pre-processing:
- Clean the data by handling missing values or inconsistencies.
- Normalize pixel values to a common scale.
- Resize images to a fixed size (e.g., 80x80 pixels) and convert to grayscale [7].
- Model Training & Testing:
- Partition the dataset: 80% for training, 20% for testing.
- Develop a Convolutional Neural Network (CNN) in an environment like Python 3.8.
- Train the model on the training set and evaluate its accuracy on the unseen test set.
Protocol 2: Stain-Free Live Sperm Morphology Analysis Using AI
This protocol enables the functional assessment of live, unstained sperm for use in ART [21].
- Sample Preparation: Aliquot liquefied semen into a microfluidic chamber or a standard two-chamber slide with a 20µm depth.
- Image Acquisition: Use a Confocal Laser Scanning Microscope (e.g., LSM 800) at 40x magnification. Capture Z-stack images with an interval of 0.5 µm over a 2 µm range.
- Dataset Curation: Manually annotate well-focused sperm images using a program like LabelImg. Categorize sperm into "normal" and "abnormal" based on WHO criteria for unstained sperm.
- AI Model Development:
- Select a Transfer Learning Model: Use a pre-trained architecture like ResNet50.
- Training: Train the model on your annotated dataset (e.g., 9,000 images: 4,500 normal and 4,500 abnormal) to minimize the difference between predicted and actual labels.
- Validation: Evaluate the model on a separate test set. A well-trained model should achieve high precision and recall (e.g., >0.90) for both normal and abnormal classes [21].
Workflow Visualization
Stained vs. Unstained Sperm Analysis Workflow
Cascade SAM (CS3) Segmentation Workflow
The Scientist's Toolkit: Research Reagent Solutions
| Item | Function | Application Context |
|---|---|---|
| RAL Diagnostics Stain | Provides contrast for clear visualization of sperm structures (head, midpiece, tail). | Stained smear morphology analysis [7]. |
| Diff-Quik Stain | A variant of Romanowsky stain for rapid staining of sperm cells on slides. | Stained smear morphology analysis with CASA systems [21]. |
| Leja Standard Slides | Two-chamber slides with a defined depth (20µm) for preparing standardized samples. | Unstained live sperm analysis; restricts sperm movement for imaging [21]. |
| MMC CASA System | Computer-Assisted Semen Analysis system for automated image acquisition and morphometry. | Stained sperm image capture and basic analysis [7]. |
| IVOS II CASA System | Advanced CASA system for analyzing concentration, motility, and stained morphology. | Standardized semen analysis in clinical settings [21]. |
| Confocal Laser Scanning Microscope | Enables high-resolution, non-destructive imaging of live cells at low magnification. | Unstained live sperm morphology analysis [21]. |
| ResNet50 Model | A deep neural network for image classification; can be fine-tuned for sperm assessment. | AI-based classification of normal/abnormal sperm morphology [21]. |
| Segment Anything Model (SAM) | Foundational model for image segmentation that can be adapted for complex tasks. | Segmenting overlapping sperm structures via the CS3 framework [24]. |
Frequently Asked Questions
1. Why is pre-processing crucial for automated sperm morphology analysis? Raw sperm images captured via microscopy often contain noise, varying brightness, and impurities. Without pre-processing, these inconsistencies can severely degrade the performance of deep learning models and automated analysis systems. Proper pre-processing enhances image quality, standardizes inputs, and is a critical step for achieving accurate, reproducible results in clinical diagnostics and research [25] [9].
2. My deep learning model for sperm classification is sensitive to noisy images. What are robust solutions? Your model may be overly reliant on local image features. Recent research indicates that Visual Transformer (VT) models, which leverage global image information, demonstrate superior anti-noise robustness compared to Convolutional Neural Networks (CNNs). Under common noise types like Poisson noise, VT models can maintain accuracy drops of less than 0.5%, significantly outperforming CNN-based approaches [25].
3. How can I accurately segment overlapping sperm, a common issue in clinical images? Segmenting overlapping sperm, particularly their tails, is a recognized challenge. Traditional Segment Anything Model (SAM) applications often fail in these scenarios. A proven method is the CS3 (Cascade SAM for Sperm Segmentation) framework, which uses a cascade application of SAM. It strategically removes easily segmentable parts like sperm heads and then processes the remaining complex, overlapping tails, significantly improving segmentation accuracy [26].
4. What are the standard steps for preparing a sperm image dataset for deep learning? A robust pre-processing pipeline for deep learning typically includes several stages [26]:
- Brightness, Contrast, and Saturation Adjustment: To standardize images from different sources.
- Background Whitening: To reduce noise and isolate sperm structures.
- Resizing: To normalize image dimensions for network input.
- Data Augmentation: Applying synthetic noise or transformations to improve model generalizability and robustness [25].
Troubleshooting Guides
Problem: High Variability in Model Performance Due to Image Noise
Issue: Your deep learning model for sperm classification or segmentation performs inconsistently when applied to images from different microscopes or staining batches, often due to unseen noise.
Solution: Integrate anti-noise robustness testing into your training pipeline and consider model architecture choices.
Experimental Protocol: Comparative Noise Robustness Analysis This methodology is designed to evaluate and select models based on their resilience to noise [25].
- Dataset Selection: Use a large-scale, publicly available dataset like SVIA (subset-C), which contains over 125,000 sperm and impurity images [25].
- Model Selection: Choose a range of deep learning models for comparison, including both CNN-based (e.g., ResNet50, VGG16) and Visual Transformer (VT) architectures.
- Noise Introduction: Systematically introduce various types of conventional and adversarial noise to the test dataset. Common examples include:
- Gaussian Noise
- Poisson Noise
- Salt-and-Pepper Noise
- Evaluation: Measure standard performance metrics (Accuracy, Precision, Recall, F1-Score) on the noisy test sets and compare them to the baseline performance on the clean images.
Table 1: Example Performance of a Visual Transformer Model Under Poisson Noise
| Metric | Clean Images | With Poisson Noise | Change (Percentage Points) |
|---|---|---|---|
| Overall Accuracy | 91.45% | 91.08% | -0.37 |
| Impurity Precision | 92.7% | 91.3% | -1.40 |
| Impurity Recall | 88.8% | 89.5% | +0.70 |
| Impurity F1-Score | 90.7% | 90.4% | -0.30 |
| Sperm Precision | 90.9% | 90.5% | -0.40 |
| Sperm Recall | 92.5% | 93.8% | +1.30 |
| Sperm F1-Score | 92.1% | 90.4% | -1.70 |
Source: Adapted from [25]
Interpretation: The data in Table 1 shows that a robust model like a VT maintains stable overall accuracy even with added noise. The small fluctuations in precision and recall across categories indicate resilience, which is critical for reliable clinical application [25].
Problem: Failure to Segment Overlapping Sperm Tails
Issue: Instance segmentation models, including the standard Segment Anything Model (SAM), often fail to separate individual sperm when their tails are intertwined, leading to inaccurate morphology analysis.
Solution: Implement the CS3 framework, an unsupervised cascade method designed to address sperm overlap [26].
Experimental Protocol: CS3 for Overlapping Sperm Segmentation The following workflow details the CS3 process.
Explanation of the Workflow:
- Initial Pre-processing: Adjust brightness, contrast, and whiten the background to improve feature visibility [26].
- Cascade Stage 1 (Head Segmentation): Apply SAM to the pre-processed image. Sperm heads, due to their distinct color and shape, are easily segmented. These masks are isolated using color filters, saved, and then removed from the original image, leaving an image containing only tails [26].
- Cascade Stage 2..n (Tail Segmentation): Apply SAM iteratively to the tail-only image. After each round, the resulting masks are filtered to identify "single tails" (using criteria like skeleton endpoints). These identified single tails are saved and removed from the image. This cascade process continues until no new single tails are found in consecutive rounds [26].
- Processing Complex Tails: For the remaining intertwined tails, the image region is enlarged, and the tail lines are thickened. This enhancement makes the overlapping structures more distinct and separable for SAM [26].
- Final Segmentation and Reconstruction: SAM is run on the enhanced image. The final step involves matching the segmented head masks with the corresponding tail masks based on proximity and angle to reconstruct complete, individual sperm instances [26].
The Scientist's Toolkit
Table 2: Essential Research Reagents and Resources for Sperm Image Pre-processing
| Resource / Tool | Function / Description | Relevance in Pre-processing & Analysis |
|---|---|---|
| SVIA Dataset [25] | A public large-scale sperm image dataset. | Provides over 125,000 annotated images for training and testing deep learning models, essential for benchmarking pre-processing techniques. |
| OpenCASA [27] | An open-source software for Computer-Assisted Sperm Analysis. | Used for validating pre-processing results by analyzing classical sperm parameters like motility, morphometry, and concentration. |
| Segment Anything Model (SAM) [26] | A foundational model for image segmentation. | Serves as the core engine in advanced segmentation pipelines like CS3 for segmenting sperm structures without manual prompts. |
| SpermQ [28] | An ImageJ plugin for flagellar beat analysis. | A specialized tool for analyzing sperm tail motility, which can benefit from high-quality pre-processed images. |
Experimental Framework for Pre-processing Optimization
To systematically evaluate the impact of different pre-processing operations on downstream analysis, researchers can adopt the following comparative framework.
Implementation:
- Define Pipelines: Establish two or more pre-processing pipelines. For example, Pipeline A could be a basic standardization (resizing, simple normalization), while Pipeline B incorporates advanced denoising techniques and robust normalization [25] [9].
- Apply Downstream Task: Process the outputs of each pipeline with the same segmentation (e.g., CS3) or classification model (e.g., VT or CBAM-enhanced ResNet50) [25] [26] [29].
- Quantitative Evaluation: Compare the performance of the downstream tasks using relevant metrics. Superior performance from one pipeline indicates its effectiveness for the specific image analysis challenge.
Frequently Asked Questions
How can data augmentation improve the accuracy of my sperm morphology classification model? Data augmentation artificially increases the size and diversity of your training dataset by creating modified versions of existing images. This technique helps prevent overfitting, a common problem where a model performs well on its training data but fails to generalize to new, unseen images. By exposing your model to a wider variety of sperm orientations, sizes, and appearances, you enable it to learn more robust and generalizable features, ultimately leading to higher accuracy on your test set [30]. One study on deep-learning for sperm morphology reported that using data augmentation to expand a dataset from 1,000 to 6,035 images was crucial for achieving a promising classification accuracy [7].
My dataset has a class imbalance for certain sperm defects. Can augmentation help? Yes, data augmentation is a powerful strategy for addressing class imbalance. For under-represented morphological classes (e.g., specific head defects like microcephaly or tail defects like coiled tails), you can selectively apply augmentation techniques like rotation, flipping, and scaling to generate more samples. This creates a more balanced dataset, which helps the model learn to recognize these rare defects without being biased toward the more common classes [5] [30].
Which augmentation techniques are most suitable for sperm image analysis? The most appropriate techniques are those that mimic the natural variations found in microscopic semen analysis. Rotation is highly relevant as sperm can be oriented in any direction on a smear. Flipping (horizontally) is effective because sperm morphology is not laterally biased. Scaling (zooming) can simulate minor differences in the distance between the sperm and the microscope camera [31]. Techniques that alter color properties, like brightness adjustment, can also help the model become robust to variations in staining intensity [32] [31].
What are the common pitfalls when implementing rotation and scaling? A common error is applying excessive transformations that destroy biologically relevant information. For example, rotating a sperm image by 90 degrees might incorrectly alter the perceived orientation of the head and tail, and aggressive scaling can make critical structural details, like the acrosome or midpiece, unrecognizable [31]. It is crucial to define reasonable parameter ranges (e.g., rotation within a ±30 degree range) and to visually inspect the augmented images to ensure they remain biologically plausible.
Troubleshooting Guides
Problem: Model Performance is Poor on New Clinical Images
Possible Causes and Solutions:
- Cause 1: Overfitting to the Original Training Data.
- Cause 2: Augmentation Parameters are Too Extreme.
- Solution: Review the parameters for your scaling and rotation operations. If the zoom factor is too high, the sperm may be cropped out. If the rotation range is too large, it may generate anatomically impossible orientations. Tune these parameters to reflect real-world variability [31].
- Cause 3: Inconsistent Staining in Original Images.
Problem: "Invalid Argument" Error During Model Training
Possible Causes and Solutions:
- Cause 1: Data Type or Range Mismatch.
- Solution: After augmentation, ensure that your image pixel values are in the expected data type (e.g.,
float32) and normalized to the correct range (typically [0,1] or [-1,1]). Most deep learning models require consistent input normalization for stable training [7].
- Solution: After augmentation, ensure that your image pixel values are in the expected data type (e.g.,
- Cause 2: Incorrect Image Dimensions.
- Solution: Verify that all images, including those generated by scaling and cropping, are resized to the same dimensions required by your model's input layer. A common practice is to resize all images to a fixed size (e.g., 80x80 pixels) after augmentation [7].
The following table summarizes a referenced experimental protocol that successfully employed data augmentation for a sperm morphology deep learning model.
Table 1: Summary of Experimental Setup from SMD/MSS Dataset Study [7]
| Aspect | Description |
|---|---|
| Original Dataset Size | 1,000 images of individual spermatozoa |
| Final Augmented Dataset Size | 6,035 images |
| Augmentation Goal | Balance the representation across different morphological classes. |
| Classification Standard | Modified David classification (12 classes of defects) [7]. |
| Deep Learning Model | Convolutional Neural Network (CNN) |
| Reported Outcome | Model accuracy ranged from 55% to 92% after augmentation. |
Detailed Methodology for Image Augmentation
The workflow for implementing a standard augmentation pipeline for sperm images is as follows. This protocol can be implemented using deep learning libraries like TensorFlow/Keras or PyTorch.
Table 2: Common Parameter Ranges for Sperm Image Augmentation
| Technique | Example Implementation | Key Parameters | Biological Justification |
|---|---|---|---|
| Rotation | RandomRotation(factor=0.1) [31] |
factor: 0.1 (≡ ±36°) |
Sperm orientation on a smear is random. |
| Flipping | RandomFlip("horizontal") [31] |
mode: "horizontal" |
Sperm morphology has no inherent left-right bias. |
| Scaling/Zoom | RandomZoom(height_factor=0.2, width_factor=0.2) [31] |
height_factor/width_factor: 0.2 (80%-120% zoom) |
Minor variations in distance from the microscope objective. |
| Brightness | RandomBrightness(factor=0.2) [31] |
factor: 0.2 (±20% change) |
Compensates for variations in staining intensity and light source. |
Data Augmentation Workflow for Sperm Images
The Scientist's Toolkit
Table 3: Essential Research Reagents and Computational Tools
| Item / Solution | Function in Experiment |
|---|---|
| RAL Diagnostics Staining Kit | Used to prepare semen smears, providing contrast for morphological analysis of sperm heads, midpieces, and tails [7]. |
| MMC CASA System | A Computer-Assisted Semen Analysis system used for the automated acquisition and storage of high-quality individual sperm images from smears [7]. |
| Python 3.8+ with Deep Learning Libraries | The primary programming environment for implementing data augmentation pipelines and convolutional neural networks (CNNs) [7]. |
TensorFlow/Keras RandomFlip, RandomRotation, RandomZoom |
Pre-built layers for easily integrating geometric image transformations into a deep learning model [31]. |
TensorFlow/Keras RandomBrightness |
A pre-built layer for adjusting image brightness to make models robust to staining and lighting variations [31]. |
Frequently Asked Questions (FAQs)
Q1: Why should we use synthetic data from game engines instead of real medical images for sperm analysis research? Synthetic data addresses the critical lack of large, diverse, and well-annotated datasets in medical imaging [33] [34]. It is especially useful in data-scarce environments, as it allows for the creation of highly customizable datasets without relying on real images, which can be limited, expensive to acquire, and raise privacy concerns [34] [35]. Game engines like Unity and Unreal Engine enable the generation of thousands of images with precise control over parameters, creating a wide variety of permutations and backgrounds that a model might encounter in the real world [36].
Q2: Our synthetic images look visually unrealistic. How can we improve their photorealism for model training? A common solution is to combine game engine rendering with advanced machine learning models. You can feed the game engine outputs into a model like a Composable Adapter (CoAdapter), which uses input modalities such as canny edge maps and depth maps to enhance realism while preserving the underlying structure [37]. Additionally, leverage domain adaptation techniques during preprocessing. These can normalize color and brightness or use style transfer to bridge the gap between synthetic and real visual domains, improving model generalization [38].
Q3: What are the key parameters we should randomize when generating synthetic sperm imagery? To ensure dataset diversity and model robustness, you should randomize several key parameters. Using a game engine's procedural generation capabilities, you can randomize aspects like camera angles (including off-nadir angle), lighting conditions (time of day), environmental effects (cloud cover), and the level of activity onsite (e.g., density of cells) [37]. Furthermore, you can programmatically alter scene parameters like textures, colors, and object locations through domain randomization to expose your model to a wide array of visual scenarios [35].
Q4: We are getting poor model accuracy when transitioning from synthetic to real clinical images. What steps can we take? This issue, known as domain shift, can be mitigated through several strategies. First, ensure your synthetic data is as diverse as possible by using the domain randomization techniques mentioned above [35]. Second, employ targeted image preprocessing on your real-world images, such as histogram equalization for contrast enhancement and noise reduction filters, to make the input characteristics more consistent [38] [39] [40]. Finally, if possible, incorporate a small set of real, annotated clinical images into your training process to fine-tune the model, which can significantly improve its performance on the target domain [33].
Troubleshooting Guides
Issue 1: Handling Limited or Low-Quality Real Datasets
Problem: A researcher cannot assemble a large, high-quality dataset of real sperm images for training, due to factors like data loss, low resolution, or high annotation difficulty [33].
Solution: Implement a synthetic data generation pipeline to augment or create your dataset.
Step-by-Step Protocol:
- Select a Tool: Choose a synthetic data generation platform.
- For specialized sperm analysis: Use AndroGen, an open-source tool designed specifically for generating customizable synthetic microscopic images of sperm cells [34].
- For general-purpose high-quality synthesis: Use game engines like Unity or Unreal Engine, which offer powerful real-time 3D creation tools [36].
- For integrated physical AI workflows: Use NVIDIA Omniverse and Isaac Sim, which are built for generating physically accurate synthetic data [35].
- Model the Scene: Create 3D models of sperm cells, including structures like the head, neck, and tail. Use a game engine's procedural generation algorithms to create different layouts and configurations automatically [37].
- Apply Domain Randomization: Systematically randomize parameters within the synthetic environment to ensure diversity. The table below summarizes key areas for randomization [35] [37]:
| Randomization Area | Specific Parameters | Purpose |
|---|---|---|
| Camera Properties | Off-nadir angle, distance to sample, focal length | Simulate different microscopes and viewing angles. |
| Lighting Conditions | Intensity, color, direction (e.g., time-of-day simulation) | Build invariance to illumination changes in the clinic. |
| Environmental Effects | Cloud cover (simulated optical noise), background texture | Add visual noise and complexity. |
| Object Appearance | Cell texture, color, size, and shape (within biologically plausible limits) | Increase morphological diversity. |
| Level of Activity | Density of cells in a sample, presence of debris | Mimic different sample qualities. |
- Generate and Annotate: Render the images. A key advantage of synthetic data is that annotations (e.g., bounding boxes, segmentation masks) are generated automatically and perfectly during the rendering process [36] [35].
Issue 2: Preprocessing Synthetic Images for Optimal Model Performance
Problem: A model trained solely on synthetic images fails to generalize to real-world clinical images due to domain gap and poor preprocessing.
Solution: Apply a robust preprocessing pipeline to both synthetic and real images to standardize inputs and highlight relevant features.
Step-by-Step Protocol:
- Resize and Crop: Resize all images to a standard dimension required by your model (e.g., 224x224). Use interpolation methods like
cv2.INTER_CUBICin OpenCV for high-quality resizing. Center-crop images to maintain a consistent field of view [39] [40]. - Normalize Pixel Values: Rescale pixel intensity values to a range of 0 to 1 by dividing by the maximum value (255) to stabilize and speed up training [39] [40].
- Enhance Contrast: Apply Histogram Equalization (e.g., using
cv2.equalizeHist) to improve contrast and make features like sperm heads and tails more distinguishable [39] [40]. - Reduce Noise: Apply filters to minimize noise. The table below compares common choices [23] [39] [40]:
| Filter | Primary Use | Key Advantage |
|---|---|---|
| Gaussian Blur | General noise reduction and smoothing. | Creates a smooth effect by averaging pixels with a Gaussian function. |
| Median Blur | Removing "salt-and-pepper" noise. | Preserves edges while effectively removing noise. |
| Bilateral Filter | Strong noise reduction while preserving edges. | Considers both spatial and color intensity similarity. |
- Augment the Data (Real and Synthetic): Further increase dataset diversity by applying random transformations such as horizontal/vertical flipping, slight rotations (±10°), and adding minor random noise [23] [40]. Tools like
albumentationsorTensorFlow's image module can automate this.
Workflow for Synthetic Data in Sperm Image Analysis
The following diagram illustrates the integrated workflow for generating and utilizing synthetic imagery in research.
Research Reagent Solutions: Essential Tools for Synthetic Sperm Image Experiments
The table below details key software and hardware tools for building a synthetic data pipeline for sperm image analysis.
| Item Name | Function / Purpose | Key Features |
|---|---|---|
| Unity / Unreal Engine [36] | Real-time 3D game engines for creating and rendering synthetic microscopic scenes. | High visual quality, procedural generation, extensive asset libraries, and powerful lighting simulation. |
| NVIDIA Omniverse [35] | A platform for 3D simulation and synthetic data generation based on Universal Scene Description (OpenUSD). | Physically accurate rendering, seamless tool interoperability, and built-in annotators for various AI tasks. |
| AndroGen [34] | Open-source software specifically designed for generating synthetic microscopic images of sperm cells. | Highly customizable for the domain, user-friendly GUI, and does not require generative model training. |
| OpenCV / Pillow [39] [40] | Core Python libraries for implementing image preprocessing pipelines. | Comprehensive functions for resizing, filtering, color space conversion, and histogram equalization. |
| YOLOv8 [41] | A state-of-the-art object detection algorithm used for tasks like locating and classifying sperm in images. | High precision and efficiency, suitable for real-time applications, and can be fine-tuned with synthetic data. |
| NVIDIA RTX PRO Server [35] | High-performance computing platform for accelerating simulation and AI training workloads. | Fastens the rendering of complex scenes and reduces the time required for model training. |
FAQs and Troubleshooting Guides
1. Why is accurate multi-part sperm segmentation important, and what are its main challenges? Accurate segmentation of the head, midpiece, and tail is fundamental for evaluating sperm morphology, which is a key indicator of male fertility potential [42]. The main challenges, especially when working with unstained live human sperm, include poor image quality, low signal-to-noise ratio, indistinct structural boundaries (particularly the neck), and overlapping sperm heads [42]. These factors complicate the process of distinguishing the small, intricate parts of the sperm, such as separating the acrosome from the nucleus or cleanly isolating the tail [42].
2. Which deep learning model is best for segmenting different sperm components? No single model excels at segmenting every part perfectly. Performance varies by component, and the choice of model should be guided by your primary segmentation target [42]. The table below summarizes a quantitative comparison of different models.
Table: Performance Comparison of Deep Learning Models for Sperm Part Segmentation (Quantified by IoU)
| Sperm Component | Mask R-CNN | YOLOv8 | YOLO11 | U-Net |
|---|---|---|---|---|
| Head | Best Performance [42] | Good Performance [42] | Not Specified | Good Performance [42] |
| Nucleus | Best Performance [42] | Good Performance [42] | Not Specified | Good Performance [42] |
| Acrosome | Best Performance [42] | Not Specified | Good Performance [42] | Good Performance [42] |
| Neck | Good Performance [42] | Best Performance [42] | Not Specified | Good Performance [42] |
| Tail | Good Performance [42] | Good Performance [42] | Not Specified | Best Performance [42] |
3. How can I improve my model's performance when I have a limited dataset? Data augmentation is a crucial technique to improve model generalizability and robustness, especially with limited data. Effective strategies include [43]:
- Rotation and Flipping: To make the model invariant to the random orientation of sperm cells.
- Brightness and Contrast Adjustment: To simulate variations in lighting and image quality from different microscopes or sample preparations.
- Adding Gaussian Noise: To train the model to distinguish between image noise and actual sperm features, enhancing real-world performance.
4. My segmentation results are inconsistent. What could be the issue? Inconsistencies can stem from the microscope setup itself. The optical resolution of your system is critical for visualizing fine details [44]. Key factors to check are:
- Numerical Aperture (NA): Use objectives with a high NA (e.g., >1.0 with immersion oil) for the best resolution [44].
- Condenser NA: Ensure your condenser's NA is appropriately matched to your objective's NA [44].
- Corrected Objectives: Verify that your objectives are corrected for the thickness of the dish or coverslip you are using [44]. A poorly optimized system will fail to resolve the details needed for accurate segmentation.
Experimental Protocols
Protocol 1: Multi-Part Segmentation of Unstained Sperm Using Deep Learning
This protocol is adapted from recent research on segmenting live, unstained human sperm [42].
Dataset Preparation:
- Source: Use a clinically labeled dataset of live, unstained human sperm images.
- Selection: To ensure consistency, select images labeled as "Normal Fully Agree Sperms" by multiple morphology experts.
- Annotation: Each sperm component (acrosome, nucleus, head, midpiece, and tail) must be accurately annotated with pixel-wise masks.
- Division: Split the annotated images into training and validation sets.
Model Selection and Training:
- Model Choice: Based on your target component (see FAQ #2), select an appropriate model (e.g., Mask R-CNN for heads, U-Net for tails).
- Training: Train the selected model on the training set. Employ data augmentation techniques as described in FAQ #3.
- Evaluation: Quantitatively evaluate model performance on the validation set using metrics like Intersection over Union (IoU), Dice coefficient, Precision, and Recall.
Protocol 2: Traditional Image Analysis Workflow for Sperm Segmentation
This protocol details a pre-deep learning method for segmenting sperm parts using an image-flow cytometer and analysis software, highlighting the logical steps involved [45].
Create an Entire Cell Mask:
- Use the morphology function on the bright-field image to detect all pixels containing the sperm cell.
- Perform a one-pixel erosion to refine the mask [45].
Create a Head Mask:
- Apply the "adaptive erode" function with a circular coefficient to identify the sperm head's round region.
- Dilate the resulting mask by two pixels to ensure complete head coverage [45].
Create a Principal Piece (Tail) Mask:
- Dilate the head mask by approximately 13 pixels to cover the midpiece area.
- Subtract this dilated mask from the entire cell mask. The result is the mask for the principal piece of the tail [45].
Create a Midpiece Mask:
- Subtract the principal piece mask from the entire cell mask, resulting in a mask containing both the head and midpiece.
- Subtract the (dilated) head mask from this new mask to isolate the midpiece region.
- Erode one pixel and then dilate two pixels to finalize the midpiece mask [45].
The following workflow diagram illustrates this multi-step segmentation process:
Sperm Segmentation via Traditional Image Analysis
The Scientist's Toolkit: Research Reagent Solutions
Table: Essential Materials and Reagents for Sperm Segmentation Experiments
| Item Name | Function / Application | Specific Example / Note |
|---|---|---|
| Beltsville Thawing Solution (BTS) | Semen extender and diluent; used to reduce dilution shock and for sample storage. | Used for diluting and low-temperature storage (e.g., 17°C) of porcine semen in motility studies [46]. |
| CELL-TAK | Cell adhesive; used to fix sperm heads to culture dishes for detailed motility analysis. | Allows for immobilization of sperm for confocal microscopy, enabling analysis of flagellar beats [46]. |
| Optixcell Extender | Semen extender; used to maintain sperm viability and avoid temperature shock post-collection. | Used in a 1:1 ratio (v/v) with bull semen for deep learning-based morphology analysis [47]. |
| Trumorph System | A fixation system for sperm morphology evaluation that uses pressure and temperature, avoiding dyes. | Enables dye-free, standardized fixation of bovine sperm on slides for microscopic imaging [47]. |
Model Selection Logic for Segmentation Tasks
The following decision diagram outlines the logic for selecting the most appropriate deep learning model based on your primary research goal and the specific sperm component of interest.
Model Selection for Sperm Segmentation
Solving Real-World Problems: Troubleshooting and Optimizing Pre-processing Workflows
Addressing Class Imbalance in Morphological Datasets
Frequently Asked Questions (FAQs)
1. What is class imbalance and why is it a critical problem in morphological analysis? Class imbalance occurs when one class (the majority class) significantly outnumbers another class (the minority class) in a dataset [48]. In morphological datasets, such as those for sperm analysis, this is common where normal sperm cells vastly outnumber those with specific morphological defects [7]. This imbalance is dangerous because it leads to biased predictions, fake high accuracy, and poor recall for the minority class that is often of greatest clinical interest [49]. Models may achieve high accuracy by simply always predicting the majority class, while failing to identify the rare but crucial abnormal cases.
2. How can I quickly check if my dataset has a class imbalance problem? You can check class distribution using simple Python code [49]:
If one class represents less than 20% of your data, the imbalance is considered significant and should be addressed [49]. For morphological datasets with multiple defect categories, the imbalance ratio can be extreme, with some rare morphological classes representing only a tiny fraction of the total samples [7] [48].
3. What evaluation metrics should I use instead of accuracy for imbalanced datasets? Accuracy is misleading for imbalanced datasets. Instead, use these metrics [49] [50]:
- Precision and Recall: Particularly recall for the minority class
- F1-Score: Harmonic mean of precision and recall
- ROC-AUC: Area under the Receiver Operating Characteristic curve
- PR-AUC: Precision-Recall AUC (better for severe imbalance)
- Confusion Matrix: Visualize performance across all classes
For multi-class morphological problems, use macro-averaged F1-score or G-mean to ensure all classes are weighted equally regardless of their frequency [48] [51].
4. When should I use data modification techniques like SMOTE versus algorithm-level approaches? Use algorithm-level approaches like class weights first, especially with tree-based models [49] [52]. Reserve data modification techniques like SMOTE for weak learners (logistic regression, SVM) or when using models that don't output probabilities [52]. For deep learning approaches on image data, focal loss or other modified loss functions often work better than data resampling [49] [53].
5. How do I properly split imbalanced data to ensure minority class representation? Always use stratified splitting to maintain the same class distribution in training and test sets [49]:
Skipping stratification may result in test sets with zero minority samples, making proper evaluation impossible [49].
Troubleshooting Guides
Problem: Model Shows High Accuracy But Poor Performance on Minority Classes
Symptoms:
- Validation accuracy >90% but cannot detect rare morphological defects
- Confusion matrix shows empty row for minority class
- Precision or recall for abnormal classes is near zero
Solutions:
1. Implement Class Weighting For tree-based models (XGBoost, LightGBM, Random Forest), use built-in class weighting [49]:
2. Apply Threshold Tuning Instead of default 0.5 threshold, find optimal threshold that maximizes F1 or recall [49] [52]:
3. Utilize Cost-Sensitive Learning Assign higher misclassification costs to minority classes [50]:
Problem: Insufficient Minority Class Samples for Training
Symptoms:
- Minority class has fewer than 100 samples
- Data augmentation techniques are not producing diverse enough samples
- Model is overfitting to the limited minority examples
Solutions:
1. Strategic Data Augmentation for Morphological Data Apply domain-specific augmentations that preserve biological validity [7] [53]:
- Affine transformations (rotation, scaling, translation)
- Elastic deformations that maintain cell structure
- Color and contrast variations
- Noise injection that mimics microscope artifacts
2. Advanced Oversampling Techniques
For image data, consider generative approaches [53]:
- Use GANs to generate synthetic minority class samples
- Apply feature-aware SMOTE variants
- Use mosaic augmentation to combine multiple samples [53]
3. Hybrid Sampling Approaches Combine oversampling and undersampling [51]:
Problem: Deep Learning Model Biased Toward Majority Classes
Symptoms:
- Training loss decreases but minority class performance stagnates
- Model predictions are overconfident for majority class
- Gradient updates dominated by majority examples
Solutions:
1. Implement Focal Loss Use focal loss to focus learning on hard examples [49] [53]:
2. Modify Network Architecture
- Add attention mechanisms to focus on discriminative regions [53]
- Use multi-scale feature extraction to capture subtle morphological differences [53]
- Implement long-range dependency modeling to understand context [53]
3. Balanced Batch Sampling Ensure each training batch contains representative examples from all classes:
Experimental Protocols & Methodologies
Protocol 1: Comprehensive Data Balancing Comparison
Objective: Systematically compare different imbalance correction methods for morphological classification [54].
Workflow:
- Data Preparation
- Split data using stratified 80/20 train/test split
- Apply morphological-specific preprocessing (normalization, denoising)
- Extract relevant morphological features (shape, texture, size descriptors)
Method Implementation
- Train baseline model without imbalance correction
- Test four approaches: class weighting, random oversampling, SMOTE, threshold tuning
- Use consistent evaluation metrics across all methods
Evaluation Framework
- Calculate both threshold-dependent (F1, recall) and threshold-independent (AUC) metrics
- Use statistical tests to determine significant differences
- Assess computational efficiency and training time
Protocol 2: Deep Learning with Integrated Imbalance Handling
Objective: Develop end-to-end deep learning pipeline for severe class imbalance in medical imaging [7] [53].
Architecture Components:
- Encoder: HRNet for fine-grained local feature extraction [53]
- Decoder: Modified visual state space blocks for long-range dependencies [53]
- Attention: Adaptive awareness fusion modules in skip connections [53]
- Loss: Combined cross-entropy, Dice, and auxiliary losses [53]
Implementation Details:
Training Strategy:
- Progressive resizing starting with lower resolution
- Transfer learning from pre-trained weights
- Cyclical learning rates with warm restarts
- Early stopping based on validation F1-score
Data Presentation Tables
Table 1: Performance Metrics Comparison for Imbalanced Dataset Methods
| Method | Accuracy | Precision | Recall | F1-Score | AUC-ROC | Training Time |
|---|---|---|---|---|---|---|
| Baseline (No Correction) | 95.2% | 34.5% | 12.3% | 18.1% | 0.621 | 1.0x |
| Class Weighting | 91.8% | 68.9% | 75.4% | 72.0% | 0.884 | 1.1x |
| Random Oversampling | 90.5% | 65.3% | 78.9% | 71.5% | 0.872 | 1.3x |
| SMOTE | 91.2% | 67.1% | 76.5% | 71.5% | 0.879 | 1.8x |
| Focal Loss (DL) | 93.1% | 72.5% | 81.2% | 76.6% | 0.912 | 2.2x |
| Ensemble + Hybrid | 92.4% | 75.8% | 79.6% | 77.6% | 0.925 | 2.5x |
Note: Results simulated based on typical performance patterns reported in literature [49] [54] [52].
Table 2: Resampling Techniques Comparison for Morphological Data
| Technique | Pros | Cons | Best For | Morphological Suitability |
|---|---|---|---|---|
| Random Oversampling | Simple, fast, preserves information | High overfitting risk, no new information | Small datasets, proof of concept | Low - may duplicate artifacts |
| SMOTE | Generates synthetic samples, reduces overfitting | May create unrealistic samples, ignores density | Tabular feature data, linear models | Medium - use feature-space carefully |
| ADASYN | Focuses on hard examples, adaptive | May amplify noise, complex implementation | Datasets with hard minority examples | Medium - can highlight edge cases |
| Data Augmentation | Domain-specific, realistic variations | Requires domain expertise, computationally heavy | Image data, deep learning | High - preserves biological validity |
| GAN-based Generation | High-quality synthetic data, very realistic | Training instability, mode collapse | Large datasets, complex morphology | High - can capture subtle variations |
Summary of characteristics compiled from multiple sources [52] [50] [51].
The Scientist's Toolkit: Research Reagent Solutions
Table 3: Essential Computational Tools for Class Imbalance Research
| Tool/Resource | Function | Application Context | Implementation Example |
|---|---|---|---|
| Imbalanced-Learn | Comprehensive resampling library | General machine learning, tabular data | from imblearn.over_sampling import SMOTE |
| Class Weights | Algorithm-level balancing | Tree models, neural networks | class_weight='balanced' in scikit-learn |
| Focal Loss | Hard example focusing | Deep learning, severe imbalance | Custom loss function in TensorFlow/PyTorch |
| Stratified K-Fold | Balanced cross-validation | Model evaluation, hyperparameter tuning | StratifiedKFold(n_splits=5) |
| PR-Curve Analysis | Imbalance-aware evaluation | Method comparison, threshold selection | precision_recall_curve() from sklearn |
| Cost-Sensitive Learning | Explicit misclassification costs | Clinical applications, risk minimization | Custom cost matrix in model training |
Table 4: Specialized Architectures for Morphological Data Imbalance
| Architecture Component | Function | Benefit for Imbalance | Reference Implementation |
|---|---|---|---|
| Attention Mechanisms | Focus on discriminative regions | Reduces background bias, emphasizes rare features | SE blocks, CBAM in CNNs [53] |
| Multi-Scale Feature Extraction | Capture features at different scales | Helps identify subtle morphological variations | HRNet, Feature Pyramid Networks [53] |
| Long-Range Dependency Modeling | Global context understanding | Connects rare patterns with overall morphology | Visual State Space Blocks [53] |
| Adaptive Fusion Modules | Intelligent feature combination | Enhances saliency of minority class features | AAF modules in skip connections [53] |
| Auxiliary Loss Functions | Additional supervisory signals | Improves gradient flow for rare classes | Multi-task learning frameworks [53] |
Advanced Troubleshooting: Complex Scenarios
Problem: Multiple Levels of Imbalance in Hierarchical Morphology
Scenario: Your dataset has imbalance at multiple levels - overall normal/abnormal imbalance, plus severe imbalance between different defect types.
Solution Strategy:
- Hierarchical Class Weighting
Staged Training Approach
- First stage: Train normal vs abnormal classifier
- Second stage: Train specialized classifiers for each defect type
- Ensemble results with carefully calibrated confidence thresholds
Multi-Task Learning Architecture
- Shared encoder with multiple classification heads
- Task-specific weighting in loss function
- Cross-task attention for leveraging related features
Problem: Concept Drift in Longitudinal Studies
Scenario: Class distribution changes over time as data collection protocols evolve or biological factors shift.
Detection Methods:
- Monitor performance metrics on recent data slices
- Track prediction confidence distributions
- Implement statistical process control charts
Adaptation Strategies:
Key Recommendations for Morphological Data
Based on current evidence and research findings [49] [54] [52]:
- First Approach: Always start with class weighting and threshold tuning before attempting data modification
- Tree Models Preferred: For tabular morphological features, use XGBoost/LightGBM with
scale_pos_weightrather than SMOTE - Deep Learning: For image data, invest in focal loss and architectural improvements before extensive data augmentation
- Evaluation: Use PR-AUC and F1-score as primary metrics, never rely on accuracy alone
- Validation: Always use stratified splits and consider nested cross-validation for reliable performance estimation
The most effective approach often combines multiple strategies: appropriate algorithm selection, careful evaluation metrics, and targeted data-level interventions when necessary [49] [52] [51].
Mitigating Lighting and Colorimetric Inconsistencies in Smartphone Imaging
Troubleshooting Guides
FAQ 1: How can I correct color variations caused by different smartphones or lighting conditions?
Problem: Color data from the same sample varies when captured with different smartphone models or under different lighting.
Solution: Implement a color correction algorithm using a reference color card.
Detailed Protocol:
- Create a Reference Color Card: Print a color card containing multiple standard color patches using a high-quality office printer and photo paper [55].
- Capture Image with Reference: Take a picture of your sample alongside the reference color card under your experimental lighting conditions [55] [56].
- Apply Color Correction Algorithm: Use an algorithm to map the colors from your image to the standard values of the reference card. The Root Polynomial-based Correction Algorithm (RPCC) is effective for this purpose [55].
- Convert Color Space: For analysis, convert the corrected RGB values to a device-independent color space like CIEL*a*b*, which is more aligned with human visual perception and reduces device-dependent bias [55] [57] [56].
FAQ 2: What is the best way to standardize the image capture environment?
Problem: Uncontrolled ambient light creates shadows, glare, and inconsistent color rendering.
Solution: Use a simple, portable enclosure and leverage built-in smartphone sensors.
Detailed Protocol:
- Build a Light-Control Chamber: A small, portable closed chamber—even a simple cardboard box—can shield the sample from variable ambient light. This ensures a fixed distance between the camera and the sample and provides consistent lighting [55].
- Optimize Camera Settings: Fix your smartphone camera's focus, white balance, and exposure settings. If possible, use a custom application to lock these parameters [55].
- Use a White Reference: Include a standard white background or a blank section in your image. This can be used for post-processing corrections, such as blank subtraction or illuminance correction, to normalize lighting effects [58].
- Estimate Illuminance: Use the white reference to calculate an approximate illuminance value (e.g., the Y component from CIE XYZ tristimulus values). This value can then be used to correct the RGB values of your sample, improving robustness across different lighting conditions [58].
FAQ 3: How can I prevent overexposure (blooming artifacts) in my images?
Problem: Bright spots in the image appear as white blobs with smeared edges, losing detail.
Solution: Optimize camera settings and understand sensor technology.
Detailed Protocol:
- Adjust Camera Parameters: Manually reduce the exposure time and ISO sensitivity/gain on your smartphone camera to prevent pixels from becoming saturated [59].
- Control Light Source: If using an external light source (e.g., in microscopy), reduce its intensity to avoid creating overly bright spots [59].
- Choose the Right Sensor: For dedicated imaging systems, select a camera with a CMOS sensor instead of a CCD sensor. CMOS sensors are less prone to blooming artifacts because they read pixel voltages locally without shifting excess charge to neighboring pixels [59].
FAQ 4: How can I automate analysis and reduce subjectivity?
Problem: Manually selecting regions of interest (ROI) is time-consuming and introduces user bias.
Solution: Employ machine learning models for automated segmentation and analysis.
Detailed Protocol:
- Model Selection for Segmentation: Use a deep learning model like U-Net for precise segmentation of your region of interest. This model has been shown to achieve high accuracy (e.g., average IoU of 0.90) in isolating sensor areas from images taken at arbitrary angles [57].
- Feature Extraction: Once segmented, extract color features (e.g., RGB, HSV, L*a*b* values) from the ROI [57] [58].
- Regression Modeling: Train a regression model, such as XGBoost, on the extracted color features to predict your target analyte concentration. This approach has demonstrated strong predictive performance, minimizing errors from visual interpretation [57].
Experimental Protocols for Key Cited Studies
Protocol 1: SMP-CC Mobile App for General Colorimetric Detection
This protocol is based on the development of an Android app (SMP-CC) for robust colorimetric analysis [55].
- Key Reagent: Custom-made reference color card.
- Procedure:
- Place the sample and the reference color card in the imaging area.
- Use the SMP-CC app (or a similar implementation) to capture an image. The app's viewfinder fixes the shooting distance.
- The app's built-in improved RPCC algorithm processes the image. It uses the reference card to perform a polynomial-based color correction, mapping the device-dependent RGB values to the device-independent L*a*b* color space.
- The app outputs the corrected color values for analysis.
- Outcome: This method significantly reduces the relative standard deviation of measurements, making results reliable across different smartphones and light environments [55].
Protocol 2: AI-Assisted Morphology Classification for Sperm Cells
This protocol details the use of a Convolutional Neural Network (CNN) for standardizing sperm morphology assessment, a key pre-processing step for analysis [7].
- Key Reagent: Annotated dataset of sperm images (e.g., SMD/MSS dataset).
- Procedure:
- Image Acquisition: Capture images of individual spermatozoa using a microscope with a digital camera (e.g., a CASA system) [7].
- Pre-processing: Convert images to grayscale and resize them (e.g., to 80x80 pixels). Clean the data to handle noise from staining or insufficient lighting [7].
- Data Augmentation: Augment the dataset using techniques like rotation and flipping to create a larger, more balanced dataset for training (e.g., expanding from 1,000 to 6,035 images) [7].
- Model Training & Classification: Train a CNN model on the augmented dataset to classify spermatozoa into morphological classes (e.g., normal, head defects, midpiece defects) based on expert annotations [7].
- Outcome: The model automates and standardizes morphology classification, achieving accuracy comparable to expert judgment and reducing operator-dependent subjectivity [7] [60].
Research Reagent Solutions
The table below lists key materials used in the featured experiments to achieve consistent smartphone imaging.
| Item Name | Function in Experiment | Specific Usage Example |
|---|---|---|
| Reference Color Card | Provides standard colors for post-hoc image color correction, mitigating device and light interference [55] [56]. | Used in the SMP-CC app to correct images of urine test strips for pH, protein, and glucose [55]. |
| Portable Closed Chamber | Creates a controlled environment with consistent lighting and fixed camera-to-sample distance [55]. | Shields paper-based colorimetric sensors from variable ambient light during image capture [55]. |
| Melanin Nanoparticles (MNPs) | A sustainable, metal-free nanomaterial that induces a color change upon target binding [57]. | Functionalized with antibodies for the colorimetric detection of the CA19-9 biomarker on paper-based devices [57]. |
| CMOS Sensor-based Camera | An image sensor less prone to blooming artifacts compared to CCD sensors, preserving image detail [59]. | Recommended for integration into medical and life science imaging devices to prevent saturation artifacts in microscopic images [59]. |
| RAL Diagnostics Staining Kit | A standardized stain used to prepare semen smears for morphological analysis [7]. | Used to stain sperm cells for image acquisition and subsequent AI-based classification [7]. |
Workflow and Signaling Pathway Diagrams
Smartphone Colorimetric Analysis Workflow
Color Correction and Gamut Signaling Pathway
Strategies for Handling Low-Resolution and Blurry Sperm Images
Troubleshooting Guides
FAQ 1: How can I improve the segmentation of sperm parts in low-resolution, unstained images?
Answer: Low-resolution, unstained sperm images present significant challenges for segmentation, primarily due to blurred boundaries and low contrast. A highly effective strategy is to employ a multi-scale part parsing network that integrates instance and semantic segmentation. This architecture allows for precise, instance-level parsing of each sperm, enabling accurate morphological measurement of the head, midpiece, and tail even in suboptimal images [22].
Experimental Protocol: Multi-Scale Part Parsing Network
- Network Architecture: Implement a dual-branch network.
- Instance Segmentation Branch: Uses a detector to locate and create a mask for each individual sperm cell. This provides the spatial context for each sperm instance [22].
- Semantic Segmentation Branch: Performs pixel-level classification to delineate the head, midpiece, and tail for all sperm in the image. This branch captures fine-grained details of the parts [22].
- Feature Fusion: Fuse the outputs from both branches. The instance masks from the first branch are used to crop and pool features from the second branch, resulting in a feature map that contains both instance-level localization and detailed part-level semantics [22].
- Training: Train the network on a dataset of annotated, unstained sperm images. The model learns to associate the local details from the semantic branch with the global context from the instance branch [22].
This method has been shown to achieve a state-of-the-art performance of 59.3% ( AP_{vol}^{p} ), surpassing previous models by a significant margin [22].
FAQ 2: What post-processing techniques can reduce measurement errors from blurry images?
Answer: After segmentation, a measurement accuracy enhancement strategy based on statistical analysis and signal processing is crucial to correct for errors induced by blurry boundaries. This involves a pipeline of techniques to filter and smooth the extracted morphological data [22].
Experimental Protocol: Measurement Accuracy Enhancement
- Outlier Removal: Apply the Interquartile Range (IQR) method to the initial measurements of parameters like head length and tail width. Data points falling outside 1.5 times the IQR above the upper quartile or below the lower quartile should be excluded from further analysis [22].
- Data Smoothing: Use Gaussian filtering on the remaining data points. This convolution-based filter reduces high-frequency noise and creates a smoother distribution of the measurements, minimizing the impact of random errors [22].
- Robust Correction: Implement a maximum value extraction technique. The core idea is that the blurring effect typically causes an under-estimation of the true sperm size. By analyzing the smoothed data and extracting the maximum values that represent the most probable true dimensions, you can correct the measurements upward [22].
Integrating this strategy with the segmentation output has been demonstrated to reduce measurement errors for the head, midpiece, and tail by up to 35.0% [22].
FAQ 3: Which deep learning models are most robust for segmenting different sperm components in challenging images?
Answer: The performance of deep learning models varies significantly across different sperm components. A systematic evaluation reveals that the optimal model choice depends on the specific structure being segmented [42].
Experimental Protocol: Model Evaluation and Selection
- Dataset Preparation: Use a dataset of live, unstained human sperm images where the head, acrosome, nucleus, neck, and tail have been accurately annotated by experts [42].
- Model Training: Train and evaluate multiple state-of-the-art models on the same dataset. Key models to compare include:
- Mask R-CNN: A two-stage instance segmentation model.
- YOLOv8 & YOLOv11: Single-stage, real-time object detection and segmentation models.
- U-Net: A convolutional network designed for biomedical image segmentation [42].
- Quantitative Analysis: Evaluate model performance using multiple metrics, including Intersection over Union (IoU), Dice coefficient, Precision, Recall, and F1-score [42].
The quantitative results from this systematic comparison are summarized in the table below.
Table 1: Performance Comparison of Deep Learning Models for Sperm Segmentation (Based on IoU)
| Sperm Component | Best Performing Model | Key Findings |
|---|---|---|
| Head, Nucleus, Acrosome | Mask R-CNN | Excels at segmenting smaller, more regular structures due to its two-stage, region-based approach [42]. |
| Neck | YOLOv8 | Performs comparably or slightly better than Mask R-CNN, demonstrating that single-stage models can be competitive for certain structures [42]. |
| Tail | U-Net | Achieves the highest IoU for this morphologically complex structure, benefiting from its multi-scale feature extraction and strong global perception [42]. |
FAQ 4: How can I simulate low-quality sperm images to test my algorithms?
Answer: Using simulation models to generate life-like semen images with controllable parameters is a powerful method for objectively validating segmentation and tracking algorithms. This approach allows you to test algorithms against a known ground truth under a wide variety of conditions [61].
Experimental Protocol: Sperm Image Simulation
- Sperm Model: Generate a 2D model of a sperm cell by combining a head and a flagellum (tail).
- Head: Modeled as a generally oval shape. Its image is created by defining specific pixel locations and convolving them with a point spread function to mimic optical effects [61].
- Flagellum: Modeled as a thin, uniform curve. The curve is defined by a series of points, and its image is similarly generated using a point spread function [61].
- Swimming Models: Incorporate different swimming modes to create dynamic image sequences. The four primary modes to simulate are:
- Linear mean swimming
- Circular swimming
- Hyperactive swimming
- Immotile (dead) sperm [61].
- Image Generation: Integrate multiple sperm cells with different swimming modes into a comprehensive image or video frame. Adjust parameters like noise level, cell density, and blur to mimic various image quality issues [61].
Research Reagent Solutions
Table 2: Essential Materials and Computational Tools for Sperm Image Analysis
| Item | Function in Research |
|---|---|
| Unstained Human Sperm Dataset | Provides a clinically relevant and non-invasive image resource for developing and validating segmentation algorithms intended for use in live sperm selection (e.g., for ICSI) [42] [22]. |
| Multi-Scale Part Parsing Network | A computational tool that enables instance-level parsing of multiple sperm targets and their components, which is a critical step for automated, multi-sperm morphology evaluation [22]. |
| Sperm Image Simulator | Software for generating synthetic semen images and videos with known ground truth. It is used for objective assessment and validation of CASA algorithms under a large spectrum of controllable conditions [61]. |
| Measurement Accuracy Enhancement Pipeline | A set of post-processing algorithms (IQR, Gaussian filtering, robust correction) designed to minimize morphological measurement errors caused by low image resolution and blur [22]. |
Workflow Diagrams
Sperm Image Analysis Workflow
Multi-Scale Parsing Network Architecture
In the specialized field of sperm image analysis, selecting the appropriate artificial intelligence architecture is only half the battle. Convolutional Neural Networks (CNNs) and Vision Transformers (ViTs) process visual information through fundamentally different mechanisms, necessitating tailored pre-processing pipelines to maximize their performance. CNNs leverage inductive biases for spatial hierarchies, making them efficient with local features, while ViTs use self-attention mechanisms to capture global contextual relationships across the entire image. Understanding these distinctions is crucial for researchers developing automated diagnostic systems for male fertility assessment, where accuracy directly impacts clinical outcomes. This guide provides targeted troubleshooting advice to optimize your pre-processing workflows for each architecture within reproductive biology applications.
Troubleshooting Guides
Guide 1: Resolving Poor CNN Generalization on Sperm Images
Problem: Your CNN model, trained on pre-processed sperm images, shows excellent training accuracy but fails to generalize to new clinical samples, incorrectly classifying sperm with subtle morphological defects.
Diagnosis: This common issue typically stems from overfitting to pre-processing artifacts rather than learning biologically relevant features. CNNs can latch onto consistent noise patterns introduced during pre-processing, mistaking them for true morphological signatures.
Solutions:
- Implement Domain-Specific Augmentation: Apply random, realistic variations during training that mirror actual clinical conditions. This includes slight changes in staining intensity, minor focus variations, and small rotational changes (e.g., ±5° rather than full 90° rotations) [62].
- Re-calibrate Noise Reduction: Over-aggressive denoising can remove critical textural details needed for morphological classification. For sperm head vacuole detection, use gentler median filters that preserve edges while reducing noise [40].
- Validate with Gradient Visualization: Apply Grad-CAM techniques to ensure the model focuses on biologically relevant regions (sperm structures) rather than background artifacts or pre-processing borders [63].
Guide 2: Addressing ViT Overfitting on Limited Sperm Datasets
Problem: Your Vision Transformer model achieves poor accuracy on validation sets despite extensive pre-training, struggling to identify abnormality patterns in sperm morphology.
Diagnosis: ViTs are "data-hungry" architectures that require large datasets to learn visual representations from scratch. With limited medical imaging data, they fail to adequately learn the self-attention mechanisms needed for global feature recognition [64] [63].
Solutions:
- Leverage Strategic Transfer Learning: Utilize ViTs pre-trained on large-scale natural image datasets (e.g., ImageNet) and fine-tune on your sperm image data. The fundamental visual patterns learned can transfer effectively to medical domains [65].
- Implement Hybrid Architectures: Adopt models like CoAtNet or ConvNeXt that combine CNN layers for local feature extraction with transformer layers for global context. These hybrids perform better on medium-sized datasets typical in medical research [64].
- Enhance with Advanced Augmentation: Employ CutMix or Mixup strategies that combine images to create synthetic training samples, forcing the model to learn more robust feature representations [38].
Guide 3: Fixing Computational Bottlenecks in High-Throughput Environments
Problem: Your pre-processing pipeline cannot maintain the required throughput for clinical volumes of sperm imagery, creating bottlenecks in your analysis workflow.
Diagnosis: Many standard pre-processing operations are computationally intensive when applied at scale, particularly those involving multiple transformation steps or high-resolution images.
Solutions:
- Optimize Image Dimensions: For CNNs, resize inputs to the minimum acceptable resolution that preserves morphological details. Studies show 80×80 pixels can be sufficient for sperm classification tasks while drastically reducing compute requirements [7] [40].
- Implement Selective Pre-processing: Apply the most computationally expensive operations (e.g., histogram equalization) only to problematic images identified through quality assessment filters [38].
- Pipeline Parallelization: Distribute pre-processing operations across multiple CPU cores, dedicating specific operations (normalization, augmentation, resizing) to specialized threads to maximize throughput.
Frequently Asked Questions (FAQs)
FAQ 1: Which architecture typically performs better for sperm morphology classification? The optimal architecture depends on your dataset size and computational resources. CNNs generally outperform ViTs on smaller datasets (under 100,000 images) and maintain advantages for fine-grained classification of local features like sperm head vacuoles. ViTs excel with larger datasets (>1 million images) and for complex scenes requiring global context understanding. For typical clinical datasets, hybrid approaches often provide the best balance [64] [63] [65].
Table: Architecture Performance Comparison for Sperm Image Analysis
| Metric | CNNs | Vision Transformers | Hybrid Models |
|---|---|---|---|
| Small Dataset Accuracy (<100K images) | 92% [7] | 55-69% [64] [7] | 85-90% [64] |
| Large Dataset Accuracy (>1M images) | 83.2% | 84.5% [64] | 90.88% [64] |
| Training Time | 1× (baseline) | 2.3× longer [64] | 1.5-1.8× longer [64] |
| Memory Requirements | 1× (baseline) | 2.8× higher [64] | 1.8-2.2× higher [64] |
| Fine-Grained Feature Detection | Excellent [66] | Good | Very Good |
FAQ 2: What are the essential pre-processing steps for sperm images across both architectures? All sperm image analysis pipelines should include these foundational steps regardless of architecture:
- Standardized Resizing: Square aspect ratio (e.g., 224×224 or 384×384) using linear interpolation for CNNs and area interpolation for ViTs [40] [38].
- Intensity Normalization: Pixel value rescaling to [0,1] range or standardization with mean centering and variance scaling [7] [5].
- Quality Control Filtering: Remove images with excessive blur, debris, or multiple sperm cells [66].
- Color Consistency: For stained samples, apply color normalization to minimize batch effects [40].
- Artifact Reduction: Apply mild Gaussian blur or median filtering to reduce noise without losing morphological details [40].
FAQ 3: How should augmentation strategies differ between CNNs and ViTs? CNNs benefit from aggressive, local augmentation to enhance translation invariance, while ViTs require more global, structural augmentations:
Table: Architecture-Specific Augmentation Recommendations
| Augmentation Type | CNN-Specific | ViT-Specific | Rationale |
|---|---|---|---|
| Rotation | Moderate (±15°) | Limited (±5°) | ViTs' positional embeddings are sensitive to major rotations [62] |
| Color Jitter | High | Moderate | CNNs need extensive color variance; ViTs less dependent on color cues [62] |
| Random Erasing | Beneficial | Less Effective | ViTs' attention mechanisms naturally handle occlusions [63] |
| Scale Variation | Moderate | High | ViTs benefit from multi-scale object recognition [65] |
| Horizontal Flip | Highly Recommended | Recommended | Effective for both architectures [62] |
FAQ 4: What are the critical differences in normalization requirements? CNNs typically use per-dataset normalization with global mean and standard deviation values, while ViTs often benefit from instance normalization that normalizes each image individually. This difference stems from ViTs' lack of built-in translation invariance, making them more sensitive to inter-image variation. For sperm images specifically, maintain consistent normalization across all samples processed with the same staining protocol to preserve diagnostically relevant intensity information [40] [38].
Experimental Protocols for Pre-processing Optimization
Protocol 1: Architecture Selection Benchmarking
Objective: Systematically determine whether CNNs or ViTs are better suited for your specific sperm image analysis task.
Methodology:
- Data Preparation:
- Curate a representative dataset of at least 1,000 sperm images with expert annotations
- Implement separate pre-processing pipelines for CNN and ViT architectures
- For CNNs: Apply aggressive augmentation (rotation, translation, scaling)
- For ViTs: Focus on position-preserving augmentations and instance normalization
Model Training:
- Select representative models: EfficientNet-B4 (CNN) and ViT-Base (Transformer)
- Train both models with identical computational budgets (epochs, hardware)
- Implement early stopping based on validation loss
Evaluation Metrics:
- Primary: Classification accuracy on held-out test set
- Secondary: Inference time, memory usage, and calibration metrics
- Clinical: Sensitivity/Specificity for detecting morphological abnormalities
Interpretation Analysis:
Protocol 2: Pre-processing Ablation Study
Objective: Identify which pre-processing steps contribute most to performance gains for your chosen architecture.
Methodology:
- Establish Baseline: Train your model with minimal pre-processing (resizing only)
- Incremental Implementation: Systematically add one pre-processing step at a time:
- Normalization (min-max or standardization)
- Noise reduction (Gaussian blur, median filtering)
- Contrast enhancement (histogram equalization, CLAHE)
- Color normalization (stain normalization)
- Measure Impact: After each addition, retrain and record performance change
- Optimize Pipeline: Keep only steps providing significant improvements (>2% accuracy gain)
- Validate: Confirm optimal pipeline generalizes to new data [40] [38]
Workflow Visualization
Diagram 1: Architecture Selection Workflow for Sperm Image Analysis
Diagram 2: Comprehensive Pre-processing Pipeline for Sperm Images
Table: Key Resources for Sperm Image Analysis Experiments
| Resource Category | Specific Tools/Solutions | Function in Research | Architecture Considerations |
|---|---|---|---|
| Annotation Platforms | Roboflow, FiftyOne | Image labeling, dataset management, augmentation | ViTs benefit from platforms supporting patch-level annotations [38] [62] |
| Data Augmentation Libraries | Albumentations, TorchVision | Apply transformations to training images | CNNs: Use local transforms; ViTs: Prefer global transforms [38] |
| Visualization Tools | Grad-CAM, Attention Rollout | Model interpretability and validation | Grad-CAM for CNNs; Attention maps for ViTs [63] |
| Pre-processing Frameworks | OpenCV, Pillow, Scikit-image | Fundamental image operations | Both architectures benefit from optimized image loading [40] |
| Dataset Versioning | DVC, FiftyOne | Track pre-processing variants and model performance | Critical for ablation studies [38] |
| Computational Resources | GPU clusters, TPU access | Model training and evaluation | ViTs typically require 2.8× more memory than CNNs [64] |
Optimizing pre-processing for CNNs versus Transformers in sperm image analysis requires understanding their fundamental architectural differences. CNNs benefit from aggressive, local augmentations that enhance their innate spatial biases, while ViTs require more global, structural approaches that respect their self-attention mechanisms. For most clinical research settings with moderate dataset sizes, hybrid approaches provide an effective balance, leveraging CNN efficiency for local feature extraction with ViT capacity for global context. By implementing the architecture-specific troubleshooting guides, experimental protocols, and optimization strategies outlined above, researchers can significantly enhance the performance and reliability of AI-assisted male fertility diagnostics.
Benchmarking Success: Validation Frameworks and Comparative Analysis of AI Models
Frequently Asked Questions
1. Why is a single expert insufficient for annotating sperm images? Manual sperm morphology assessment is highly subjective and reliant on the operator's expertise. Relying on a single expert introduces significant bias and reduces the reliability of your ground truth data. Using multiple experts helps capture the inherent complexity and variation in expert judgment, leading to a more robust and representative consensus [7].
2. What is a common method for resolving disagreements between experts? A standard approach involves defining different levels of agreement. For instance, in a study with three experts, scenarios were categorized as:
- Total Agreement (TA): All three experts assign the same label.
- Partial Agreement (PA): Two out of three experts agree on the same label.
- No Agreement (NA): Experts assign three different labels [7]. The "ground truth" label is often determined from images where there is at least partial agreement.
3. Which statistical metrics are used to measure expert agreement? For categorical data, such as classifying sperm defects, kappa statistics are the most common metrics:
- Cohen's Kappa: Measures agreement between two annotators.
- Fleiss' Kappa: Measures agreement among more than two annotators [67]. These metrics account for the agreement that would occur by chance, providing a more accurate measure of consensus.
4. How can I visualize areas of agreement and disagreement among experts? Agreement Heatmaps are an effective tool for visualization. A common agreement heatmap is generated by summing the binary segmentation masks from all experts. Pixels with higher values in the heatmap indicate areas where more experts agreed on the presence of a feature, such as a specific sperm defect [67].
5. What is the STAPLE algorithm and when should I use it? The STAPLE (Simultaneous Truth and Performance Level Estimation) algorithm is an advanced method that computes a probabilistic estimate of the ground truth segmentation from multiple expert annotations. It not only generates a consensus segmentation but also estimates the reliability of each expert, which is particularly useful for training robust AI models [67].
Troubleshooting Guides
Problem: Low Inter-Expert Agreement on Sperm Defect Classification
- Potential Cause: Inconsistent application of classification criteria (e.g., David or WHO classification) among experts.
- Solution:
- Re-train Experts: Organize a joint session to review and calibrate on a subset of images using the standard reference manual.
- Refine Guidelines: Ensure your annotation protocol provides clear, image-based examples for each defect class, especially for borderline cases.
- Iterate: Conduct a pilot annotation round, measure agreement, discuss discrepancies, and refine the guidelines before proceeding with the full dataset [7].
Problem: Handling Sperm Images with Multiple or Associated Defects
- Potential Cause: A single spermatozoon can have anomalies in the head, midpiece, and tail simultaneously, making classification ambiguous.
- Solution: Implement a detailed labeling system that allows experts to document all present anomalies for a single cell. Your ground truth file should capture this complexity by detailing the various anomalies, not just a single primary label [7].
Problem: AI Model Performance is Poor Despite Using Expert Annotations
- Potential Cause: The "noise" from expert disagreements in the training data is adversely impacting the model's learning.
- Solution: Instead of using raw annotations from a single expert, use a consensus-derived ground truth for training. Employ methods like STAPLE or simply filter your training set to only include images that achieved a pre-defined agreement level (e.g., Partial or Total Agreement) [7] [67].
Experimental Protocols & Data
Protocol: Implementing a Multi-Expert Annotation Workflow for Sperm Morphology
Sample Preparation & Image Acquisition:
Expert Classification:
- Select at least three experts with extensive experience in semen analysis.
- Provide each expert with the same set of images and a standardized classification form based on a system like the modified David classification (which includes 12 classes of defects for head, midpiece, and tail) [7].
- Ensure experts classify the images independently to avoid bias.
Data Compilation and Agreement Analysis:
- Compile a ground truth file containing the image name, classifications from all experts, and morphometric data [7].
- Use statistical software (e.g., IBM SPSS) to calculate inter-expert agreement. Employ Fisher’s exact test to evaluate significant differences in each morphology class and calculate kappa statistics to assess reliability [7] [67].
Generating Consensus Ground Truth:
- Categorize each image based on expert agreement (TA, PA, NA).
- For model training, you may decide to use only TA images or use a consensus label from PA images, potentially validated by a senior expert.
Table: Quantitative Analysis of Expert Agreement in a Sperm Morphology Study
This table summarizes potential outcomes from an agreement analysis, based on a real study involving three experts classifying 1000 sperm images into normal and abnormal categories [7].
| Agreement Scenario | Number of Images | Percentage of Dataset | Typical Interpretation for Ground Truth |
|---|---|---|---|
| Total Agreement (TA) | 700 | 70% | High-confidence labels; ideal for training/validation. |
| Partial Agreement (PA) | 250 | 25% | Medium-confidence; requires consensus rule for a final label. |
| No Agreement (NA) | 50 | 5% | Low-confidence; should be reviewed or excluded from training. |
Table: Key Metrics for Assessing Inter-Annotator Agreement
| Metric | Use Case | Interpretation |
|---|---|---|
| Cohen's Kappa | Agreement between two raters | <0: No agreement; 0-0.20: Slight; 0.21-0.40: Fair; 0.41-0.60: Moderate; 0.61-0.80: Substantial; 0.81-1: Almost perfect. |
| Fleiss' Kappa | Agreement among more than two raters | Same interpretation scale as Cohen's Kappa. |
| Intra-class Correlation (ICC) | Agreement on continuous measurements | Similar interpretation to kappa, with values closer to 1 indicating stronger agreement. |
The Scientist's Toolkit: Research Reagent Solutions
| Item | Function in the Experiment |
|---|---|
| RAL Diagnostics Staining Kit | Stains semen smears to provide clear contrast for visualizing sperm morphology under a microscope [7]. |
| MMC CASA System | A Computer-Assisted Semen Analysis system used for automated image acquisition, capturing sequential images of individual spermatozoa for analysis [7]. |
| Improved Neubauer Hemocytometer | A precise counting chamber used in manual semen analysis to determine sperm concentration [68]. |
| Leja Counting Chamber (20µm) | A specialized chamber used for loading semen samples for analysis in systems like SMAS or other CASA systems to ensure consistent depth [68]. |
| SPSS Software | Statistical software used for advanced analysis of inter-expert agreement, including calculating kappa statistics and Fisher's exact test [7]. |
Workflow Diagrams
Multi-Expert Annotation Workflow
Agreement Assessment Methods
FAQs on Performance Metrics for Sperm Image Analysis
FAQ 1: What is the practical difference between Precision and Recall in the context of detecting acrosome-reacted sperm?
Precision and Recall measure different aspects of your model's performance, which is critical when the cost of different errors varies.
- Precision answers: "Of all sperm the model flagged as 'acrosome-reacted,' how many were correct?" A high precision means you can trust the model's positive identifications, minimizing false alarms. The formula is: Precision = True Positives / (True Positives + False Positives) [69] [70].
- Recall answers: "Of all the truly 'acrosome-reacted' sperm in the sample, how many did the model find?" A high recall means the model misses very few true positives. The formula is: Recall = True Positives / (True Positives + False Negatives) [69] [70].
In practice, for acrosome reaction (AR) classification, if your goal is to isolate a highly pure population of reacted sperm for further analysis, you would prioritize high Precision. If your goal is to ensure you do not miss any reacted sperm in a diagnostic setting, you would prioritize high Recall [69].
FAQ 2: Our model has high accuracy but poor performance in production. What could be wrong?
A high accuracy score with poor real-world performance often indicates a class imbalance problem [69]. In sperm image analysis, if your dataset has a vast majority of "normal" sperm and very few "abnormal" ones, a model can achieve high accuracy by simply predicting "normal" every time, while failing miserably at its actual task of detecting abnormalities.
- Solution: Rely on a combination of metrics. The F1 score, which is the harmonic mean of Precision and Recall, provides a single metric that balances both concerns and is more robust to class imbalance [69]. For object detection tasks involving localization (like finding sperm in an image), mean Average Precision (mAP) is the preferred metric as it evaluates both the correctness of the classification and the accuracy of the bounding box location [71] [69] [70].
FAQ 3: What does mAP mean, and why is it the standard metric for evaluating object detection models like our sperm detector?
mAP (Mean Average Precision) is the primary metric for evaluating object detection models, such as those based on Faster R-CNN used to detect and classify multiple sperm in a single image [71] [69] [70].
- Average Precision (AP): First, for each class (e.g., "AR sperm," "non-AR sperm"), the model's precision is calculated across different recall levels and confidence thresholds. The AP summarizes the shape of the precision-recall curve into a single number [69] [70].
- Mean Average Precision (mAP): This is the average of the AP values across all object classes. A higher mAP (on a scale of 0 to 1 or 0% to 100%) indicates a model that is better at both finding all relevant objects (high recall) and correctly classifying them (high precision) [71] [70]. For instance, a deep learning-based Acrosome Reaction Classification System (ARCS) achieved a mAP of over 97%, demonstrating performance comparable to experts [71].
FAQ 4: How do we validate that our image pre-processing steps are improving model performance and not introducing artifacts?
Validation requires a rigorous, step-wise experimental protocol.
- Establish a Baseline: Train and evaluate your model on a raw, unprocessed validation dataset. Record key metrics (Accuracy, Precision, Recall, F1, mAP).
- Apply a Single Pre-processing Step: Apply one pre-processing technique (e.g., a specific noise-reduction filter) to the validation set.
- Re-evaluate and Compare: Run the same model on the processed validation set and compare the metrics to the baseline.
- Iterate: Systematically test each pre-processing step and combinations thereof.
A significant and consistent improvement in metrics like mAP or F1 score across the validation set indicates a beneficial effect. A drop in performance may suggest that the process is removing biologically relevant information or introducing distortions. This methodical approach is crucial for optimizing sperm image pre-processing techniques [7].
Troubleshooting Guides
Problem: Low Precision (Too many False Positives)
- Symptoms: The model incorrectly labels normal sperm as abnormal or detects sperm where there are none (e.g., confusing debris with sperm cells).
- Potential Causes & Solutions:
- Cause 1: Class imbalance in the training data. The model is biased towards the majority class.
- Solution: Apply data augmentation techniques (rotation, scaling, slight color shifts) for the under-represented class to balance the dataset [7].
- Cause 2: Insufficient or inaccurate training data for the "negative" class (e.g., not enough examples of debris or non-sperm cells).
- Solution: Improve the annotation quality and expand the training dataset to include more diverse examples of negative samples [70].
- Cause 3: The confidence score threshold is set too low.
- Solution: Increase the confidence threshold, so the model only makes a prediction when it is more certain [69].
- Cause 1: Class imbalance in the training data. The model is biased towards the majority class.
Problem: Low Recall (Too many False Negatives)
- Symptoms: The model fails to detect many truly abnormal or acrosome-reacted sperm.
- Potential Causes & Solutions:
- Cause 1: The model is not sensitive enough to the subtle morphological features of the target class (e.g., micro-changes in the plasma membrane of AR sperm) [71].
- Solution: Use a deeper neural network architecture (e.g., Inception–ResNet v2 instead of a basic ResNet-50) that can capture more complex features, as demonstrated in AR classification research [71].
- Cause 2: The confidence score threshold is set too high.
- Solution: Lower the confidence threshold to allow the model to make more predictions, capturing more true positives at the risk of also increasing false positives [69].
- Cause 3: Poor image quality or staining, making true features hard to distinguish.
- Solution: Revisit sample preparation protocols. Ensure consistent and high-quality staining (e.g., using Diff-Quick or Coomassie Brilliant Blue stains) to enhance feature visibility [71].
- Cause 1: The model is not sensitive enough to the subtle morphological features of the target class (e.g., micro-changes in the plasma membrane of AR sperm) [71].
Problem: Inconsistent mAP Scores
- Symptoms: mAP varies significantly when evaluated on different datasets or after re-training.
- Potential Causes & Solutions:
- Cause 1: Overfitting to the training data. The model has memorized the training images instead of learning generalizable features.
- Solution: Implement regularization techniques (e.g., dropout, weight decay) and use extensive data augmentation to increase the diversity of the training data [7].
- Cause 2: Mismatch between the training data and the validation/test data (e.g., different magnifications, staining protocols, or microscope settings).
- Solution: Ensure consistency in image acquisition. Research shows that independent models may be needed for different magnifications (e.g., 400x vs. 1000x) for optimal performance [71].
- Cause 3: Incorrect or inconsistent ground truth annotations.
- Cause 1: Overfitting to the training data. The model has memorized the training images instead of learning generalizable features.
The table below defines key performance metrics and their relevance to sperm image analysis research.
| Metric | Formula | Interpretation in Sperm Analysis | Use-Case Example |
|---|---|---|---|
| Accuracy | (TP + TN) / (TP + TN + FP + FN) | Overall, how often the model is correct across all classes. | Best for balanced datasets where false positives and false negatives are equally important. |
| Precision | TP / (TP + FP) | The purity of the detected positive class. How reliable a positive diagnosis is. | Crucial when the cost of a false positive is high (e.g., incorrectly diagnosing an AR sperm). |
| Recall | TP / (TP + FN) | The completeness of the detected positive class. The ability to find all true positives. | Vital when missing a true positive is unacceptable (e.g., failing to find rare sperm in azoospermia). |
| F1 Score | 2 * (Precision * Recall) / (Precision + Recall) | The harmonic mean of Precision and Recall. Balances the two concerns. | A good single metric for imbalanced datasets when you need a balance between P and R. |
| mAP | Mean of Average Precision over all classes | The gold standard for object detection. Measures both classification and localization accuracy. | Evaluating a model that detects and classifies multiple sperm in a single microscopic image [71]. |
TP: True Positives; TN: True Negatives; FP: False Positives; FN: False Negatives.
Experimental Protocol: Validating an Acrosome Reaction Classification System
This protocol is based on the methodology described in [71] for developing a deep learning-based AR classification system.
1. Objective: To develop and validate a Convolutional Neural Network (CNN) model for the automatic detection and classification of acrosome-reacted (AR) and non-AR sperm in microscopic images.
2. Materials and Reagents:
- Sperm Samples: Prepared boar semen samples (can be adapted for human).
- Staining Kit: Diff-Quick or Coomassie Brilliant Blue staining kit for acrosome visualization [71].
- Microscopy: Optical microscope with a digital camera, capable of 400x and 1000x magnification.
- Software: Python with deep learning libraries (e.g., TensorFlow, PyTorch), and annotation tools (e.g., VGG Image Annotator).
3. Step-by-Step Methodology:
- Step 1: Dataset Collection
- Capture a minimum of several hundred microscopic images at both 400x and 1000x magnification to ensure a robust dataset [71].
- Step 2: Expert Annotation & Ground Truth Establishment
- Have three independent experts annotate each sperm in every image. The annotations should include:
- A bounding box around each sperm head.
- A class label: "AR" or "non-AR."
- Resolve disagreements between experts to establish a single, reliable ground truth for model training and evaluation. This step is critical to reduce subjective bias [71] [7].
- Have three independent experts annotate each sperm in every image. The annotations should include:
- Step 3: Model Selection and Training
- Select a region-based CNN architecture like Faster R-CNN [71].
- Choose a backbone CNN for feature extraction (e.g., ResNet-50 or Inception–ResNet v2). Deeper networks like Inception–ResNet v2 may capture micro-changes in the plasma membrane more effectively [71].
- Split the annotated dataset into training (e.g., 80%) and testing (e.g., 20%) sets.
- Train the model on the training set. Use data augmentation (random rotations, flips, brightness/contrast adjustments) to improve model generalization [7].
- Step 4: Model Evaluation
- Use the held-out test set for the final evaluation.
- Run the trained model on the test images to obtain bounding box predictions and class scores.
- Calculate the key performance metrics, with mAP as the primary benchmark. Compare the model's mAP and its calculation speed against the performance of the human experts [71].
Workflow and Pathway Diagrams
Sperm Image Analysis Workflow
mAP Calculation Logic
The Scientist's Toolkit: Research Reagent Solutions
| Reagent / Material | Function in Sperm Image Analysis |
|---|---|
| Diff-Quick Stain | A xanthene–thiazine staining method that provides fast, simple, and cost-effective visualization of the acrosome status for initial assessment [71]. |
| Coomassie Brilliant Blue (CBB) | A staining method used to examine acrosome integrity. Like Diff-Quick, it is simple and fast but may not effectively detect small plasma membrane modifications [71]. |
| Membrane-Impermeable Fluorescence Dyes (MFDs) | Used in advanced molecular biology research to detect initial changes in the plasma membrane and acrosomal outer membrane with high performance. Requires specialized and expensive equipment (e.g., fluorescence microscopes) [71]. |
| RAL Diagnostics Staining Kit | A commercial staining kit used for preparing semen smears for morphological assessment according to WHO guidelines, ensuring standardized staining for datasets [7]. |
| SpermBlue Stain | A specific stain used for assessing sperm morphology in computer-assisted sperm analysis (CASA) systems, providing clear contrast for head, midpiece, and tail analysis [72]. |
This technical support center is designed for researchers working at the intersection of deep learning and reproductive medicine, specifically those developing automated sperm morphology analysis systems. A significant challenge in this domain is transitioning from theoretical model design to a robust, functional experimental setup. This guide addresses the most common technical hurdles encountered during the implementation of Convolutional Neural Networks (CNNs) for feature extraction from sperm images. The content is framed within a broader research thesis focused on optimizing sperm image pre-processing techniques to enhance the performance of subsequent deep learning models. The following sections provide detailed troubleshooting guides, FAQs, and standardized protocols to facilitate your experiments, saving valuable research time and improving reproducibility.
Troubleshooting Guides & FAQs
Data Preparation and Augmentation
Q1: My model is achieving high training accuracy but poor test accuracy. What steps can I take to improve its generalization?
This is a classic sign of overfitting, often due to a limited or imbalanced dataset.
- Problem Diagnosis: Check for a significant difference between training and validation/test accuracy. Inspect your dataset's size and class distribution.
- Recommended Solutions:
- Implement Aggressive Data Augmentation: Systematically generate new training examples to simulate biological and imaging variations.
- Techniques: Apply rotations (±10°), horizontal/vertical flips, slight brightness and contrast adjustments, and additive noise to mimic acquisition artifacts [7] [23].
- Consideration: Ensure augmentations are biologically plausible. For instance, avoid extreme rotations that would not occur in standard microscopy.
- Employ Feature-Level Fusion: Combine features extracted from multiple CNN architectures (e.g., different EfficientNetV2 variants) to create a more robust feature representation. This leverages the complementary strengths of various networks and reduces reliance on features specific to a single model's training data [73].
- Utilize Deep Feature Engineering (DFE): Instead of using the CNN's final classification layer, extract features from intermediate layers (e.g., after Global Average Pooling) and apply classical feature selection and dimensionality reduction techniques like Principal Component Analysis (PCA) before training a classifier like a Support Vector Machine (SVM). This hybrid approach can improve generalization, especially on smaller datasets [29].
- Implement Aggressive Data Augmentation: Systematically generate new training examples to simulate biological and imaging variations.
Q2: My dataset has a high level of inter-expert variability in labeling. How can I build a reliable model with noisy annotations?
This is a fundamental challenge in medical imaging, as expert disagreement can introduce label noise.
- Problem Diagnosis: Quantify the inter-observer agreement using statistics like Cohen's Kappa or by analyzing the distribution of "Total Agreement," "Partial Agreement," and "No Agreement" among experts on a sample of your data [7].
- Recommended Solutions:
- Establish a Ground Truth Protocol: Define a clear consensus strategy. The most common label among multiple experts can be used, or images without full expert agreement can be excluded for initial model training [7].
- Leverage Label-Smoothing Techniques: During training, use loss functions that incorporate label smoothing, which explicitly accounts for the uncertainty in the labels by penalizing over-confident model predictions.
- Incorporate Anatomical Priors: Use model architectures that integrate prior biological knowledge. For example, one can use unsupervised spatial prediction tasks or pseudo-mask generation based on known sperm structures to guide the model, making it more robust to labeling inconsistencies [73].
Model Architecture and Training
Q3: How can I make my CNN focus on morphologically relevant parts of the sperm cell, like the head or tail, and not on background artifacts?
Standard CNNs process entire images uniformly. You need to integrate attention mechanisms.
- Problem Diagnosis: Use visualization tools like Grad-CAM to generate heatmaps of the image regions most influential for the model's decision. If the highlights are on background noise or irrelevant sections, this confirms the problem [29] [74].
- Recommended Solutions:
- Integrate an Attention Module: Incorporate a Convolutional Block Attention Module (CBAM) into your CNN backbone (e.g., ResNet50). CBAM sequentially applies both channel and spatial attention, allowing the network to amplify important features and focus on specific spatial regions [29].
- Systematic Visualization: Regularly apply Grad-CAM or similar techniques during the model development cycle. This not only helps in debugging but also provides clinically interpretable results that can build trust with embryologists [29] [74].
Q4: What model design choices can I make to handle the classification of many fine-grained sperm defect classes (e.g., 18+ categories)?
Direct application of a standard CNN classifier may struggle with fine-grained distinctions.
- Problem Diagnosis: Review your model's confusion matrix. High error rates between visually similar defect classes (e.g., different head shape abnormalities) indicate the model lacks discriminative power.
- Recommended Solutions:
- Adopt an Ensemble Framework: Do not rely on a single model. Implement a multi-level ensemble that combines predictions from multiple CNNs.
- Feature-Level Fusion: Extract and concatenate feature vectors from different pre-trained models, then train a meta-classifier (e.g., SVM, Random Forest) on this combined feature set [73].
- Decision-Level Fusion: Train multiple models independently and combine their final predictions using soft voting or a stacking meta-classifier [73].
- Hybrid Deep Feature Engineering: As in the solution for Q1, use a CNN as a powerful feature extractor and then apply powerful shallow classifiers like SVM with an RBF kernel, which can often achieve higher accuracy on complex classification tasks than the CNN's native fully-connected layers [29].
- Adopt an Ensemble Framework: Do not rely on a single model. Implement a multi-level ensemble that combines predictions from multiple CNNs.
Quantitative Performance Data
Table 1: Performance Comparison of Different CNN-Based Approaches on Public Sperm Morphology Datasets
| Model Architecture | Dataset | Key Technique | Reported Accuracy | Key Advantage |
|---|---|---|---|---|
| CBAM-ResNet50 + DFE (SVM-RBF) [29] | SMIDS (3-class) | Deep Feature Engineering | 96.08% ± 1.2 | High accuracy; combines deep learning with classical ML |
| CBAM-ResNet50 + DFE (SVM-RBF) [29] | HuSHeM (4-class) | Deep Feature Engineering | 96.77% ± 0.8 | High accuracy on another benchmark |
| Multi-Level Ensemble (EfficientNetV2) [73] | Hi-LabSpermMorpho (18-class) | Feature & Decision-Level Fusion | 67.70% | Effective on high-class, imbalanced datasets |
| Stacked Ensemble (VGG16, DenseNet, ResNet-34) [29] | HuSHeM | Ensemble Learning | ~98.2% | State-of-the-art on specific datasets |
| CNN (Basic Architecture) [7] | SMD/MSS (Augmented) | Data Augmentation | 55% to 92% | Shows impact of dataset size and quality |
Experimental Protocols
Protocol 1: Implementing a Deep Feature Engineering Pipeline
This protocol details the hybrid methodology that combines a CBAM-enhanced CNN with classical machine learning for superior performance [29].
Feature Extraction:
- Backbone Model: Use a pre-trained ResNet50 architecture with integrated Convolutional Block Attention Module (CBAM).
- Feature Source: Forward-pass your pre-processed sperm images through the network. Extract the high-dimensional feature maps from multiple layers, typically including the layer after the CBAM module, the Global Average Pooling (GAP) layer, and the Global Max Pooling (GMP) layer.
- Output: This results in a large feature vector for each image.
Feature Selection & Dimensionality Reduction:
- Pooling: Apply GAP/GMP to spatial feature maps to convert them to a fixed-length vector.
- Dimensionality Reduction: Apply Principal Component Analysis (PCA) to the concatenated feature vectors. This reduces noise and computational complexity while retaining the most informative features.
- Alternative Methods: Other feature selection methods like Chi-square test, Random Forest importance, and variance thresholding can also be evaluated [29].
Classification:
- Classifier: Train a Support Vector Machine (SVM) classifier with a Linear or RBF kernel on the reduced feature set.
- Evaluation: Use 5-fold cross-validation to robustly estimate the model's performance (accuracy, precision, recall, F1-score).
Protocol 2: Data Augmentation for Sperm Images
This protocol standardizes the process of creating a robust training dataset [7] [23].
Base Image Acquisition:
- Acquire images using a standardized microscope setup (e.g., 100x oil immersion objective, bright-field mode) with stained semen smears to ensure consistency [7].
Augmentation Execution:
- Use a software library (e.g., TensorFlow's
ImageDataGenerator, Albumentations) to apply the following transformations to each training image:- Geometric Transformations: Random rotation (range: ±10°), horizontal flip, vertical flip.
- Photometric Transformations: Random variations in brightness (±15% of original value) and contrast (±10% of original value).
- Noise Injection: Add random Gaussian noise to simulate imperfect acquisition conditions.
- Use a software library (e.g., TensorFlow's
Validation:
- Crucially, apply augmentation only to the training set. The validation and test sets should use original, non-augmented images to provide an unbiased evaluation of model performance.
Workflow and System Diagrams
Deep Feature Engineering Workflow
The Scientist's Toolkit: Research Reagent Solutions
Table 2: Essential Materials and Computational Tools for Sperm Image Analysis
| Item Name | Function / Role in the Experiment | Technical Specification / Example |
|---|---|---|
| RAL Diagnostics Staining Kit [7] | Stains semen smears to provide contrast for microscopic imaging, revealing structural details of the sperm head, midpiece, and tail. | Standardized staining kit for consistent sample preparation. |
| MMC CASA System [7] | An integrated hardware/software system for Computer-Aided Semen Analysis. Used for automated image acquisition from stained smears. | Typically includes an optical microscope with a 100x oil immersion objective and a digital camera. |
| SMIDS / HuSHeM Datasets [29] | Publicly available benchmark datasets for training and validating sperm morphology classification models. Essential for comparative studies. | SMIDS (3000 images, 3-class), HuSHeM (216 images, 4-class). Openly accessible for academic use. |
| Convolutional Block Attention Module (CBAM) [29] | A lightweight neural network module that can be integrated into CNNs like ResNet50. Enhances feature representation by focusing on salient image regions. | Sequentially infers channel and spatial attention maps from intermediate feature maps. |
| Grad-CAM Visualization [29] [74] | A model interpretation technique that produces heatmaps ("saliency maps") highlighting image regions influential for a model's prediction. | Critical for debugging models and providing clinically interpretable results. |
| EfficientNetV2 Models [73] | A family of state-of-the-art CNN architectures known for their high parameter efficiency and accuracy. Used as backbone feature extractors. | Can be used in an ensemble for feature-level and decision-level fusion. |
This technical support center provides guidance for researchers benchmarking Vision Transformers (ViTs) against Convolutional Neural Networks (CNNs) within the specialized domain of sperm image pre-processing and analysis. The following guides and FAQs address the practical challenges you may encounter when selecting and optimizing these architectures for your projects.
Convolutional Neural Networks (CNNs) have been the cornerstone of computer vision for over a decade, powering applications from medical imaging to object detection [75]. Their architecture is built on convolutional layers that apply filters to local regions of an image, hierarchically detecting patterns from simple edges to complex shapes. CNNs possess a strong inductive bias for images, assuming that nearby pixels are related and that features should be translation-invariant. This makes them data-efficient and computationally adept for many tasks [75] [76].
Vision Transformers (ViTs), introduced in 2020, marked a significant paradigm shift [76]. Instead of processing local regions, a ViT divides an image into a sequence of fixed-size patches (e.g., 16x16 pixels), treating them similarly to words in a sentence [75] [76]. These patches are then processed by a transformer encoder, which uses a self-attention mechanism to weigh the importance of all other patches when encoding a single patch. This allows ViTs to capture global context and long-range dependencies within an image from the very first layer [75] [63].
Key Comparative Benchmarks
The table below summarizes the performance of well-known CNN and ViT models across several public medical imaging benchmarks, providing a reference for expected performance in clinical tasks.
Table 1: Performance Benchmarks of CNN and ViT Models on Medical Image Classification Tasks [77]
| Model Architecture | Task | Dataset Size | Top-1 Accuracy (%) |
|---|---|---|---|
| ResNet-50 (CNN) | Chest X-ray Pneumonia Detection | 5,856 images | 98.37 |
| EfficientNet-B0 (CNN) | Skin Cancer Melanoma Detection | 2,613 images | 81.84 |
| DeiT-Small (ViT) | Brain Tumor Classification | 7,020 images | 92.16 |
| ViT-Base (ViT) | Chest X-ray Pneumonia Detection | 5,856 images | 97.82 |
Frequently Asked Questions (FAQs)
Architecture and Model Selection
Q1: For a new sperm morphology analysis project with a limited dataset of under 2,000 annotated images, which architecture should I start with, and why?
A1: For a small dataset of under 2,000 images, a CNN-based architecture is the recommended starting point [75] [63]. CNNs have strong inductive biases for images (like locality and translation invariance), which act as a form of built-in knowledge. This allows them to generalize effectively and achieve good performance without requiring massive amounts of training data [75]. In contrast, Vision Transformers lack these built-in assumptions and are data-hungry; without extensive pre-training on large datasets (often millions of images), their performance on small-scale tasks can be disappointing [75] [63].
Q2: We need to deploy our model on a standard microscope's embedded system. Which architecture is more suitable for this resource-constrained environment?
A2: For deployment on resource-constrained edge devices like an embedded microscope system, CNNs are typically more practical [75] [78]. CNN architectures (e.g., MobileNet, EfficientNet) have been extensively optimized for low-latency inference and possess a smaller memory footprint [63]. While ViTs are generally more computationally intensive, techniques like pruning, quantization, and knowledge distillation can optimize them for edge deployment [78]. However, this adds complexity, and for out-of-the-box efficiency, CNNs remain the leader [75].
Q3: Our primary challenge is differentiating subtle defects in sperm head morphology, which requires understanding complex shapes and textures. Would a CNN or ViT be better?
A3: This problem requires capturing both fine-grained local textures and the overall global context of the sperm head. While CNNs are excellent at extracting local features like edges and textures [75], ViTs excel at capturing global context and long-range dependencies through self-attention [63] [76]. For such a nuanced task, we recommend investigating hybrid architectures (e.g., ConvNeXt, Swin Transformer). These models combine the powerful local feature extraction of CNNs with the global reasoning capabilities of ViTs, potentially offering the best of both worlds for your application [75] [63].
Training and Optimization
Q4: Our ViT model is training very slowly and consuming excessive GPU memory. What strategies can we use to improve efficiency?
A4: Several strategies can mitigate the high computational demands of ViTs:
- Mixed Precision Training: This technique uses lower-precision data types (e.g., 16-bit floating point) for calculations, which reduces memory usage and can speed up training without significant loss of accuracy [79].
- Gradient Accumulation: This method simulates a larger batch size by accumulating gradients over several mini-batches before updating the model's weights. This is useful when the maximum batch size that fits in GPU memory is too small [80].
- Model Compression: Pruning removes less important connections or attention heads from the model, while quantization reduces the numerical precision of the model's weights (e.g., from 32-bit to 8-bit). These are highly effective for reducing model size and speeding up inference [78].
Q5: Our CNN model performs well on training data but poorly on unseen validation images, suggesting overfitting. How can we address this?
A5: Overfitting is a common challenge, especially with limited data. You can combat it with several techniques:
- Data Augmentation: Artificially expand your dataset by creating modified versions of your images through transformations like random flipping, rotation, scaling, and color adjustments [81]. This helps the model learn invariances and generalize better.
- Regularization:
- Dropout: Randomly "drop out" a percentage of neurons during training to prevent the network from becoming overly reliant on any single neuron [80].
- L1/L2 Regularization: Add a penalty to the loss function based on the size of the model's weights, encouraging smaller weights and a simpler model [80].
- Early Stopping: Monitor the validation loss during training and halt the process when the validation performance stops improving, preventing the model from memorizing the training data [80].
Experimental Protocols for Benchmarking
This section provides a detailed methodology for conducting a fair and reproducible benchmark between CNN and ViT models in the context of sperm image analysis.
Dataset Preparation and Pre-processing
Objective: To create a standardized, high-quality dataset for training and evaluation.
- Image Sourcing: Use publicly available, annotated sperm image datasets such as the Human Sperm Morphology Analysis DataSet (HSMA-DS), Modified Human Sperm Morphology Analysis Dataset (MHSMA), or the more recent SVIA dataset, which includes annotations for detection, segmentation, and classification [33].
- Pre-processing Pipeline:
- Resizing: Resize all images to a uniform input size required by the models being tested (e.g., 224x224). Use bilinear interpolation for a smooth result [81].
- Normalization: Scale pixel values to a standard range, typically [0, 1] or using Z-score normalization (subtracting the mean and dividing by the standard deviation). This stabilizes and speeds up training [81].
- Data Splitting: Split the dataset into three parts: Training (70%), Validation (20%), and Test (10%). Ensure the class distribution (e.g., normal vs. abnormal sperm) is maintained across all splits to prevent bias [81].
- Data Augmentation (for Training Set only): Apply random but realistic transformations to the training images to improve model robustness. For sperm images, this could include:
- Horizontal and vertical flipping
- Small random rotations (±10-15 degrees)
- Brightness and contrast variations [81]
Model Training and Evaluation Protocol
Objective: To train CNN and ViT models under identical conditions and evaluate them on a held-out test set.
- Model Selection: Choose representative models from each family. For example:
- Training Configuration:
- Optimizer: Use Adam or SGD with momentum [80].
- Learning Rate: Employ a learning rate schedule (e.g., cosine decay) or a fixed rate (e.g., 1e-4) for fine-tuning pre-trained models [80].
- Loss Function: Use Cross-Entropy loss for classification tasks.
- Batch Size: Use the largest batch size that fits your GPU memory.
- Number of Epochs: Train until validation performance plateaus.
- Evaluation Metrics: Report the following metrics on the test set:
- Top-1 Accuracy
- Precision, Recall, and F1-Score (especially important for imbalanced datasets)
- Confusion Matrix
The workflow for this benchmarking protocol is outlined in the diagram below.
The Scientist's Toolkit: Research Reagent Solutions
Table 2: Essential Computational "Reagents" for Sperm Image Analysis Experiments
| Item Name | Function / Purpose |
|---|---|
| Public Sperm Datasets (e.g., HSMA-DS, SVIA, VISEM-Tracking) | Provides standardized, annotated image data for model training and benchmarking. Critical for reproducibility [33]. |
| Pre-trained Models (PyTorch Image Models, Hugging Face Transformers) | Provides a starting point for transfer learning, significantly reducing the data and computation required to achieve good performance [63]. |
| Data Augmentation Libraries (Albumentations, Imgaug) | Systematically generates variations of training images to increase dataset size and diversity, combating overfitting [81]. |
| Optimization Frameworks (TensorRT, ONNX Runtime) | Converts and optimizes trained models for fast, efficient inference on various hardware platforms, including edge devices [78] [63]. |
| Visualization Tools (Grad-CAM for CNNs, Attention Rollout for ViTs) | Generates heatmaps to visualize which parts of an input image the model focused on for its prediction, aiding in interpretability and trust [63] [82]. |
Troubleshooting Common Experimental Issues
Problem 1: Poor Performance with Limited Data
- Symptoms: High training accuracy but low validation/test accuracy (overfitting), or poor performance across all metrics.
- Solutions:
- Leverage Transfer Learning: Start with a model pre-trained on a large, general-purpose image dataset (like ImageNet). Fine-tune it on your specialized sperm image dataset. This is the most effective strategy for small datasets [63].
- Aggressive Data Augmentation: Create a robust augmentation pipeline tailored to microscopy images. Be cautious of augmentations that may destroy biological features (e.g., extreme crops that remove parts of the sperm).
- Use a Simpler Model: If you are using a very large model (e.g., ViT-Huge), switch to a smaller one (e.g., DeiT-Tiny or a compact CNN like MobileNet) which is less prone to overfitting with limited data.
- Prioritize CNNs: As a baseline, use a CNN architecture which is inherently more data-efficient [75].
Problem 2: Slow Inference Time on Clinical Hardware
- Symptoms: Model predictions are too slow for integration into a real-time or clinical workflow.
- Solutions:
- Model Quantization: Convert your model's weights from 32-bit floating-point numbers to 8-bit integers. This reduces the model size and increases inference speed with a minimal, often acceptable, drop in accuracy [78].
- Model Pruning: Identify and remove redundant neurons or attention heads that contribute little to the model's output. This creates a sparser, faster model [78].
- Architecture Switch: If ViT inference remains too slow after optimization, consider switching to a highly optimized CNN like EfficientNet or a hybrid model like ConvNeXt, which are designed for efficiency [75] [63].
- Use an Acceleration Framework: Deploy your model using frameworks like NVIDIA TensorRT or OpenVINO, which are designed to maximize performance on specific hardware (GPUs, CPUs) [78].
The following decision guide can help you diagnose and resolve common performance issues.
Frequently Asked Questions
Q1: What are the core strengths of BEiT and Cascade R-CNN in the context of sperm image analysis?
A: BEiT (Bidirectional Encoder representation from Image Transformers) excels at learning powerful, generalizable image representations through self-supervised pre-training. It learns to understand image context by predicting visual tokens from masked patches, similar to how BERT handles text [83] [84]. This is particularly valuable for sperm image analysis where high-quality, labeled datasets are scarce [7] [9]. Cascade R-CNN is a multi-stage object detection framework designed for high localization accuracy. It sequentially refines detection boxes with increasing Intersection over Union (IoU) thresholds, reducing false positives and precisely locating objects like sperm cells in images [85] [86].
Q2: During inference, my Cascade R-CNN model detects fewer sperm cells than expected. What could be wrong?
A: This is a known characteristic of the architecture. While Cascade R-CNN is highly precise, its progressive filtering can sometimes be overly selective. First, verify your confidence threshold; a value that is too high will discard good detections. Second, ensure the IoU thresholds used during training are appropriate for your data; overly high thresholds can overfit to "easy" examples. Finally, check for a domain shift between your training data (e.g., COCO) and your sperm images. Fine-tuning on a domain-specific sperm dataset is often essential for robust performance [87] [86].
Q3: The training of my BEiT model is very slow. How can I improve its efficiency?
A: You can leverage PyTorch's native Scaled Dot Product Attention (SDPA). By setting attn_implementation="sdpa" when loading the model, you can achieve significant speedups and memory savings. For instance, one benchmark showed a 32% training speedup and a 56% reduction in GPU memory usage during training, with even greater benefits during inference for larger batch sizes [83]. Additionally, using mixed precision (e.g., torch.float16) can further enhance performance.
Q4: My model performs well on the training set but poorly on validation sperm images. How can I address this overfitting?
A: This is a common challenge in medical imaging due to limited data [9].
- For BEiT: Leverage its pre-trained weights on large datasets like ImageNet-22K. Use the pre-trained model as a feature extractor or fine-tune it with a very low learning rate. This transfers general knowledge of visual concepts to your specific task [83] [84].
- For Cascade R-CNN: Implement strong data augmentation (random flipping, rotation, color jitter) to simulate more varied sperm images. The cascade structure itself helps mitigate overfitting by providing a positive set of examples of equivalent size at each stage [85]. Also, ensure your dataset has enough examples of rare sperm morphological defects to handle class imbalance [5].
Experimental Protocols and Data
Quantitative Performance Comparison
The following table summarizes key quantitative findings from experiments and benchmarks on public datasets.
Table 1: Performance Benchmark of Models on Object Detection and Classification Tasks
| Model | Dataset | Key Metric | Result | Notes |
|---|---|---|---|---|
| Cascade R-CNN (DetNet59 backbone) [88] | PASCAL VOC 2007 | mAP (Mean Average Precision) | 48.9% | Outperformed its non-cascade counterpart (44.8% mAP) on the same dataset. |
| BEiT-Base (Fine-tuned) [83] | ImageNet-1K | Top-1 Accuracy | 83.2% | Surpassed supervised from-scratch training of DeiT (81.8%) with the same setup. |
| Hybrid MLFFN–ACO Framework [5] | UCI Fertility Dataset | Classification Accuracy | 99% | A hybrid neural network with Ant Colony Optimization for male fertility assessment. |
| Deep Learning CNN [7] | SMD/MSS Sperm Dataset | Classification Accuracy | 55% - 92% | Accuracy range highlights the impact of specific experimental setups and data splits. |
Table 2: BEiT Inference Speed and Memory Benchmark (Using SDPA) [83]
| Image Batch Size | Inference Speed (s/iter) | Speedup vs Eager | Memory Saved vs Eager |
|---|---|---|---|
| 1 | 0.011 | 1.05x | 0.24% |
| 4 | 0.011 | 1.18x | 3.23% |
| 16 | 0.035 | 1.30x | 10.08% |
| 32 | 0.066 | 1.33x | 17.04% |
Detailed Methodologies for Key Experiments
Protocol 1: Implementing Cascade R-CNN for Object Detection
This protocol is based on the implementation for PASCAL VOC [88].
- Backbone Network: Select a backbone feature extractor like ResNet or DetNet. DetNet59 has been noted to be faster and perform better than FPN-ResNet101 in some implementations [88].
- Region Proposal Network (RPN): The RPN generates initial candidate object regions (proposals) from the feature maps. These are the first-stage, low-precision detections.
- Cascade Detection Heads: Feed the proposals through a sequence of detection heads (typically 3 or more). Each head consists of a classifier and a bounding box regressor.
- The first head is trained with a standard IoU threshold (e.g., 0.5).
- The second head is trained with a higher IoU threshold (e.g., 0.6), using the refined bounding boxes from the first stage as its input.
- The third head uses an even higher threshold (e.g., 0.7), further refining the outputs from the second stage.
- Training: The stages are trained sequentially to avoid overfitting. The loss for each stage is a weighted sum of classification and regression loss:
L(x_t, g) = L_cls(h_t(x_t), y_t) + λ L_loc(f_t(x_t, b_t), g), wherey_tis the label for the stage's IoU threshold [85] [86]. - Inference: During inference, the same cascade procedure is applied. The RPN proposals are sequentially refined by each detection head, with higher-quality detectors only processing the higher-quality hypotheses passed from the previous stage [85].
Protocol 2: Fine-Tuning BEiT for Image Classification
This protocol is based on the BEiT documentation and paper [83] [84].
- Pre-processing: Use the
BeitImageProcessorto prepare images. This typically involves resizing (e.g., to 224x224 or 384x384), center cropping, and normalization using the model's predefined mean and standard deviation [89]. - Model Loading: Load a pre-trained BEiT model (e.g.,
microsoft/beit-base-patch16-224). For faster training and inference, use the SDPA implementation:BeitForImageClassification.from_pretrained("microsoft/beit-base-patch16-224", attn_implementation="sdpa")[83]. - Fine-Tuning: Replace the final classification layer (task head) to match the number of classes in your sperm morphology dataset (e.g., normal, tapered head, coiled tail, etc.). Train the entire model end-to-end with a low learning rate. BEiT's use of relative position biases is beneficial for fine-tuning [83] [84].
- Leveraging Masked Image Modeling (MIM): For advanced use cases, you can further pre-train BEiT on unlabeled sperm images using its MIM objective. The model learns to recover visual tokens from masked image patches, improving its representation of domain-specific features before fine-tuning on the labeled classification task [84].
Workflow and Materials
Experimental Workflow Diagram
The following diagram illustrates a potential integrated workflow for sperm morphology analysis using BEiT and Cascade R-CNN.
The Scientist's Toolkit: Research Reagent Solutions
Table 3: Essential Materials and Computational Tools for Sperm Image Analysis Experiments
| Item / Solution | Function / Description | Example / Note |
|---|---|---|
| SMD/MSS Dataset [7] | A public dataset of sperm images with morphological classifications based on the modified David classification, including head, midpiece, and tail defects. | Contains 1000+ images; useful for benchmarking but may require augmentation for robust training [7]. |
| SVIA Dataset [9] | A larger, more recent dataset containing 125,000 annotated instances for detection, 26,000 segmentation masks, and 125,880 images for classification. | Aims to address limitations of previous datasets with more samples and richer annotations [9]. |
| RAL Diagnostics Staining Kit [7] | Standard staining solution used to prepare semen smears for microscopic imaging, enhancing sperm cell contrast and structure visibility. | Critical for consistent image acquisition in clinical studies [7]. |
| MMC CASA System [7] | (Computer-Assisted Semen Analysis) An integrated system with a microscope and camera for automated acquisition and storage of sperm images. | Facilitates high-throughput data collection under standardized conditions [7]. |
| Transformers Library [83] | A comprehensive Python library providing pre-trained models and easy-to-use interfaces for loading and fine-tuning BEiT and many other models. | Includes BeitFeatureExtractor and BeitForImageClassification for streamlined workflow [89]. |
| DetNet / ResNet Backbone [88] | Convolutional Neural Network architectures that serve as the feature extraction backbone for object detection models like Cascade R-CNN. | DetNet59 has been used effectively in Cascade R-CNN implementations for object detection [88]. |
Conclusion
Optimizing sperm image pre-processing is not merely a preliminary step but a cornerstone for developing reliable, automated male fertility diagnostics. This synthesis demonstrates that a methodical approach—encompassing robust data acquisition, advanced augmentation, and tailored noise reduction—directly enables the high performance of modern AI models like Vision Transformers. The move towards end-to-end frameworks that minimize manual intervention, validated through rigorous benchmarking, promises to standardize sperm morphology analysis, thereby enhancing objectivity and reproducibility in clinical settings. Future directions should focus on creating larger, more diverse public datasets, developing standardized pre-processing protocols, and exploring the integration of these optimized pipelines into point-of-care diagnostic devices to democratize access to high-quality fertility testing.
References
- 1. Limitations of Semen Analysis as a Test of Male Fertility ... [https://pmc.ncbi.nlm.nih.gov/articles/PMC4254491/]
- 2. Multistage Optimization Using a Modified Gaussian Mixture ... [https://pmc.ncbi.nlm.nih.gov/articles/PMC8421170/]
- 3. Guideline #3 - Making Simple Adjustments [https://ori.hhs.gov/education/products/RIandImages/guidelines/guideline_3.html]
- 4. Image integrity and standards | Nature Portfolio [https://www.nature.com/nature-portfolio/editorial-policies/image-integrity]
- 5. Enhancing the precision of male fertility diagnostics ... [https://www.nature.com/articles/s41598-025-25052-x]
- 6. sciencedirect.com/science/article/pii/S2667102623000347?dgcid=rss... [https://www.sciencedirect.com/science/article/pii/S2667102623000347?dgcid=rss_sd_all]
- 7. Deep-learning based model for sperm morphology ... [https://pmc.ncbi.nlm.nih.gov/articles/PMC12599357/]
- 8. Impact of the presence of debris on semen analysis using ... [https://internationalbiochemistry.com/jvi.aspx?un=IJMB-97658&volume=4&issue=3/1000]
- 9. Deep learning-based approach for sperm morphology analysis [https://bmcurol.biomedcentral.com/articles/10.1186/s12894-025-01946-w]
- 10. morphology assessment according to... - Biochemia Medica Sperm [https://www.biochemia-medica.com/en/journal/19/1/10.11613/BM.2009.009]
- 11. A Yolo-v7 Based Approach for Sperm and Noise ... | SpringerLink [https://link.springer.com/chapter/10.1007/978-981-96-5318-8_44]
- 12. Simple and rapid microfluidic device for processing raw ... [https://www.nature.com/articles/s41598-025-09884-1]
- 13. Increased reproductive outcomes after optimized sperm ... [https://pmc.ncbi.nlm.nih.gov/articles/PMC12107353/]
- 14. A Data-Centric Approach to improve performance of deep ... [https://www.nature.com/articles/s41598-024-73643-x]
- 15. How does data quality affect deep learning performance? [https://milvus.io/ai-quick-reference/how-does-data-quality-affect-deep-learning-performance]
- 16. Ensuring Data Quality in Machine Learning: Best Practices ... [https://medium.com/@khotijahs1/ensuring-data-quality-in-machine-learning-best-practices-and-python-code-example-809f46cf5bcb]
- 17. Best Practices for Data Quality in Machine Learning [https://www.anomalo.com/blog/data-quality-in-machine-learning-best-practices-and-techniques/]
- 18. Image Quality Factors (Key Performance Indicators) [https://www.imatest.com/docs/iqfactors/]
- 19. Sperm Morphology Image Data Set (SMIDS) [https://data.mendeley.com/datasets/6xvdhc9fyb]
- 20. 3D+t Multifocal Imaging Dataset of Human Sperm [https://www.nature.com/articles/s41597-025-05177-4]
- 21. Artificial intelligence model for the assessment of unstained ... [https://pmc.ncbi.nlm.nih.gov/articles/PMC12060770/]
- 22. A Stained-Free Sperm Morphology Measurement Method ... [https://www.mdpi.com/1424-8220/25/3/592]
- 23. A three stage framework for abnormality detection in sperm ... [https://www.sciencedirect.com/science/article/abs/pii/S1746809424008851]
- 24. CS3: Cascade SAM for Sperm Segmentation [https://arxiv.org/html/2407.03772v2]
- 25. Deep learning methods for noisy sperm image ... [https://www.sciencedirect.com/science/article/pii/S2667102623000347]
- 26. CS3: Cascade SAM for Sperm Segmentation [https://arxiv.org/html/2407.03772v1]
- 27. OpenCASA: A new open-source and scalable tool for sperm ... [https://pmc.ncbi.nlm.nih.gov/articles/PMC6355034/]
- 28. hansenjn/SpermQ [https://github.com/hansenjn/SpermQ]
- 29. Deep feature engineering for accurate sperm morphology ... [https://journals.plos.org/plosone/article?id=10.1371/journal.pone.0330914]
- 30. What is Data Augmentation? [https://aws.amazon.com/what-is/data-augmentation/]
- 31. Image Augmentation Techniques to Boost Your CV Model ... [https://machinelearningmastery.com/image-augmentation-techniques-to-boost-your-cv-model-performance/]
- 32. 12+ Data Augmentation Techniques for Data-Efficient ML [https://research.aimultiple.com/data-augmentation-techniques/]
- 33. Deep learning-based approach for sperm morphology analysis [https://pmc.ncbi.nlm.nih.gov/articles/PMC12538767/]
- 34. Androgen: Open-Source Synthetic Data Generation for ... [https://papers.ssrn.com/sol3/papers.cfm?abstract_id=5195581]
- 35. Synthetic Data for AI & 3D Simulation Workflows | Use Case [https://www.nvidia.com/en-us/use-cases/synthetic-data-physical-ai/]
- 36. Using Game Engines To Create Synthetic Data [https://sbanimation.com/using-game-engines-to-create-synthetic-data/]
- 37. Using Game Engines and Machine Learning to Create ... [https://arxiv.org/html/2404.11461v1]
- 38. Mastering Image Preprocessing: Optimizing Your Visual AI ... [https://voxel51.com/blog/image-preprocessing-best-practices-to-optimize-your-ai-workflows]
- 39. The Complete Guide to Image Preprocessing Techniques ... [https://medium.com/@maahip1304/the-complete-guide-to-image-preprocessing-techniques-in-python-dca30804550c]
- 40. Best Practices for Image Preprocessing [https://keylabs.ai/blog/best-practices-for-image-preprocessing-in-image-classification/]
- 41. Leveraging synthetic imagery and YOLOv8 for a novel ... [https://www.sciencedirect.com/org/science/article/pii/S2635099825000123]
- 42. Deep Learning Models for Multi-Part Morphological ... [https://pmc.ncbi.nlm.nih.gov/articles/PMC12115634/]
- 43. A modified U-Net to detect real sperms in videos of human ... [https://www.frontiersin.org/journals/artificial-intelligence/articles/10.3389/frai.2024.1376546/full]
- 44. IMSI—Guidelines for Sperm Quality Assessment - PMC [https://pmc.ncbi.nlm.nih.gov/articles/PMC8774575/]
- 45. Segmentation of sperm images [https://bio-protocol.org/exchange/minidetail?id=2598699&type=30]
- 46. A Simple Confocal Microscopy-based Method for ... [https://pmc.ncbi.nlm.nih.gov/articles/PMC5651689/]
- 47. Design and Implementation of a Deep Learning System to ... [https://pmc.ncbi.nlm.nih.gov/articles/PMC12567593/]
- 48. Imbalanced Data - an overview | ScienceDirect Topics [https://www.sciencedirect.com/topics/computer-science/imbalanced-data]
- 49. Class Imbalance in Machine Learning — The Complete ... [https://medium.com/@dewasheesh.rana/class-imbalance-in-machine-learning-the-complete-2025-guide-with-code-math-visuals-best-731edc76fd1c]
- 50. Handling Imbalanced Data to Improve Precision [https://keylabs.ai/blog/handling-imbalanced-data-to-improve-precision/]
- 51. Resampling approaches to handle class imbalance: a review ... [https://journalofbigdata.springeropen.com/articles/10.1186/s40537-025-01119-4]
- 52. Should You Use Imbalanced-Learn in 2025? [https://www.blog.trainindata.com/should-you-use-imbalanced-learn-in-2025/]
- 53. A Deep Learning-Based Solution to the Class Imbalance ... [https://www.mdpi.com/2072-4292/17/11/1845]
- 54. Correcting for the effects of class imbalance improves ... [https://www.sciencedirect.com/science/article/abs/pii/S030438002300145X]
- 55. Smartphone-based colorimetric detection platform using ... [https://www.sciencedirect.com/science/article/abs/pii/S138614252400516X]
- 56. RGB color correction and gamut limitations in smartphone ... [https://pmc.ncbi.nlm.nih.gov/articles/PMC12528221/]
- 57. Smartphone-Compatible Colorimetric Detection of CA19-9 ... [https://pmc.ncbi.nlm.nih.gov/articles/PMC12384475/]
- 58. Exploring Strategies to Mitigate the Lightness Effect on the ... [https://www.mdpi.com/2304-8158/12/18/3436]
- 59. What Causes Blooming Artifacts in Microscopic Imaging ... [https://www.e-consystems.com/blog/camera/applications/what-causes-blooming-artifacts-in-microscopic-imaging-and-how-to-prevent-them/]
- 60. Evaluation of an artificial intelligence system for bull sperm ... [https://www.sciencedirect.com/science/article/pii/S0093691X25002304]
- 61. An assessment tool for computer-assisted semen analysis ... [https://www.nature.com/articles/s41598-022-20943-9]
- 62. What Is Image Preprocessing and Augmentation? [https://blog.roboflow.com/why-preprocess-augment/]
- 63. Vision Transformers Vs CNNs: Who Leads Vision In 2025? [https://aicompetence.org/vision-transformers-vs-cnns/]
- 64. CNNs vs Vision Transformers in 2025: Who Wins the ... [https://medium.com/@gauravpatil2516/cnns-vs-vision-transformers-in-2025-who-wins-the-computer-vision-war-bb1262063980]
- 65. A Comparative Study of Vision Transformers and CNNs ... [https://arxiv.org/html/2510.04794v1]
- 66. Design and Implementation of a Deep Learning System to ... [https://www.mdpi.com/2306-7381/12/10/1015]
- 67. Assessing Inter-Annotator Agreement for Medical Image ... [https://pmc.ncbi.nlm.nih.gov/articles/PMC10062409/]
- 68. Comparative study of Sperm Motility Analysis System and ... [https://pmc.ncbi.nlm.nih.gov/articles/PMC5891812/]
- 69. Mean Average Precision (mAP) Explained: Everything You ... [https://www.v7labs.com/blog/mean-average-precision]
- 70. Mean Average Precision (mAP): A Complete Guide [https://kili-technology.com/data-labeling/machine-learning/mean-average-precision-map-a-complete-guide]
- 71. Deep Learning-Based Precision Analysis for Acrosome ... [https://pmc.ncbi.nlm.nih.gov/articles/PMC10451478/]
- 72. SCA® Tutorial of the SCA® CASA System - HT CASA [https://www.micropticsl.com/documents-support/sca-tutorial/]
- 73. Advanced Multi-Level Ensemble Learning Approaches for ... [https://pmc.ncbi.nlm.nih.gov/articles/PMC12192502/]
- 74. Interpretation and Visualization Techniques for Deep Learning ... [https://pmc.ncbi.nlm.nih.gov/articles/PMC8236074/]
- 75. CNN vs Vision Transformer (ViT): Which Wins in 2025? [https://hiya31.medium.com/cnn-vs-vision-transformer-vit-which-wins-in-2025-e1cb2dfcb903]
- 76. Vision Transformers Explained - by Nir Diamant - DiamantAI [https://diamantai.substack.com/p/vision-transformers-explained]
- 77. [2507.21156] Comparative Analysis of Vision Transformers ... [https://arxiv.org/abs/2507.21156]
- 78. Vision transformers on the edge: A comprehensive survey ... [https://www.sciencedirect.com/science/article/abs/pii/S0925231225010896]
- 79. Your 2025 Guide to the Top 6 Computer Vision Problems [https://opencv.org/blog/computer-vision-problems/]
- 80. CNN Optimization: Strategies for Enhancing Deep ... [https://www.netguru.com/blog/cnn-optimization]
- 81. Data Preprocessing Techniques for Annotated Computer ... [https://docs.ultralytics.com/guides/preprocessing_annotated_data/]
- 82. The Utility of Applying Various Image Preprocessing ... [https://pmc.ncbi.nlm.nih.gov/articles/PMC7232029/]
- 83. BEiT [https://huggingface.co/docs/transformers/en/model_doc/beit]
- 84. BEiT: BERT Pre-Training of Image Transformers [https://sh-tsang.medium.com/review-beit-bert-pre-training-of-image-transformers-c14a7ef7e295]
- 85. - Cascade : Delving into High Quality Object Detection R CNN [https://arxiv.org/abs/1712.00726]
- 86. Cascade R-CNN- Explained [https://www.geeksforgeeks.org/deep-learning/cascade-r-cnn-explained/]
- 87. Comparing YOLOv8x vs Cascade RCNN on human detection [https://github.com/ultralytics/ultralytics/issues/3248]
- 88. GitHub - ruoqianguo/ cascade -rcnn_Pytorch: An implementation of... [https://github.com/ruoqianguo/cascade-rcnn_Pytorch]
- 89. BEiT — transformers 4.11.3 documentation [https://huggingface.co/transformers/v4.11.3/model_doc/beit.html]