SCSA Protocol Mastery: Standardized Methods for Sperm DNA Fragmentation Analysis in Clinical and Research Settings
This comprehensive guide details the Sperm Chromatin Structure Assay (SCSA®), a flow cytometric technique recognized for its precision in assessing sperm DNA fragmentation and chromatin maturity.
SCSA Protocol Mastery: Standardized Methods for Sperm DNA Fragmentation Analysis in Clinical and Research Settings
Abstract
This comprehensive guide details the Sperm Chromatin Structure Assay (SCSA®), a flow cytometric technique recognized for its precision in assessing sperm DNA fragmentation and chromatin maturity. Tailored for researchers and drug development professionals, the article covers the foundational principles of sperm chromatin organization, provides a step-by-step walkthrough of the federally registered SCSA protocol, and addresses common troubleshooting scenarios. It further offers a critical comparison with other DNA fragmentation tests like TUNEL and SCD, validating SCSA's role in clinical diagnostics and toxicology studies. The synthesis of current research and standardized methodologies aims to equip scientists with the knowledge to implement this assay reliably for male fertility assessment, ART outcome prediction, and reproductive toxicology.
Understanding Sperm Chromatin: The Biological Basis of the SCSA
The packaging of the male haploid genome within the sperm nucleus represents one of the most extreme chromatin remodeling processes in biology. During spermiogenesis, the final phase of spermatogenesis, the canonical nucleosome-based chromatin structure of haploid round spermatids is almost entirely replaced by a protamine-based architecture, facilitating an unparalleled level of DNA compaction [1] [2]. This evolutionary conserved process results in a chromatin structure that is at least six times more compact than that of mitotic chromosomes [3]. The biological rationale for this extensive repackaging is multifunctional: it protects the paternal genome from external mutagens during transit, reduces the physical volume of the sperm head to enable motility, and is essential for the correct, sequential decondensation and reprogramming of the paternal genome post-fertilization [2]. The integrity of this architectural marvel is now recognized as a critical determinant of male fertility, with defects in chromatin structure directly linked to subfertility and poor outcomes in assisted reproductive technologies (ART) [4] [5] [6]. This application note details the molecular basis of sperm chromatin architecture and provides standardized protocols for its assessment via the Sperm Chromatin Structure Assay (SCSA), a cornerstone of modern andrological diagnosis.
Molecular Architecture of Sperm Chromatin
The Histone-to-Protamine Transition: A Stepwise Remodeling
The transformation from a nucleosomal to a nucleo-protamine structure is a highly coordinated, multi-step process. It is initiated in elongating spermatids and involves the sequential replacement of canonical histones [2].
- Incorporation of Histone Variants and Post-Translational Modifications (PTMs): The process begins with the incorporation of testis-specific histone variants (e.g., H3T, TH2B, H2AL1/2), which inherently destabilize nucleosome structure by altering histone-DNA binding affinity [2]. This is concomitant with an array of histone PTMs, most notably hyperacetylation of histone H4, which further loosens histone-DNA interactions by inhibiting chromatin fiber folding [2]. The NuA4/TIP60 and GCN5 histone acetyltransferase complexes are key facilitators of this step, and their loss of function leads to aberrant spermatid elongation and impaired fertility [2].
- Transition Protein Incorporation: The destabilized nucleosomes are subsequently replaced by transition proteins (TNPs TNPs). These small, basic proteins are thought to act as molecular placeholders, facilitating the removal of histones and preparing the DNA for the final incorporation of protamines [1] [2].
- Protamine-DNA Complex Formation: The final stage involves the displacement of TNPs by protamines (PRM1 and PRM2 in humans). These small, arginine-rich proteins package the DNA into toroidal (doughnut-shaped) structures through tight neutralization of the DNA phosphate backbone [3] [2]. This organization achieves maximal compaction, rendering the paternal genome transcriptionally inert and highly resistant to external stress.
The following diagram illustrates this complex molecular transition.
Residual Histones and Their Functional Significance
Despite the efficiency of the replacement process, approximately 5-15% of the human sperm genome remains associated with histones [1] [7]. Early research suggested these histones were randomly retained, but advanced mapping techniques have revealed a non-random, strategic distribution. Studies indicate that retained nucleosomes are enriched at specific genomic loci, including:
- Promoter regions of genes critical for early embryonic development [1] [7].
- Imprinted gene clusters [1].
- Genes encoding developmental transcription and signaling factors [1].
This specific retention pattern strongly suggests a role for the sperm epigenome in epigenetic inheritance and the regulation of gene expression during early embryogenesis [1] [2] [7]. It is crucial to note that the method of sperm preparation can significantly impact the analysis of histone retention. The standard "swim-up" technique often yields a population containing 6-10% histone replacement-uncompleted sperm (HRunCS), which retain a high histone content and can confound results. The use of purified histone replacement-completed sperm (HRCS), obtained via methods like Percoll gradient centrifugation, is therefore recommended for precise epigenetic mapping studies [7].
The Sperm Chromatin Structure Assay (SCSA): A Gold-Standard Protocol
The SCSA is a flow cytometry-based assay that provides a robust, quantitative measure of sperm DNA integrity and chromatin structure. Its principle relies on the metachromatic properties of acridine orange (AO), which fluoresces green when intercalated into double-stranded DNA (dsDNA) and red when associated with single-stranded DNA (ssDNA) [6] [8].
Principle of the SCSA
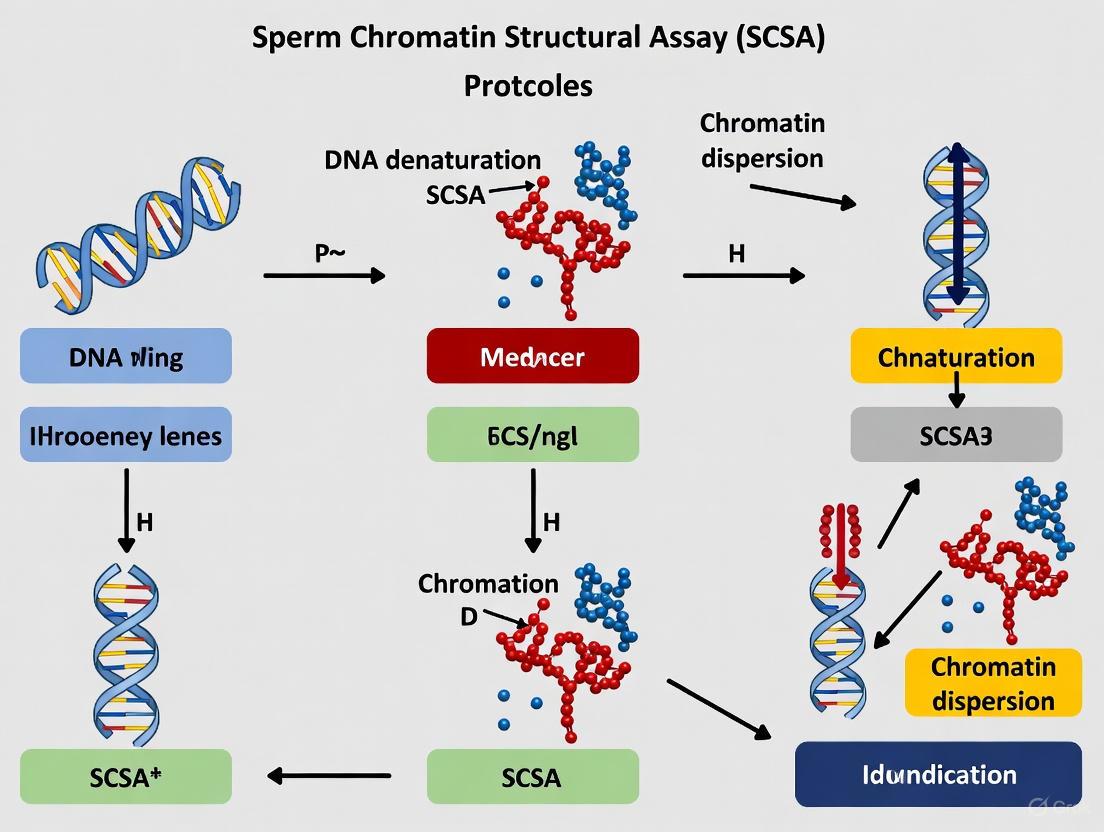
The assay involves a brief, low-pH treatment that denatures DNA at sites of inherent DNA strand breaks or in regions with defective chromatin packaging. Sperm with intact, protamine-compacted DNA resist denaturation and stain green, while sperm with fragmented DNA or abnormal chromatin structure undergo partial denaturation and stain red [9] [6] [8]. The workflow is as follows:
Detailed SCSA Protocol
Basic Protocol 1: Sperm Chromatin Structure Assay (SCSA) [8]
Reagents:
- TNE Buffer: 0.01 M Tris-HCl, 0.15 M NaCl, 1 mM EDTA, pH 7.4.
- Acid Denaturation Solution: 0.1% Triton X-100, 0.15 M NaCl, 0.08 N HCl, pH 1.20.
- Acridine Orange (AO) Staining Solution: 6 µg/mL AO (Molecular Probes, Eugene, OR, USA) in 0.1 M citric acid, 0.2 M Na₂HPO₄, 1 mM EDTA, 0.15 M NaCl, pH 6.0. Filter through a 0.22 µm filter and store in the dark.
Equipment:
- Flow cytometer equipped with a 488 nm argon laser and filters for green (515-530 nm BP) and red (>630 nm LP) fluorescence.
- Water bath (37°C).
- Centrifuge.
Procedure:
- Sample Preparation: Dilute a raw semen sample (fresh or properly frozen/thawed) in TNE buffer to a final concentration of 1-2 x 10⁶ sperm/mL.
- Acid Denaturation: Add 400 µL of the acid denaturation solution to 200 µL of the diluted sperm sample in a flow cytometry tube. Incubate for exactly 30 seconds at room temperature.
- Staining: Within the 30-second denaturation window, add 1.2 mL of the AO staining solution. Initiate flow cytometric measurement immediately after staining.
- Flow Cytometry: Analyze the sample on the flow cytometer. Ensure instrument settings are optimized and standardized using reference samples [8]. Collect data for a minimum of 5,000 events per sample.
Basic Protocol 2: SCSA Data Analysis [6] [8]
Two primary parameters are derived from the SCSA:
- DNA Fragmentation Index (%DFI): The percentage of sperm in the sample with significant DNA fragmentation (denatured DNA, red fluorescence). This is calculated from a frequency histogram of the ratio of red to total fluorescence (αt).
- High DNA Stainability (%HDS): The percentage of sperm with abnormally high green fluorescence. This parameter indicates sperm with incomplete chromatin condensation, typically due to retained histones and a deficit of protamines, reflecting immature sperm [9] [7] [8].
Table 1: Clinical Thresholds and Interpretation of SCSA Parameters in Human Fertility [4] [8]
| Parameter | Definition | Clinical Threshold | Biological & Clinical Significance |
|---|---|---|---|
| %DFI | Percentage of sperm with denatured DNA (DNA strand breaks) | ≥ 25% | Predicts significantly reduced pregnancy rates for natural conception and IUI. ICSI may be recommended. |
| %HDS | Percentage of sperm with immature chromatin (high histone retention) | ≥ 25% | Suggests defective spermiogenesis; may lead to early embryonic death due to abnormal chromatin structure and gene readout. |
Quantitative Data and Clinical Correlations
The SCSA has been extensively validated in clinical and toxicological studies. Its parameters provide powerful prognostic information that complements standard semen analysis.
Table 2: Impact of Clinical Interventions on Sperm DNA Fragmentation Index (DFI) [4]
| Clinical Scenario | Pre-Intervention DFI (Mean ± SD) | Post-Intervention DFI (Mean ± SD) | Statistical Significance (p-value) | Clinical Outcome |
|---|---|---|---|---|
| Unilateral Microsurgical Varicocelectomy (n=50) | 20.3% ± 7.5 | 16.5% ± 6.1 | < 0.001 | Pregnancy rate: 36.0% |
| Bilateral Microsurgical Varicocelectomy (n=50) | 24.1% ± 7.0 | 18.5% ± 6.0 | < 0.001 | Pregnancy rate: 58.0% (p=0.04 vs. unilateral) |
Large-scale cohort studies have firmly established age as a significant factor influencing sperm DNA integrity. Research involving over 10,000 patients demonstrated a linear increase in SDF with advancing male age, as measured by both SCSA and TUNEL assays. In contrast, conventional sperm parameters (count, morphology) showed little change with age, underscoring the unique value of chromatin assessment as a sensitive biomarker of male reproductive aging [5].
The Scientist's Toolkit: Research Reagent Solutions
Table 3: Essential Reagents and Kits for Sperm Chromatin Analysis
| Reagent / Kit | Function / Application | Key Features & Notes |
|---|---|---|
| Acridine Orange (AO) | Metachromatic dye for SCSA; distinguishes dsDNA (green) from ssDNA (red). | Requires precise pH control (6.0) for staining solution. Light-sensitive [8]. |
| TUNEL Assay Kit | Directly labels 3'-OH ends of DNA breaks with fluorescent dUTP. | Flow cytometry or microscopy. Systematically lower SDF values than SCSA; requires decondensation step for full access to DNA in protamine-packed sperm [5] [10]. |
| Protamine Binding Dyes (e.g., CMA₃) | Indirectly assesses protamine deficiency by competitive binding to DNA. | High CMA₃ staining correlates with high HDS, indicating immature sperm chromatin [10]. |
| Percoll Gradient | Density gradient medium for purification of mature sperm (HRCS). | Critical for obtaining pure populations of histone replacement-completed sperm for epigenetic studies, reducing contamination by HRunCS [7]. |
| Antibodies (Histone PTMs) | Chromatin Immunoprecipitation (ChIP) for mapping sperm epigenome. | Used to identify specific genomic locations of retained histones (e.g., at developmental gene promoters) [1] [7]. |
Comparative Analysis of Sperm DNA Fragmentation Assays
While the SCSA is a well-standardized and powerful tool, several other assays are used in the field. Understanding their correlations and differences is vital for data interpretation.
Table 4: Comparison of Primary Sperm DNA Fragmentation Assays [6] [10]
| Assay | Principle | Methodology | Advantages | Disadvantages |
|---|---|---|---|---|
| SCSA | Acid-induced DNA denaturation at break sites, AO staining. | Flow Cytometry | High statistical robustness (5000+ sperm), standardized protocol, provides both %DFI and %HDS. | Requires flow cytometer. |
| TUNEL | Enzymatic labeling of DNA strand breaks. | Flow Cytometry / Microscopy | Direct measure of DNA breaks. | Less sensitive than SCSA; requires protocol optimization for chromatin decondensation [5] [10]. |
| Comet Assay | Electrophoresis of single cells; damaged DNA migrates forming a "comet tail". | Microscopy | Can differentiate single vs. double-strand breaks (alkaline vs. neutral version). | Low throughput (50-200 sperm), subjective analysis, lower statistical power [6]. |
| SCD (Halo Test) | Acid denaturation and removal of nuclear proteins; sperm with intact DNA produce a halo. | Microscopy | Simple, no need for specialized equipment beyond a microscope. | Low throughput, indirect measure, results can be subjective [6] [10]. |
Studies show that direct methods (TUNEL, Comet) correlate well with each other regarding the extent of DNA damage. Similarly, indirect methods (SCSA, SCD) also show inter-correlation. However, correlations between direct and indirect methods are not always consistent, highlighting that they measure related but distinct facets of sperm chromatin damage [10].
The intricate architecture of sperm chromatin, transitioning from a nucleosomal to a protamine-based structure, is fundamental to male fertility. The SCSA has emerged as a preeminent protocol for probing this architecture, offering reproducible and clinically significant metrics—%DFI and %HDS—that predict reproductive success beyond conventional semen parameters. As research continues to unravel the functional significance of the strategically retained histone landscape in sperm, the integration of robust chromatin assessment protocols like the SCSA into both clinical andrology and fundamental research will remain indispensable for diagnosing male factor infertility and advancing our understanding of epigenetic inheritance.
Sperm DNA integrity is a critical parameter of male fertility, as sperm DNA fragmentation (SDF) has been significantly correlated with impaired fertilization, poor embryo development, and increased miscarriage rates [11] [12]. While conventional semen analysis assesses basic parameters like concentration, motility, and morphology, it fails to provide information about the integrity of the sperm's genetic material [11] [13]. Up to 30% of infertile men exhibit normal standard semen parameters, indicating that SDF can be a hidden factor behind unexplained infertility [14]. Sperm DNA fragmentation arises from various intrinsic and extrinsic factors that disrupt the highly specialized process of sperm chromatin packaging and protection [11] [15]. This application note, framed within broader research on Sperm Chromatin Structure Assay (SCSA) protocols, delineates the etiology of sperm DNA damage and provides detailed methodologies for its assessment in both clinical and research settings, catering to the needs of scientists and drug development professionals.
Pathophysiological Mechanisms of Sperm DNA Damage
Sperm chromatin is uniquely structured, with histones replaced by protamines during spermatogenesis to achieve a highly compact, stable state [11] [15]. This compaction protects the DNA during transit. Temporary nicks are essential for this chromatin remodeling; however, failure to repair these nicks is a primary source of DNA fragmentation [11] [15]. The main pathophysiological pathways leading to SDF include:
- Abortive Apoptosis: Dysregulated programmed cell death during spermatogenesis can leave behind sperm with damaged DNA [15].
- Defective Chromatin Maturation: Imperfect replacement of histones by protamines and anomalies in the protamine I/II ratio result in poorly packaged chromatin that is vulnerable to damage [11].
- Oxidative Stress: An imbalance between reactive oxygen species (ROS) and antioxidants is a major cause of SDF [11] [12] [16]. ROS, such as the hydroxyl radical, directly attack sperm DNA, leading to base modifications (e.g., 8-OH-guanine) and subsequent DNA strand breaks [15] [16]. Sources of ROS can be intrinsic (e.g., abnormal sperm with residual cytoplasm, mitochondrial electron leakage) or extrinsic (e.g., leukocytes) [16].
A critical differentiator from somatic cells is that sperm lack functional DNA repair mechanisms post-spermiogenesis, as transcription and translation have ceased [15]. Therefore, any damage incurred during transit through the epididymis or post-ejaculation cannot be fixed by the sperm itself. The oocyte possesses some capacity to repair sperm DNA damage after fertilization, but this capacity is limited and can be overwhelmed by high levels of fragmentation [15].
Etiological Factors of Sperm DNA Fragmentation
The causes of SDF are broadly categorized into intrinsic and extrinsic factors, detailed in the table below.
Table 1: Intrinsic and Extrinsic Factors Contributing to Sperm DNA Fragmentation
| Category | Specific Factor | Proposed Mechanism of Action | Clinical/Research Notes |
|---|---|---|---|
| Intrinsic Factors | Abortive Apoptosis [15] | Faulty programmed cell death during spermatogenesis allows sperm with damaged DNA to be released. | Associated with unexplained infertility and poor embryo quality [15]. |
| Defective Chromatin Packaging [11] [15] | Improper histone-to-protamine replacement and an abnormal protamine I/II ratio lead to inadequately condensed chromatin. | Results in chromatin vulnerable to damage; can be assessed via High DNA Stainability (HDS) in SCSA [8]. | |
| Oxidative Stress (Intrinsic) [16] | ROS production from abnormal sperm with residual cytoplasm or from mitochondrial electron leakage. | Strongly correlated with decreased motility and vitality [16]. | |
| Genetic/Recombination Deficiencies [11] | Errors in meiotic recombination and crossing-over create DNA breaks. | May be linked to increased aneuploidy and de novo mutations, especially with advanced age [5]. | |
| Extrinsic Factors | Oxidative Stress (Extrinsic) [11] [12] [16] | ROS produced by leukocytes (e.g., from infection) or from exposure to environmental toxins. | Leukocytospermia can significantly increase ROS levels measured by chemiluminescence [16]. |
| Varicocele [11] | Associated with increased scrotal temperature and oxidative stress. | A common, correctable cause of male infertility. | |
| Lifestyle Factors [11] [12] | Smoking, excessive alcohol consumption, and obesity contribute to systemic oxidative stress. | Lifestyle modifications are a first-line intervention for reducing SDF [12]. | |
| Advanced Paternal Age [11] [5] | Accumulation of replication errors in spermatogonial stem cells and increased oxidative stress. | SDF shows a linear increase with age, while conventional parameters may remain stable [5]. | |
| Infections & Fever [11] | Inflammation in the male genital tract and febrile illness promote ROS generation. | Can cause a temporary but significant increase in SDF. | |
| Medical Treatments [11] | Chemotherapy (e.g., bleomycin, etoposide) and radiotherapy directly damage DNA. | Sperm cryopreservation prior to treatment is recommended. | |
| Environmental Toxicants [12] | Exposure to pesticides, heavy metals, and other pollutants induces oxidative stress. | An area of active research in environmental health. |
The following diagram illustrates the relationship between these etiological factors and the resulting sperm DNA damage.
Quantitative Assessment of Sperm DNA Fragmentation
Several tests are available to assess SDF, each with distinct principles and methodologies. The table below summarizes the key assays.
Table 2: Common Assays for Measuring Sperm DNA Fragmentation
| Assay Name | Principle of Detection | Measured Parameter(s) | Key Technical/Clinical Characteristics |
|---|---|---|---|
| Sperm Chromatin Structure Assay (SCSA) [9] [6] [8] | Flow cytometric measurement of acid-induced DNA denaturation using acridine orange (AO) fluorescence. | DNA Fragmentation Index (%DFI): Percentage of sperm with denatured DNA.High DNA Stainability (%HDS): Percentage of sperm with immature chromatin. | Considered a gold standard; highly standardized and reproducible; clinical thresholds: DFI >25-30% and HDS >25% indicate poor fertility potential [13] [8]. |
| Terminal Deoxynucleotidyl Transferase dUTP Nick End Labeling (TUNEL) [5] [15] | Enzymatic labeling of DNA strand breaks (single and double) with fluorescent nucleotides. | Percentage of sperm with DNA strand breaks. | Can be analyzed by flow cytometry or microscopy; results are well-correlated with SCSA but often report systematically lower values [5] [15]. |
| Sperm Chromatin Dispersion (SCD) Test [14] [15] | Acid treatment and protein removal followed by staining; sperm with non-fragmented DNA produce a characteristic halo of dispersed DNA loops. | Percentage of sperm without a halo (indicating fragmented DNA). | Also known as HALO test; can be performed with bright-field or fluorescence microscopy; requires image analysis software [15]. |
| Comet Assay [14] [15] | Single-cell gel electrophoresis; sperm with DNA fragments migrate further, forming a "comet tail." | Percentage of DNA in the tail or tail moment. | Can distinguish between single and double-strand breaks depending on pH (alkaline vs. neutral); less standardized [15]. |
Large-scale studies comparing these assays have shown that while results from SCSA and TUNEL are concordant and well-correlated, absolute values can differ due to variations in sensitivity and the specific type of DNA damage detected [5] [15]. SDF levels have been demonstrated to increase linearly with advanced paternal age, a trend that conventional semen parameters (e.g., volume, motility) may not adequately reflect [5].
Core Protocol: Sperm Chromatin Structure Assay (SCSA)
The SCSA is a robust, flow cytometry-based protocol for the simultaneous assessment of sperm DNA integrity (%DFI) and chromatin maturity (%HDS) [8]. The following section provides a detailed application protocol.
The Scientist's Toolkit: Key Research Reagent Solutions
Table 3: Essential Reagents and Materials for the SCSA Protocol
| Item | Specification/Composition | Function in Protocol |
|---|---|---|
| TNE Buffer [8] | 0.01 M Tris-HCl, 0.15 M NaCl, 1 mM EDTA; pH 7.4. | Primary diluent for raw semen; maintains cell stability before analysis. |
| Acid Denaturation Solution [9] [8] | 0.08 M HCl, 0.15 M NaCl, 0.1% Triton X-100; pH 1.20. | Partially denatures DNA at sites of strand breaks; critical for differentiating fragmented from intact DNA. |
| Staining Buffer [8] | 0.037 M Citric Acid, 0.126 M Na₂HPO₄, 0.15 M NaCl, 1 mM EDTA; pH 6.0. | Buffer for preparing the acridine orange staining solution, ensuring optimal dye interaction with DNA. |
| Acridine Orange (AO) Stock Solution [8] | 1 mg/mL pure Acridine Orange in distilled water. | Metachromatic dye that intercalates into double-stranded DNA (green fluorescence) and stacks on single-stranded DNA (red fluorescence). |
| Flow Cytometer [6] [8] | Equipped with a 488 nm argon laser and filters for green (515-530 nm) and red (>630 nm) fluorescence. | Instrument for high-throughput, objective measurement of fluorescence in thousands of individual sperm. |
Detailed SCSA Workflow
The following diagram outlines the key steps in the SCSA protocol, from sample preparation to data analysis.
Procedure:
- Sample Preparation: Fresh or frozen-thawed raw semen is diluted in TNE buffer to a final concentration of approximately 1-2 x 10⁶ sperm/mL [8]. Using raw semen rather than washed, prepared sperm is critical, as processing can artificially induce DNA damage.
- Acid Denaturation: 200 µL of the diluted sample is mixed with 400 µL of a pre-prepared acid denaturation solution (pH 1.20) in a flow cytometer tube. The tube is vortexed gently and incubated for exactly 30 seconds. This low-pH treatment denatures the DNA in situ, but only at sites of existing DNA strand breaks [6] [8].
- Acridine Orange Staining: Immediately following denaturation, 1.2 mL of Acridine Orange staining solution (0.6 µg/mL in staining buffer, pH 6.0) is added to the tube. The sample is vortexed and analyzed by flow cytometry within 3-10 minutes of staining [8].
- Flow Cytometric Analysis: The sample is run through a flow cytometer equipped with a 488 nm laser. Acridine orange intercalated into double-stranded (ds) DNA fluoresces green (measured with a 515-530 nm bandpass filter), while the dye associated with single-stranded (ss) DNA fluoresces red (measured with a >630 nm long-pass filter) [9] [8].
- Data Analysis and Interpretation: The SCSA software generates a cytogram of red vs. green fluorescence and a corresponding frequency histogram.
- The DNA Fragmentation Index (%DFI) is calculated from the histogram as the ratio of cells with red fluorescence to the total fluorescence (red + green), expressed as a percentage. A %DFI > 25-30% is considered a clinical threshold for significantly reduced fertility potential, particularly for natural conception and IUI [13] [8].
- High DNA Stainability (%HDS) represents the proportion of sperm with immature chromatin that has high green fluorescence due to incomplete protamination. A %HDS > 25% may be associated with early embryonic death due to abnormal chromatin structure [8].
When investigating the etiology of SDF, researchers should account for several key factors. The choice of SDF assay is paramount, as different tests measure different aspects of DNA damage (e.g., susceptibility to denaturation vs. direct strand breaks) and yield method-specific thresholds, making direct comparisons between studies using different assays challenging [5] [15]. Furthermore, assessment of oxidative stress should be considered alongside SDF testing. Techniques such as chemiluminescence for direct ROS measurement or the MiOXSYS system for oxidation-reduction potential (ORP) can provide complementary data to elucidate the mechanistic role of oxidative stress in observed DNA damage [16].
In conclusion, sperm DNA fragmentation is a multifaceted condition with a diverse etiology rooted in intrinsic and extrinsic factors, with oxidative stress serving as a common final pathway. The SCSA protocol provides a robust, standardized method for the quantitative assessment of DNA integrity and chromatin maturity. Its integration into andrological research and preclinical drug development offers a powerful tool for diagnosing male factor infertility, evaluating the impact of toxicants or therapeutic interventions on sperm quality, and ultimately guiding clinical decisions to improve reproductive outcomes.
Sperm Chromatin Structure Assay (SCSA) is a flow cytometric diagnostic approach that detects sperm abnormality with a large extent of DNA fragmentation [17]. First described by Evenson in 1980, the assay identifies vulnerability of sperm DNA to acid-induced denaturation in situ and provides two crucial quantitative parameters: DNA Fragmentation Index (DFI) and High DNA Stainability (HDS) [18] [17]. These parameters offer unique insights into male fertility potential that complement conventional semen analysis by assessing molecular and structural integrity of sperm chromatin [19] [20].
The clinical importance of SCSA stems from its ability to identify cases of unexplained infertility where routine semen parameters appear normal but pregnancy fails to occur [21] [19]. This technical note provides detailed methodologies, clinical correlations, and experimental protocols for implementing SCSA in both research and clinical settings, framed within the broader context of sperm chromatin structural assessment research.
Theoretical Foundation and Biological Significance
Sperm Chromatin Organization
Mature sperm chromatin is uniquely organized with nuclear somatic histones replaced by sperm-specific protamines during spermiogenesis, creating a highly compact, toroidal structure stabilized by disulfide cross-links [19] [17]. This specialized architecture protects genetic integrity during transit to the oocyte. Defects in this histone-to-protamine transition result in chromatin structural abnormalities measurable by SCSA parameters [22] [17].
Etiology of Sperm DNA Damage
The causes of sperm DNA damage can be categorized into intrinsic and extrinsic factors:
- Intrinsic factors: Include abnormal recombination during meiosis, abortive apoptosis, defective chromatin maturation, and oxidative stress within the male reproductive tract [19] [17].
- Extrinsic factors: Comprise advanced paternal age, heat exposure, smoking, environmental toxicants, infection, and varicocele [19] [17] [20].
Reactive oxygen species (ROS) play a particularly significant role in DNA fragmentation, with oxidative stress causing both single and double-stranded DNA breaks [19] [17].
Parameter Definitions and Clinical Thresholds
DNA Fragmentation Index (DFI)
DFI represents the percentage of sperm with DNA fragmentation, reflecting abnormal chromatin structure characterized by single and double DNA strand breaks [22] [17]. The parameter is calculated as the ratio of red fluorescing sperm (damaged DNA) to total sperm counted, expressed as a percentage [22].
High DNA Stainability (HDS)
HDS measures the percentage of sperm with immature chromatin characterized by incomplete protamination [21] [22]. These sperm exhibit increased susceptibility to acridine orange staining due to retained histones and lack of full chromatin compaction [21] [22]. HDS reflects structural chromatin abnormalities rather than direct DNA breaks [21].
Table 1: Clinical Thresholds and Interpretations for SCSA Parameters
| Parameter | Normal Range | Intermediate Range | Abnormal Range | Clinical Interpretation |
|---|---|---|---|---|
| DFI | ≤15% [23] | 15-30% [23] | ≥30% [24] [23] | High DFI correlates with reduced natural conception, increased miscarriage risk, and possible need for ART [24] [23] [20]. |
| HDS | - | - | >25% [21] [22] | Indicates high proportion of immature sperm with potential fertilization impairment [21]. |
Table 2: Clinical Correlations of Elevated SCSA Parameters
| Parameter | Fertilization Impact | Embryo Development | Pregnancy Outcomes | Offspring Effects |
|---|---|---|---|---|
| High DFI | No significant effect on IVF/ICSI fertilization rates [24] [18] | Reduced blastocyst formation [25]; Lower rates of transferable embryos [25] | Increased early abortion [24] [23]; No significant difference in clinical pregnancy rates [24] [18] | Associated with decreased birth weight [23] [25]; Increased risk of low birth weight [25] |
| High HDS | Potential fertilization impairment [21] | Conflicting data: one study shows positive relationship with high quality embryo rate [26] | Associated with pregnancy failure [21] [17] | Limited studies available |
SCSA Methodology and Protocols
Instrumentation and Reagents
Table 3: Essential Research Reagent Solutions for SCSA
| Reagent/Buffer | Composition | Function | Critical Notes |
|---|---|---|---|
| TNE Buffer | 0.01M Tris-HCL, 0.15M NaCl, 1mM EDTA [24] | Dilution and suspension of sperm samples | Maintain at 4°C; pH ~7.4 [22] |
| Acid Detergent Solution | 0.15M NaCl, 0.08M HCl, 0.1% Triton X-100, pH 1.2 [22] | Denatures DNA at sites of strand breaks | Critical exposure time: 30 seconds [22] |
| Acridine Orange (AO) Stock | 1.0 mg/ml in distilled water [22] | Metachromatic dye for DNA staining | Store in amber glass; protect from light [22] |
| AO Staining Solution | 6 μg AO/ml in citrate-phosphate buffer [22] | Working solution for DNA quantification | Prepare fresh daily; pH 6.0 [22] |
Sample Preparation Protocol
- Sample Collection: Collect semen samples after 2-7 days of abstinence [20]. Allow 30-60 minutes for liquefaction at 37°C [22] [17].
- Sample Freezing: Flash-freeze aliquots of raw semen in cryotubes using liquid nitrogen vapor or ultra-low temperature freezers (-70°C to -110°C) [22]. Frozen samples can be stored indefinitely in liquid nitrogen without significant effect on SCSA results [22] [20].
- Sample Thawing: Thaw frozen samples in a 37°C water bath "just until the last remnant of ice disappears" to prevent additional DNA damage [22].
- Sample Dilution: Dilute fresh or thawed semen in TNE buffer to achieve concentration of 1-2×10⁶ sperm/mL [22].
SCSA Testing Procedure
Diagram 1: SCSA Experimental Workflow - This diagram illustrates the sequential steps in the SCSA protocol from sample preparation to parameter calculation.
- Acid Denaturation: Add 400μl of acid-detergent solution (pH 1.2) to 200μl of sperm suspension. Mix immediately on vortex for 30 seconds [22] [17].
- Acridine Orange Staining: Add 1.20ml of AO staining solution using an automatic dispenser. Mix on vortex [22].
- Flow Cytometry Analysis: Place sample tube into flow cytometer and start acquisition at 3 minutes to allow for AO equilibration [22]. Collect data for at least 5,000 events per sample [22] [17].
- Fluorescence Detection: Use 488nm laser excitation with detection at 515-530nm (green, double-stranded DNA) and >630nm (red, single-stranded DNA) [22] [17].
- Data Analysis: Calculate DFI as percentage of cells with red fluorescence and HDS as percentage of sperm with high green fluorescence [22].
Quality Control Measures
- Include reference samples with known DFI values for instrument calibration [22].
- Perform duplicate measurements for each sample to ensure reproducibility [22].
- Maintain consistent sample flow rate (<300 cells/sec) during flow cytometry [22].
- Use standardized protocols and stringent quality control to ensure reliable results between laboratories [20].
Clinical Applications and Decision Pathways
Diagram 2: Clinical Decision Pathway - This diagram outlines evidence-based clinical decisions guided by SCSA parameters, showing pathways for different DFI and HDS values.
Interpretation in Clinical Context
SCSA parameters provide statistical probabilities rather than absolute predictors of fertility outcomes [20]. Clinical interpretation should consider:
- DFI < 15%: Indicates good sperm DNA integrity with high probability of success in natural conception and IUI [23].
- DFI 15-30%: Suggests moderate DNA damage; may benefit from lifestyle interventions and antioxidant therapy before ART [23] [19].
- DFI ≥ 30%: Associated with significantly reduced odds of natural conception and IUI success; couples should be counseled toward IVF/ICSI [24] [20].
- HDS > 25%: Indicates high proportion of immature sperm; may benefit from extended abstinence period reduction or medical treatment to improve sperm maturation [21] [22].
Correlation with ART Outcomes
Recent large-scale studies demonstrate that high DFI significantly affects miscarriage rates and birth weight rather than clinical pregnancy rates per transfer [23] [25]. A study of 6,330 ART cycles revealed significantly higher miscarriage rates in groups with DFI >30% compared to DFI <15%, with a positive correlation between miscarriage rates and DFI (OR 1.095; 95% CI 1.068-1.123; P<0.001) [23]. Similarly, birth weight exhibited a negative correlation with DFI (OR 0.913; 95% CI 0.890-0.937; P<0.001) [23].
For ICSI outcomes, recent evidence suggests DFI may not significantly predict pregnancy success [18]. A study of 550 couples undergoing 1,050 ICSI cycles found no significant difference in DFI between couples who achieved pregnancy (DFI 12.9%) and those who did not (DFI 12.2%) [18].
SCSA provides critical parameters DFI and HDS that complement conventional semen analysis by offering molecular-level assessment of sperm chromatin integrity. While DFI has proven value in predicting natural conception, IUI success, and miscarriage risk, its predictive value for ICSI outcomes remains debated. HDS assessment contributes information about sperm maturation but requires further research to clarify its clinical utility. Standardized protocols, appropriate sample handling, and rigorous quality control are essential for reliable SCSA implementation in both research and clinical settings. These parameters enable evidence-based clinical decisions and personalized treatment pathways for infertile couples, representing significant advances in male fertility assessment beyond traditional semen parameters.
Sperm DNA integrity is a critical parameter in male fertility assessment, extending beyond conventional semen analysis. The Sperm Chromatin Structure Assay (SCSA) has emerged as a primary flow cytometry-based method to quantify two fundamental parameters: the DNA Fragmentation Index (DFI), representing the percentage of sperm with damaged DNA, and High DNA Stainability (HDS), indicating the proportion of sperm with immature chromatin resulting from aberrant protamine-to-histone ratios [26] [27]. While DFI has gained broader clinical recognition, the predictive value and clinical significance of HDS remain ambiguous and controversial within reproductive medicine [26]. These biomarkers are increasingly investigated not only for their diagnostic capabilities but also for monitoring the impacts of environmental exposures and informing therapeutic interventions in assisted reproductive technology (ART). This document synthesizes current evidence and methodologies to establish clear application notes and protocols for researchers and clinicians navigating this complex landscape.
Quantitative Relationships: DFI, HDS, and Clinical Parameters
Epidemiological and clinical studies consistently reveal distinct relationships between SCSA parameters, patient factors, and ART outcomes. The data below summarize key quantitative associations essential for interpreting clinical significance.
Table 1: Impact of Demographic and Lifestyle Factors on SCSA Parameters
| Factor | Impact on DFI | Impact on HDS | Significance & References |
|---|---|---|---|
| Advanced Male Age | Significant increase [28] [29] | Decrease or no significant change [26] [28] | DFI in men ≥35 years is significantly higher than in younger groups (P<0.001) [28]. |
| Abstinence Duration | Significant increase with longer abstinence [26] | Unexplained negative correlation [26] | DFI is directly correlated with abstinence days (p<0.001) [26]. |
| Body Mass Index (BMI) | Information missing | Unexplained negative correlation [26] | HDS shows a negative correlation with BMI (p<0.01) [26]. |
| Alcohol Consumption | Significant increase [29] | Information missing | Alcohol use is independently associated with high DFI (OR=18.01, p<0.001) [29]. |
| Metal Exposure (Cr, Tl) | Significant increase [27] | Significant increase (Cr) [27] | Elevated Cr and Tl in seminal plasma are associated with high DFI and iOAT risk [27]. |
Table 2: Correlation of SCSA Parameters with Semen Quality and ART Outcomes
| Parameter | Correlation with DFI | Correlation with HDS | Significance & References |
|---|---|---|---|
| Sperm Motility | Strong negative correlation [26] [28] | Weak negative correlation [28] | DFI is negatively correlated with pre- and post-processing motility (p<0.001) [28]. |
| Sperm Morphology | Positive correlation with deformity [28] | Positive correlation with deformity [28] | Both DFI and HDS correlate with abnormal head morphology and deformity indices [26] [28]. |
| Miscarriage Rate | Significant positive correlation [23] | Information missing | Miscarriage rates significantly higher in IVF/ICSI groups with DFI≥30% (P=0.005) [23]. |
| Birth Weight | Significant negative correlation [30] [23] | Information missing | Birth weight decreases as DFI increases (OR 0.913; P<0.001) [23]. Risk of low birth weight increases to 10.1% in high DFI group [30]. |
| Blastocyst Formation | Significant negative impact [30] | Information missing | High DFI affects blastocyst formation rate (P=0.045) [30]. |
| Live Birth Rate (ICSI) | Positively correlated (meaningless) [26] | Information missing | A single study reported a positive correlation (p<0.05) deemed "meaningless" by authors [26]. |
| High-Quality Embryo Rate | Information missing | Unexplained positive relationship [26] | HDS showed a positive relationship (p<0.05) in fresh ICSI cycles [26]. |
Experimental Protocols for SCSA and DFI Assessment
Sperm Chromatin Structure Assay (SCSA) Protocol
The SCSA is a high-precision flow cytometry method that indirectly measures DNA breaks through denaturability.
Key Reagents and Equipment:
- Flow Cytometer (e.g., Navios flow cytometer, Beckman Coulter) [26]
- SCSA Kit (e.g., from Zhejiang Cellpro Biotech) containing Acid Solution and Acridine Orange (AO) dye [26]
- Buffer (4°C) for dilution
Detailed Workflow:
- Sample Preparation: Collect semen sample after 2-7 days of sexual abstinence. Allow liquefaction for 30-60 minutes at 37°C [26] [29].
- Dilution: Dilute the liquefied semen with 4°C buffer to a standardized sperm concentration of 1-5 × 10^6/mL [26].
- Acid Denaturation: Add 500 µL of acid solution to the diluted sperm suspension for 30 seconds. This step partially denatures DNA at sites of fragmentation.
- Staining: Add the cell-permeable dye Acridine Orange (AO). AO fluoresces green when intercalated with double-stranded DNA and red when associated with single-stranded DNA.
- Flow Cytometry: Immediately analyze the sample using the calibrated flow cytometer, recording at least 5,000 cells per measurement.
- Data Analysis: Using specialized software (e.g., DFI View software), calculate the DFI (percentage of sperm with red fluorescence, indicating denatured, fragmented DNA) and HDS (percentage of sperm with high green fluorescence, indicating immature chromatin with high stainability) [26].
Sperm Chromatin Dispersion (SCD) Test Protocol
The Halosperm kit is a commercial SCD test commonly used as an alternative to SCSA.
Key Reagents and Equipment:
- Halosperm Kit (Halotech DNA, Spain) [29]
- Pre-coated Slides
- Microscope
Detailed Workflow:
- Sample Preparation: Dilute semen to a concentration of 10-20 × 10^6/mL in phosphate-buffered saline (PBS).
- Agarose Embedding: Mix the diluted sample with liquefied low-melting-point agarose and pipette onto a pre-coated slide. Allow it to solidify at 4°C.
- Denaturation and Lysis: Subject the slide to a series of treatments:
- Acid Denaturation: Immerse in an acid solution for 7 minutes to denature DNA containing breaks.
- Lysis: Treat with a lysing solution for 25 minutes to remove nuclear proteins.
- Washing and Staining: Wash slides and stain with a DNA-binding fluorescent dye.
- Microscopy Analysis: Score sperm based on the dispersion halo. Sperm with intact DNA produce large halos of dispersed chromatin, while those with fragmented DNA show small or no halos. The DFI is calculated as the percentage of sperm without halos [29].
Visualizing Pathways and Workflows
SCSA Clinical Interpretation Pathway
The following diagram outlines the clinical decision-making process based on SCSA results, integrating their relationship with semen quality and final clinical outcomes.
SCSA Laboratory Workflow
This diagram details the key procedural steps for performing the Sperm Chromatin Structure Assay, from sample preparation to final result calculation.
The Scientist's Toolkit: Key Research Reagents
Table 3: Essential Reagents and Kits for Sperm DNA Integrity Analysis
| Reagent/Kit | Primary Function | Application Context |
|---|---|---|
| SCSA Kit (e.g., Zhejiang Cellpro Biotech) | Provides standardized reagents for acid denaturation and Acridine Orange staining for flow cytometry. | Gold-standard protocol for simultaneous DFI and HDS measurement in clinical and research settings [26]. |
| Halosperm Kit (Halotech DNA, Spain) | A commercial Sperm Chromatin Dispersion (SCD) test for microscopic visualization of DNA fragmentation. | A common, accessible alternative to SCSA for determining DFI in andrology labs [29]. |
| Acridine Orange (AO) | Metachromatic dye that fluoresces green (dsDNA) or red (ssDNA) depending on DNA integrity. | The core fluorescent probe used in SCSA to differentiate between intact and fragmented sperm DNA [26]. |
| Inductively Coupled Plasma Mass Spectrometry (ICP-MS) | Quantifies trace metal concentrations in biological samples like seminal plasma. | Research tool for investigating associations between metal exposure (e.g., Cr, Tl) and increased DFI/HDS [27]. |
| PICSI (Physiological ICSI) Dishes | Functional sperm selection method based on hyaluronic acid binding to select mature sperm with lower DFI. | Clinical tool to improve embryo quality by selecting sperm with better DNA integrity for injection [29]. |
DFI has established itself as a robust clinical biomarker, significantly correlated with poorer semen parameters, increased miscarriage rates, compromised embryonic development, and adverse neonatal outcomes such as reduced birth weight. In contrast, HDS remains a parameter of uncertain clinical value, often exhibiting counterintuitive correlations and demonstrating no significant mediating role in infertility pathways. Its utility in predicting ART outcomes is highly questionable, necessitating further investigation. A standardized SCSA protocol, as detailed herein, is crucial for generating reliable and comparable data. Future research should focus on elucidating the biological mechanisms underlying HDS and validating the role of DFI in guiding therapeutic strategies in assisted reproduction.
The Sperm Chromatin Structure Assay (SCSA) has undergone a significant evolution, transitioning from a specialized research technique to a critical clinical diagnostic tool in male fertility assessment. This evolution is characterized by extensive clinical validation, technological refinement, and the establishment of standardized protocols that have cemented its role in predicting reproductive outcomes. As a flow cytometry-based method, SCSA provides a robust, quantitative measure of sperm DNA fragmentation (SDF), a parameter increasingly recognized as crucial beyond conventional semen parameters. The assay's journey to clinical adoption represents a paradigm shift in andrology, where DNA integrity is now acknowledged as a fundamental determinant of fertility potential, especially in the context of assisted reproductive technologies (ART).
Application Notes: Data and Clinical Validation
Quantitative Findings from Large Cohort Studies
Recent large-scale studies have firmly established the clinical value of SCSA. A 2023 study analyzing approximately 10,000 semen samples demonstrated a strong, linear correlation between SDF levels and patient age, confirming SCSA's sensitivity in detecting age-related declines in sperm DNA integrity [5].
Table 1: SCSA Correlation with Patient Age and Conventional Parameters in a Large Cohort (n ≈ 10,000)
| Parameter | Correlation with Aging | Clinical Significance | Assessment Method |
|---|---|---|---|
| Sperm DNA Fragmentation (SDF) | Increases linearly with age | Strong predictor of fertility potential; increases miscarriage risk | SCSA, TUNEL (Flow Cytometry) |
| High DNA Stainability (HDS) | Remains unchanged with age | Indicates immature sperm chromatin | SCSA |
| Sperm Motility | Significantly lower in ages 50-59 | Does not dramatically change with age | CASA System |
| Sperm Volume | Significantly lower in ages 50-59 | Conventional parameter with limited predictive value | Standard WHO analysis |
| Sperm Morphology/Count | No dramatic change with age | Inadequate alone for fertility potential assessment | Standard WHO analysis |
A critical finding from this large cohort was the concordance between SCSA and other SDF assessment methods, such as the TUNEL assay, while also highlighting SCSA's superior sensitivity. The SDF values obtained via SCSA were systematically higher than those from TUNEL, a difference attributed to SCSA's enhanced detection capability which must be considered in clinical diagnostics [5].
Protocol Comparison and Technical Standardization
The evolution of SCSA is marked by its standardization, which has been vital for clinical adoption. The core protocol has remained consistent, ensuring reproducibility across different laboratories and clinical settings.
Table 2: Detailed SCSA Experimental Protocol and Reagents
| Step | Reagent/Solution | Composition / Specification | Function / Purpose |
|---|---|---|---|
| 1. Sample Preparation | TNE Buffer | 0.15 mol/L NaCl, 0.01 mol/L Tris, 0.001 mol/L EDTA, pH 7.4 | Dilution and maintenance of sperm cell integrity at 4°C [31]. |
| 2. Acid Denaturation | Low-pH Detergent Solution | 0.15 mol/L NaCl, 0.08 N HCl, 0.01% Triton X-100, pH 1.4 | Partial DNA denaturation; preferential denaturation in DNA fragments with integrity issues [31]. |
| 3. Staining | Acridine Orange (AO) Staining Solution | 6 µg/mL AO, 0.2 M Na₂HPO₄, 1 mM disodium EDTA, 0.15 M NaCl, 0.1 M citric acid monohydrate, pH 6.0 | Metachromatic staining: green fluorescence (double-stranded DNA) vs. red fluorescence (single-stranded DNA) [31]. |
| 4. Analysis | Flow Cytometer | Standard configuration with appropriate lasers and filters | Rapid quantification of ~5,000 sperm cells to calculate DNA Fragmentation Index (DFI) and HDS [5]. |
Experimental Protocols
Core SCSA Laboratory Protocol
The following detailed methodology is adapted for clinical diagnostic use, reflecting the standardized workflow that ensures reliable and reproducible results [31] [5].
- Sample Preparation: Fresh semen samples are collected by masturbation after 2-7 days of abstinence. After liquefaction, dilute the sample to a concentration of approximately 2 x 10⁶ sperm/mL using ice-cold TNE buffer. All subsequent steps must be performed at 4°C to prevent artificial DNA denaturation.
- Acid Denaturation: Transfer a 200 µL aliquot of the diluted sample. Add 400 µL of the pre-chilled, low-pH detergent solution directly to the aliquot. Incubate for exactly 30 seconds. This critical step preferentially denatures DNA in sperm with existing chromatin defects.
- Staining: Immediately after the 30-second denaturation, add 1.2 mL of the Acridine Orange (AO) staining solution to the mixture. The AO dye intercalates with DNA; it fluoresces green when bound to double-stranded DNA and red when associated with single-stranded DNA.
- Flow Cytometric Analysis: Within 3 minutes of staining, introduce the sample into the flow cytometer. Analyze a minimum of 5,000 events per sample to ensure statistical significance. The flow cytometer measures the metachromatic shift from green to red fluorescence for each sperm cell.
- Data Interpretation: The primary outcome measure is the DNA Fragmentation Index (DFI), calculated as the ratio of red fluorescence to total (red + green) fluorescence. A second parameter, High DNA Stainability (HDS), indicates the proportion of sperm with immature chromatin. A DFI greater than 25-30% is generally considered clinically significant and associated with reduced fertility outcomes.
Workflow Visualization
The following diagram illustrates the logical sequence and decision points in the SCSA protocol, from sample preparation to clinical interpretation.
The Scientist's Toolkit: Research Reagent Solutions
The reliability of the SCSA diagnostic test hinges on the precise composition and quality of its key reagents.
Table 3: Essential Research Reagents for SCSA Protocol
| Reagent / Material | Function in Assay | Critical Specifications |
|---|---|---|
| TNE Buffer | Maintains osmotic balance and pH for sperm cell integrity during initial preparation, preventing premature damage before analysis. | Precise molarity of NaCl (0.15 M), Tris (0.01 M), and EDTA (0.001 M); strict pH of 7.4 [31]. |
| Acid Denaturation Solution | Induces partial DNA denaturation at sites with intrinsic chromatin defects; the degree of denaturation is quantitatively related to DNA fragmentation. | Critical concentration of HCl (0.08 N) and Triton X-100 (0.01%); must be prepared and used at 4°C [31]. |
| Acridine Orange (AO) Dye | Metachromatic fluorochrome that differentially stains double-stranded (green) and single-stranded (red) DNA, enabling quantification by flow cytometry. | Precise concentration (6 µg/mL) in a citrate-phosphate buffer at pH 6.0 is essential for accurate fluorescence emission [31]. |
| Flow Cytometer | High-throughput analytical instrument that rapidly measures fluorescence signals from individual sperm cells to compute population-level statistics for DFI and HDS. | Must be calibrated with standard fluorescent beads; requires a 488 nm laser and appropriate filters for green (530/30 nm) and red (>630 nm) fluorescence [5]. |
The journey of SCSA from a research tool to an established clinical diagnostic exemplifies the translation of basic scientific discovery into practical medical application. Its validation through large-scale clinical studies, detailed standardization of protocols, and the clear definition of clinically relevant thresholds for DNA Fragmentation Index (DFI) have positioned SCSA as a cornerstone of modern male fertility assessment. By providing a robust, quantitative measure of sperm DNA integrity that surpasses the predictive power of conventional semen parameters, SCSA empowers clinicians and researchers to make more informed decisions, ultimately improving diagnostics and personalized treatment strategies in reproductive medicine.
Executing the SCSA: A Step-by-Step Protocol from Sample Collection to Data Analysis
Sample Collection, Handling, and Cryopreservation Standards
Sperm DNA integrity is a critical determinant of reproductive success, influencing outcomes in both natural conception and assisted reproductive technologies (ART) [5]. The Sperm Chromatin Structure Assay (SCSA) stands as one of the most validated and reliable methods for assessing sperm DNA fragmentation (SDF), providing crucial diagnostic and prognostic information for male fertility evaluation [6] [32]. First introduced by Evenson in 1980, this flow cytometry-based technique measures the susceptibility of sperm DNA to acid-induced denaturation, yielding the DNA Fragmentation Index (DFI) as a primary marker of DNA integrity [33] [17]. The clinical utility of SCSA has been firmly established across multiple species, including humans, bulls, boars, and stallions, with defined thresholds that correlate strongly with fertility outcomes [34] [6]. However, the precision and clinical relevance of SCSA results are profoundly dependent on rigorous standardization of pre-analytical procedures, particularly in sample collection, handling, and cryopreservation. This protocol outlines evidence-based standards to ensure the reliability and reproducibility of SCSA diagnostics for research and clinical applications.
SCSA Fundamentals and Principles
Core Principle of the SCSA
The SCSA operates on the principle that sperm with abnormal chromatin structure exhibits increased susceptibility to DNA denaturation when exposed to mild acid conditions [34] [17]. The assay utilizes the metachromatic dye acridine orange (AO), which differentially fluoresces when bound to double-stranded versus single-stranded DNA. Intact, double-stranded DNA fluoresces green, while denatured, single-stranded DNA fluoresces red [6] [32]. The fundamental mechanism involves acid treatment that denatures DNA at sites of existing DNA strand breaks in the phosphodiester backbone; it is crucial to note that the acid treatment does not create new breaks but rather exposes pre-existing fragmentation by unwinding DNA at these vulnerable sites [32].
Measured Parameters
- DNA Fragmentation Index (DFI): Also known as Cells Outside the Main Population (COMPαt), DFI represents the percentage of sperm with DNA fragmentation [34] [32]. This parameter serves as the most significant predictor of fertility outcomes, with thresholds having well-established clinical implications.
- High DNA Stainability (HDS): This parameter identifies sperm with immature chromatin characterized by incomplete protamination, which exhibits increased AO staining due to higher histone-complexed DNA content [32] [17]. Elevated HDS values correlate with structural chromatin abnormalities and pregnancy failure.
Table 1: Clinical Thresholds for SCSA Parameters in Male Fertility Assessment
| Parameter | Threshold Value | Clinical Interpretation | Reproductive Implications |
|---|---|---|---|
| DFI | < 20% | Excellent DNA integrity | High probability of natural pregnancy |
| DFI | 20-30% | Moderate DNA fragmentation | Declining pregnancy rates with IUI |
| DFI | > 30% | High DNA fragmentation | Near-zero pregnancy with IUI; consider ICSI |
| DFI | > 50% | Very high DNA fragmentation | Consider TESE-ICSI |
| HDS | > 20-25% | High immature sperm count | Associated with pregnancy failure |
Sample Collection Protocols
Patient Preparation and Instructions
- Abstinence Period: Standardize abstinence duration to 2-7 days, with optimal range of 2-4 days to minimize oxidative stress from extended abstinence [35].
- Collection Method: Specimens must be collected by masturbation into sterile, wide-mouthed containers. The use of spermicide-free condoms is acceptable if masturbation collection is not feasible.
- Transport Conditions: Maintain samples at ambient temperature (20-25°C) during transport. Avoid temperature fluctuations and direct sunlight exposure during transit.
Initial Processing
- Liquefaction: Allow semen samples to liquefy naturally for 30 minutes at 37°C in an incubator [17].
- Assessment: Perform basic semen analysis according to WHO 2021 standards, including volume, concentration, motility, and morphology [5].
- Aliquoting: Prepare aliquots for SCSA analysis immediately after liquefaction to prevent additional DNA fragmentation.
Cryopreservation and Handling Standards
Cryopreservation Protocol
Proper cryopreservation is critical for SCSA analysis, as the assay requires frozen-thawed samples. The SCSA has been validated to show that frozen and rapidly thawed samples maintain the same SCSA values as fresh samples [32].
- Freezing Medium Preparation: Prepare TNE buffer (10 mM Tris-HCl, 150 mM NaCl, 1 mM EDTA, pH 7.5) as cryopreservation medium [35].
- Sample Dilution: Dilute liquefied semen with TNE buffer to achieve a sperm concentration of 1-2 × 10⁶/mL [17].
- Freezing Procedure:
- Aliquot 200 μL of diluted semen into cryovials.
- Place cryovials in a controlled-rate freezer or directly into liquid nitrogen vapor phase for 30 minutes.
- Transfer to long-term storage in liquid nitrogen (-196°C) or ultra-low temperature freezers (-70 to -110°C) [17].
- Quality Control: Include control samples with known DFI values in each freezing batch to monitor procedure consistency.
Thawing Procedure
- Rapid Thawing: Thaw cryopreserved samples rapidly in a 37°C water bath for 3-5 minutes until complete ice dissolution [32].
- Immediate Processing: Process thawed samples immediately for SCSA analysis to prevent additional DNA damage from refreezing or extended storage.
SCSA Experimental Workflow
The following diagram illustrates the complete SCSA procedure from sample collection to data analysis:
Acid Denaturation Protocol
- Reagent Preparation: Prepare acid detergent solution (0.15M NaCl, 0.08M HCl, 0.1% Triton X-100, pH 1.2) fresh weekly [32] [17].
- Denaturation Procedure:
- Add 400 μL of acid solution to 200 μL of thawed sperm suspension.
- Mix strictly for 30 seconds using a vortex mixer at medium speed.
- Immediate progression to staining is critical to maintain timing precision.
Acridine Orange Staining
- Staining Solution: Prepare AO staining solution (6 μg AO/mL in 0.1M citric acid, 0.2M Na₂HPO₄, 1 mM EDTA, 0.15M NaCl, pH 6.0) [17].
- Staining Protocol:
- Add 1.2 mL of AO staining solution to the acid-treated sample.
- Mix gently but thoroughly.
- Maintain staining time of 150 seconds before flow cytometric analysis.
Flow Cytometric Analysis
- Instrument Setup: Calibrate flow cytometer daily using reference samples with known DFI values.
- Acquisition Parameters:
- Excitation: Blue light (450-490 nm)
- Emission filters: 530 nm (green, dsDNA) and >630 nm (red, ssDNA)
- Events recorded: 5,000-10,000 sperm per sample
- Flow rate: ≤250 cells/second [32]
- Quality Assurance: Regularly verify instrument performance using standardized beads and control samples.
Research Reagent Solutions
Table 2: Essential Reagents for SCSA Implementation
| Reagent | Composition/Specifications | Function in Protocol |
|---|---|---|
| TNE Buffer | 10 mM Tris-HCl, 150 mM NaCl, 1 mM EDTA, pH 7.5 | Sample dilution and cryopreservation medium |
| Acid Denaturation Solution | 0.15M NaCl, 0.08M HCl, 0.1% Triton X-100, pH 1.2 | Denatures DNA at sites of strand breaks |
| Acridine Orange (AO) | 6 μg/mL in citrate-phosphate buffer, pH 6.0 | Metachromatic dye that differentially stains dsDNA (green) and ssDNA (red) |
| TE Buffer | 10 mM Tris-HCl, 150 mM NaCl, 1 mM EDTA, pH 7.5 | Sample preparation and dilution buffer |
| Liquid Nitrogen | High-purity, storage grade | Long-term sample preservation at -196°C |
Data Interpretation and Quality Control
Analysis Parameters
The SCSA data analysis employs specialized software (SCSAsoft) to generate three primary parameters from the flow cytometric data:
Quality Control Measures
- Inter-laboratory Standardization: Multiple studies have demonstrated high correlation (R² = 0.98-0.99) of SCSA results between different laboratories using various flow cytometer models, confirming excellent reproducibility [32].
- Control Samples: Include high, medium, and low DFI control samples in each analysis batch.
- Proficiency Testing: Participate in regular external quality assurance programs when available.
- Documentation: Maintain detailed records of all procedural steps, including exact timing, temperatures, and reagent lot numbers.
Troubleshooting and Technical Considerations
Common Technical Issues
- High Background Fragmentation: Often results from prolonged abstinence periods or improper sample handling during collection and transport.
- Poor Resolution in Scatterplots: Typically caused by outdated AO staining solution or improper acid denaturation timing.
- Inter-sample Variability: Minimize by strict adherence to standardized protocols and temperature control throughout the process.
Validation Procedures
- New Operator Training: Require parallel testing with experienced operators until results achieve correlation of R² > 0.95.
- Reagent Validation: Test new reagent lots alongside current lots using control samples before implementation.
- Instrument Calibration: Perform daily calibration using reference samples to ensure consistent performance.
The reliability and clinical utility of SCSA for assessing sperm DNA fragmentation depend fundamentally on rigorous standardization of sample collection, handling, and cryopreservation procedures. Implementation of these evidence-based protocols ensures the analytical validity necessary for both research applications and clinical diagnostics. The robust nature of SCSA, when properly standardized, is evidenced by its strong predictive value for natural conception, IUI success, and recommendations for ART intervention strategies. Continued adherence to these standardized protocols will further enhance the reproducibility and clinical relevance of SCSA in the assessment of male fertility potential.
The Sperm Chromatin Structure Assay (SCSA) is a powerful flow cytometric technique that provides an objective measure of sperm DNA integrity, a parameter increasingly recognized as critical for male fertility assessment [36]. This protocol details the core SCSA procedure of acid denaturation and acridine orange staining, which enables the quantitative discrimination between sperm with normal double-stranded DNA and those with abnormal, fragmented, or denaturable DNA [37].
The fundamental principle of the SCSA relies on the metachromatic properties of acridine orange. This fluorescent dye emits green fluorescence when intercalated into double-stranded DNA and red fluorescence when associated with single-stranded DNA [36]. The assay quantitatively measures the susceptibility of sperm DNA to acid-induced denaturation in situ, providing two key clinical parameters: the DNA Fragmentation Index, which represents the percentage of sperm with denatured DNA, and the High DNA Stainability, which identifies sperm with immature chromatin [37] [9].
Principles and Mechanisms
Biochemical Basis of the Assay
The SCSA exploits the differential interaction of acridine orange with native versus denatured DNA. Under controlled acidic conditions, sperm with compromised chromatin integrity undergo partial DNA denaturation at the sites of DNA strand breaks. When subsequently stained with acridine orange, these sperm exhibit shifts in fluorescence emission that are precisely quantifiable by flow cytometry [36].
Table 1: Key Fluorescence Characteristics in SCSA
| DNA State | Acridine Orange Binding | Fluorescence Emission | Clinical Significance |
|---|---|---|---|
| Double-stranded (Native) | Intercalative | Green (~525 nm) | Normal, mature chromatin |
| Single-stranded (Denatured) | Stacked / Aggregated | Red (~650 nm) | DNA fragmentation/damage |
| High DNA Stainability | Increased accessibility | High Green Intensity | Immature chromatin, incomplete protamination |
Signaling Pathway and Molecular Logic
The following diagram illustrates the molecular logic underlying the acid denaturation process and the subsequent acridine orange staining that enables detection of chromatin abnormalities:
Materials and Reagents
Research Reagent Solutions
Table 2: Essential Reagents for SCSA Protocol
| Reagent / Solution | Composition / Specification | Function in Protocol |
|---|---|---|
| Acridine Orange Stock Solution | 1 mg/mL in distilled water | Metachromatic fluorescent dye for DNA staining |
| Acid Denaturation Buffer | 0.1% Triton X-100, 0.15 M NaCl, 0.08 N HCl, pH ~1.2 | Induces partial DNA denaturation at break sites |
| Staining Buffer | 0.1 M citric acid, 0.2 M Na₂HPO₄, 1 mM EDTA, 0.15 M NaCl, pH 6.0 | Provides optimal conditions for acridine orange binding |
| Phosphate-Buffered Saline | Standard PBS, pH 7.4 | Sample washing and dilution |
| Triton X-100 Solution | 0.1% in PBS | Cell membrane permeabilization |
Step-by-Step Protocol
Sample Preparation
- Liquefaction: Allow freshly collected semen samples to liquefy completely at room temperature for 20-30 minutes [5].
- Aliquoting: Transfer a 100-200 µL aliquot of the liquefied semen to a clean tube.
- Flash Freezing: For batch analysis or shipment, flash-freeze aliquots in liquid nitrogen or a dry ice-ethanol bath and store at -80°C until analysis. Note: Frozen samples yield virtually identical results to fresh samples when properly processed [37].
Acid Denaturation
- Dilution: Dilute the semen sample to approximately 1-2 × 10⁶ sperm/mL in TNE buffer (0.01 M Tris-HCl, 0.15 M NaCl, 1 mM EDTA, pH 7.4).
- Acid Treatment: Mix 200 µL of diluted sperm with 400 µL of prepared acid denaturation buffer (0.1% Triton X-100, 0.15 M NaCl, 0.08 N HCl, pH ~1.2).
- Incubation: Incubate the mixture for 30 seconds at room temperature, ensuring precise timing to maintain inter-assay consistency [36].
Acridine Orange Staining
- Staining Solution Addition: Add 1.2 mL of acridine orange staining solution (6 µg/mL in 0.1 M citric acid, 0.2 M Na₂HPO₄, 1 mM EDTA, 0.15 M NaCl, pH 6.0) to the acid-treated sample.
- Staining Incubation: Allow the staining to proceed for 3 minutes at room temperature before flow cytometric analysis [9].
Flow Cytometric Analysis
- Instrument Setup: Configure the flow cytometer with 488 nm excitation and standard filter sets for green (530/30 nm) and red (>630 nm) fluorescence detection.
- Data Acquisition: Analyze approximately 5,000-10,000 events per sample at a flow rate of 200-300 cells/second [36] [37].
- Parameter Measurement: Collect green (native DNA) and red (denatured DNA) fluorescence data for each sperm cell.
The following workflow diagram summarizes the complete experimental procedure from sample preparation through data analysis:
Data Analysis and Interpretation
Calculation of SCSA Parameters
The flow cytometric data are analyzed using specialized SCSAsoft software to generate two primary clinical parameters:
DNA Fragmentation Index: Calculated as the ratio of red to total fluorescence (red/[red+green]) expressed as a percentage. DFI represents the proportion of sperm with DNA fragmentation in the sample [36] [9].
High DNA Stainability: Determined as the percentage of sperm with abnormally high green fluorescence, indicative of immature sperm chromatin with incomplete protamination [37].
Clinical Thresholds and Interpretation
Table 3: Clinical Thresholds for SCSA Parameters
| Parameter | Normal Range | Moderate Concern | Clinical Concern | Clinical Implications |
|---|---|---|---|---|
| % DFI | < 15% | 15-25% | > 25% [37] | >25%: Statistical probability of longer time to pregnancy, IUI failure, or miscarriage [37] |
| % HDS | < 15% | 15-25% | > 25% | Predictive of pregnancy failure; indicates chromatin immaturity [37] |
Applications in Research and Clinical Practice
The SCSA provides a robust, standardized method for assessing sperm DNA integrity with significant clinical utility:
- Fertility Prognosis: SCSA parameters have demonstrated superior predictive value for natural conception and IUI success compared to conventional semen parameters [36].
- ART Treatment Selection: Patients with DFI >25% are counseled toward ICSI, while those with DFI >50% may consider TESE/ICSI [37].
- Toxicology and Environmental Studies: The high precision and low coefficient of variation (1-3%) make SCSA ideal for dose-response studies [37].
- Longitudinal Monitoring: Enables assessment of interventional efficacy for lifestyle modifications or medical treatments aimed at improving sperm chromatin quality [36].
Technical Notes and Troubleshooting
- Precision and Reproducibility: The SCSA demonstrates exceptional repeatability with CVs of 1-3% for replicate measurements, attributable to the precise control of acid denaturation conditions [37].
- Sample Stability: Flash-frozen samples maintain stable SCSA parameters, enabling batch analysis and shipment to specialized reference laboratories [37].
- Quality Control: Include reference samples with known DFI values in each run to monitor assay performance and inter-assay variation.
- Analysis Consistency: The flow cytometric analysis of 5,000-10,000 cells provides a statistically robust representation of the sperm population, minimizing sampling error compared to conventional semen analysis [36].
Flow Cytometer Setup and Configuration for SCSA
The Sperm Chromatin Structure Assay (SCSA) is a powerful flow cytometric technique recognized as a gold standard for assessing sperm DNA fragmentation and chromatin maturity [38]. Within the broader thesis research on SCSA protocols, the precise setup and configuration of the flow cytometer is a critical determinant of assay success. This application note provides a detailed, practical guide for configuring a flow cytometer specifically for the SCSA, enabling researchers and drug development professionals to obtain statistically robust, clinically relevant data on sperm nuclear integrity [39]. The protocol detailed here allows for the simultaneous measurement of two key parameters: the DNA Fragmentation Index (%DFI), indicating the level of DNA strand breaks, and the High DNA Stainability (%HDS), reflecting immature chromatin with residual histones [22].
Flow Cytometer Configuration and Specifications
Instrument Requirements
The SCSA test requires a flow cytometer with a specific, minimal configuration to ensure accurate and reproducible results [22]. The core components and their required specifications are summarized in Table 1.
Table 1: Essential Flow Cytometer Configuration for SCSA
| Component | Specification | Function in SCSA |
|---|---|---|
| Laser | 488 nm argon ion laser, standard power | Excites the acridine orange (AO) dye [22]. |
| Green Fluorescence Detector | Band Pass (BP) filter, 515-530 nm (FITC filter) | Detects green fluorescence from AO intercalated into double-stranded DNA [22]. |
| Red Fluorescence Detector | Long Pass (LP) filter, >630 nm (630 LP filter) | Detects red fluorescence from AO associated with single-stranded DNA [22]. |
| Flow Rate | Stable, maintaining <300 cells/second | Ensures precise measurement and prevents coincidence detection [22]. |
| Computer System | Interfaced with the cytometer, running data acquisition software | Controls the instrument and collects data from a minimum of 5,000 sperm per sample [39] [22]. |
Key Experimental Parameters and Clinical Thresholds
The data obtained from the flow cytometer is analyzed to generate two primary quantitative parameters. Their characteristics and clinical significance are outlined in Table 2.
Table 2: Key SCSA Output Parameters and Clinical Interpretation
| Parameter | Cytometric Measurement | Biological Significance | Clinical Threshold |
|---|---|---|---|
| %DFI (DNA Fragmentation Index) | Ratio of red/(red+green) fluorescence, representing sperm with DNA strand breaks [22]. | Extent of single- and double-strand DNA breaks; high %DFI is correlated with reduced fertility, higher miscarriage rates, and poor embryo development [38] [5]. | ≥25% indicates significantly compromised fertility potential for natural conception and IUI [22]. |
| %HDS (High DNA Stainability) | Sperm population with abnormally high green fluorescence after acid denaturation [22]. | Reflects immature chromatin with incomplete protamination (excess nuclear histones), which can lead to abnormal gene expression after fertilization [38] [22]. | ≥25% may result in early embryo death due to abnormal chromatin structure [22]. |
Experimental Protocol: SCSA by Flow Cytometry
Reagent Preparation
- TNE Buffer: 0.15 M NaCl, 0.01 M Tris-HCl, 0.001 M EDTA, pH 7.4 [40].
- Acid-Detergent Solution: 0.08 N HCl, 0.15 M NaCl, 0.1% Triton X-100, pH 1.2 [22].
- Acridine Orange (AO) Staining Solution (Working Solution): Prepare from a 1 mg/mL stock AO solution in distilled water to a final concentration of 6 µg/mL in a phosphate-citrate buffer (0.2 M Na~2~HPO~4~, 0.1 M citric acid, 1 mM EDTA, 0.15 M NaCl, pH 6.0) [40] [22].
Step-by-Step Workflow
The following diagram illustrates the complete experimental workflow for the SCSA, from sample preparation to data acquisition.
Detailed Procedural Notes
- Sample Preparation: Use fresh liquified semen or frozen samples thawed in a 37°C water bath until the last remnant of ice disappears [22]. Dilute the sample in TNE buffer to achieve a concentration of approximately 1-2 x 10^6^ sperm/mL.
- Acid Denaturation: Add 400 µL of acid-detergent solution to 200 µL of the sperm suspension. Vortex immediately and let it sit for exactly 30 seconds. This low-pH treatment denatures DNA at sites of fragmentation [22].
- Staining: Add 1.20 mL of the pre-prepared AO working solution using an automatic dispenser and vortex [22]. Acridine orange will intercalate into double-stranded DNA (emitting green fluorescence) and stack on single-stranded DNA (emitting red fluorescence) [39].
- Flow Cytometric Analysis: Place the sample tube into the flow cytometer and start the sample flow. Begin data acquisition at 3 minutes to allow for AO equilibration and hydrodynamic stabilization [22]. Collect data from at least 5,000 sperm cells, ensuring the flow rate does not exceed 300 cells per second for optimal measurement [22].
- Replication: For verification and statistical rigor, prepare and measure a second aliquot of the sample independently. Do not prepare multiple samples in advance, as delayed measurement can cause staining artifacts [22].
Data Analysis and Interpretation
Gating Strategy and Calculations
The raw flow cytometry data is transformed to calculate the %DFI and %HDS. The following diagram outlines the logical process of data analysis.
Two primary methods are used for data analysis [22]:
- Method 1: The green versus red cytogram is used to directly gate the sperm populations.
- Method 2 (Common): The data is transformed to create a scatter plot of αt (alpha-t; red/[red+green] fluorescence) versus total DNA (red+green fluorescence). A frequency histogram of the αt values is then generated. The %DFI is calculated as the percentage of cells with αt above a predefined threshold [22]. The %HDS is determined from the total DNA parameter as the percentage of sperm with abnormally high green stainability, indicating immature chromatin [39] [22].
Correlation with Other Assays and Parameters
SCSA data shows a strong positive correlation with sperm DNA fragmentation measured by other assays like the TUNEL assay, though SCSA tends to be systematically more sensitive [5] [40]. Furthermore, SCSA parameters show a significant negative correlation with conventional semen parameters such as sperm motility and normal morphology [41]. Importantly, %DFI has been consistently demonstrated to increase linearly with male age, while conventional parameters like sperm count and morphology show less dramatic changes, highlighting the value of SCSA as a sensitive biomarker of male reproductive health [5] [40].
The Scientist's Toolkit: Essential Research Reagent Solutions
Table 3: Key Reagents and Materials for the SCSA Protocol
| Reagent/Material | Function | Specifications & Notes |
|---|---|---|
| Acridine Orange (AO) | Metachromatic fluorescent dye that differentially stains dsDNA (green) and ssDNA (red) [22]. | Prepare a 1 mg/mL stock solution; working concentration is 6 µg/mL. Light-sensitive; store in amber glass bottles [22]. |
| TNE Buffer | Provides a neutral pH environment for initial sperm dilution and stabilization [40] [22]. | 0.15 M NaCl, 0.01 M Tris-HCl, 0.001 M EDTA, pH 7.4. |
| Acid-Detergent Solution | Selectively denatures DNA at sites of strand breaks in sperm chromatin [22]. | 0.08 N HCl, 0.15 M NaCl, 0.1% Triton X-100, pH 1.2. Critical to maintain precise pH and incubation time (30 sec) [22]. |
| Cryotubes | For flash-freezing and storing semen samples prior to analysis [22]. | Use 2-mL tubes. Flash-freezing in liquid nitrogen is required to preserve DNA integrity for later SCSA testing [22]. |
| Reference Semen Samples | Quality control for both sample processing and flow cytometer performance [22]. | Aliquots of well-characterized semen samples stored at -70°C or below. Used to calibrate instrument settings and validate daily protocol [22]. |
| Fluorescent Beads | Used for daily instrument alignment and optical standardization [22]. | e.g., Fluoresbrite Plain YG 6 μ beads. Ensure consistent laser alignment and fluorescence detection over time [22]. |
Data Acquisition and Analysis with SCSAsoft Software
The Sperm Chromatin Structure Assay (SCSA) is a powerful, flow cytometry-based diagnostic tool for assessing sperm DNA integrity and chromatin structure, providing critical insights into male fertility potential [17]. The assay measures the susceptibility of sperm DNA to acid-induced denaturation in situ, which is a key indicator of DNA fragmentation and abnormal chromatin packaging [8] [17]. First developed by Donald P. Evenson in the 1980s, SCSA has become a federally registered protocol with extensive applications in both clinical andrology and toxicology studies [8] [17]. The core principle of the SCSA relies on the metachromatic properties of acridine orange (AO): when intercalated into double-stranded (native) DNA, AO fluoresces green, while it stacks onto single-stranded (denatured) DNA and fluoresces red [17]. The SCSAsoft software is then used to translate these fluorescence signals into clinically relevant parameters, primarily the DNA Fragmentation Index (DFI) and the High DNA Stainable (HDS) fraction, enabling researchers and clinicians to make standardized, objective assessments of semen quality [8] [17].
SCSA Experimental Protocol
Sample Preparation and Staining
The SCSA protocol requires strict adherence to specific steps and reagent conditions to ensure reproducible and clinically relevant results [17] [31] [42]. The procedure can be performed on either fresh or previously frozen raw semen samples.
- Step 1: Sample Dilution. After ejaculation, semen samples are allowed to liquefy for 30 minutes at 37°C. The sample is then diluted in TNE buffer (0.15 mol/L NaCl, 0.01 mol/L Tris, 0.001 mol/L EDTA, pH 7.4) to achieve a final sperm concentration of approximately 1-2 x 10⁶ cells/mL [8] [31]. A 200 µL aliquot of this suspension is used for the assay.
- Step 2: Acid Denaturation. 400 µL of a low-pH detergent solution (0.15 M NaCl, 0.08 M HCl, 0.1% Triton X-100, pH 1.2) is added to the 200 µL sperm aliquot [8] [42]. This solution is mixed strictly for 30 seconds. This critical step denatures the DNA at sites of intrinsic strand breaks, exposing the damaged regions [17].
- Step 3: Acridine Orange Staining. Immediately following acid treatment, 1.2 mL of an Acridine Orange (AO) staining solution (6 µg/mL AO in a buffer containing 0.2 M Na₂HPO₄, 1 mM disodium EDTA, 0.15 M NaCl, 0.1 M citric acid monohydrate, pH 6.0) is added to the mixture [8] [31]. The AO intercalates into double-stranded DNA ( fluorescing green) and stacks onto single-stranded DNA (fluorescing red) [17].
Flow Cytometric Data Acquisition
The stained sperm sample is immediately analyzed using a flow cytometer equipped with a 488 nm argon laser [8] [42].
- Instrument Setup: The flow cytometer must be calibrated according to SCSA specifications. Fluorescence is detected using two filters: a 515-530 nm bandpass filter for green fluorescence (native DNA) and a >630 nm longpass filter for red fluorescence (denatured DNA) [8] [42].
- Data Collection: A minimum of 5,000 to 10,000 individual sperm cells are measured per sample to ensure statistical robustness [8] [17]. The flow cytometer generates a dual-parameter data file, recording the red and green fluorescence intensities for each sperm cell on a 1024 x 1024 channel scale [8].
The following diagram illustrates the complete experimental workflow, from sample preparation to data acquisition.
Data Analysis with SCSAsoft Software
From Raw Data to Clinical Parameters
The raw fluorescence data file generated by the flow cytometer is processed by the proprietary SCSAsoft software to calculate the clinically relevant parameters [17]. The analysis involves a specific sequence of data transformations.
- Step 1: Create Cytogram. The software first plots a cytogram (scatter plot) of Red Fluorescence (X-axis) versus Green Fluorescence (Y-axis) for all measured sperm cells. This visualizes the population distribution based on DNA integrity [17].
- Step 2: Transform Data. The cytogram data is then mathematically transformed. The software calculates the parameter αt (alpha t) for each cell, which is the ratio of red fluorescence to total fluorescence (red + green) [17] [42]. This is a normalized measure of DNA denaturation.
- Step 3: Generate Histogram. A frequency distribution histogram is created from the αt values of all cells. This histogram typically shows a main population of cells with low αt (intact DNA) and a tail of cells with higher αt (fragmented DNA) [17].
The following diagram outlines the logical flow of data analysis within the SCSAsoft software.
Key Parameters and Their Clinical Interpretation
SCSAsoft software calculates two primary parameters that are essential for fertility assessment. The quantitative thresholds for these parameters are summarized in the table below.
Table 1: SCSA Soft Parameters and Clinical Thresholds for Fertility Assessment
| Parameter | Full Name | Description | Clinical Threshold & Interpretation |
|---|---|---|---|
| DFI | DNA Fragmentation Index [17] (Also known as COMPαt; Cells Outside Main Population of αt [17]) | The percentage of sperm cells with significant DNA fragmentation (high αt values) [8] [17]. | < 20%: Excellent fertility potential [17].20% - 30%: Moderate fertility, increased time to pregnancy [17].> 25-30%: Significantly reduced chance of natural or IUI pregnancy; consider ICSI [8] [17]. |
| HDS | High DNA Stainability [17] | The percentage of sperm with immature chromatin, characterized by high green fluorescence due to incomplete protamination [17]. | > 25%: Indicates a high level of immature sperm, which may lead to early embryo death due to abnormal gene expression; associated with pregnancy failure [8] [17]. |
The Scientist's Toolkit: Essential Research Reagents
The following table details the key reagents and materials required to perform the SCSA, along with their specific functions in the assay.
Table 2: Essential Research Reagents for the SCSA Protocol
| Reagent/Material | Function in the SCSA Protocol |
|---|---|
| TNE Buffer [31] | A neutral-pH buffer used to dilute and wash the sperm sample, maintaining cell integrity before denaturation. |
| Acid Detergent Solution (pH 1.2) [8] [42] | A low-pH solution containing Triton X-100 that permeabilizes the sperm cell and nuclear membranes and induces partial DNA denaturation at sites of DNA strand breaks. |
| Acridine Orange (AO) Stain [8] [31] | A metachromatic fluorochrome that differentially stains double-stranded (green fluorescence) and single-stranded (red fluorescence) DNA, enabling the quantification of DNA damage. |
| Flow Cytometer [8] [17] | An instrument equipped with a 488 nm laser and appropriate filters to simultaneously measure red and green fluorescence from thousands of individual sperm cells rapidly and objectively. |
| SCSAsoft Software [17] | The proprietary software that analyzes the raw flow cytometry data, performs the αt transformation, and calculates the final clinical parameters (DFI and HDS). |
The Sperm Chromatin Structure Assay (SCSA) is a federally registered, flow cytometric protocol for the simultaneous measurement of sperm DNA integrity and chromatin structure, providing critical predictive information on male fertility potential that extends beyond standard semen analysis [8] [43]. This assay quantitatively assesses two fundamental parameters: the DNA Fragmentation Index (DFI), which represents the percentage of sperm with significant DNA strand breaks, and High DNA Stainability (HDS), which indicates the proportion of sperm with immature chromatin characterized by abnormal protein composition and/or poor chromatin condensation [8] [43]. Over 35 years of development and validation through numerous peer-reviewed publications have established the SCSA as a robust tool for identifying men with reduced likelihood of achieving term pregnancy through natural conception or assisted reproductive technologies (ART) [6] [43].
The clinical utility of SCSA stems from its ability to detect sperm chromatin abnormalities that conventional semen parameters (count, motility, morphology) often miss [5] [43]. Sperm chromatin, composed of DNA and proteins, undergoes extensive remodeling during spermatogenesis, where histones are largely replaced by protamines to achieve extreme nuclear compaction [44]. Disruptions in this process or subsequent oxidative damage can lead to DNA fragmentation and chromatin defects that impair paternal genetic contribution to the embryo, affecting fertilization, embryo development, and pregnancy outcomes [45] [44] [46].
Clinical Thresholds and Interpretation
DNA Fragmentation Index (DFI) Thresholds
The DFI represents the percentage of sperm in a sample with denatured DNA characterized by significant single- or double-strand breaks [8] [27]. Extensive clinical studies have established clear threshold values that correlate with reproductive outcomes, creating a standardized framework for fertility assessment [46] [43].
Table 1: DFI Thresholds and Clinical Significance
| DFI Range | Fertility Potential | Clinical Implications |
|---|---|---|
| < 15% | Excellent to Good | Favorable pregnancy outcomes without female factor infertility |
| 15% - 25% | Good to Fair | Moderate fertility potential |
| 25% - 40% | Fair to Poor | Significantly reduced pregnancy rates; consider ART modifications |
| > 40% | Very Poor | Minimal chance of pregnancy; strongly recommend ICSI |
These thresholds are particularly predictive for natural conception and intrauterine insemination (IUI) outcomes [46] [43]. A multi-center prospective study established a specific DFI cutoff of 26% for IUI, where couples with DFI exceeding this threshold had significantly fewer clinical pregnancies (OR 0.0326; 95% CI 0.0019 to 0.5400; p = 0.017) [46]. For in vitro fertilization (IVF), DFI > 25% suggests that intracytoplasmic sperm injection (ICSI) may be preferable to conventional IVF [8].
Multiple factors contribute to elevated DFI, including oxidative stress, disease, diet, drug use, high fever, elevated testicular temperature, air pollution, cigarette smoking, and advanced age (particularly upper 40s and beyond) [45] [43]. A recent large-scale study (N=21,851) demonstrated that exposure to fine particulate matter air pollution (PM2.5) was significantly associated with increased DFI (estimate=0.45; P=0.0025), with a nonlinear dose-response pattern peaking at approximately 11 µg/m³ [45].
High DNA Stainability (HDS) Thresholds and Current Understanding
HDS measures the percentage of sperm with high DNA stainability, historically interpreted as reflecting nuclear immaturity due to incomplete protamination and aberrant chromatin condensation [8] [43]. However, recent evidence challenges the clinical utility and biological significance of HDS.
Table 2: HDS Thresholds and Interpretive Challenges
| Parameter | Traditional Interpretation | Current Evidence |
|---|---|---|
| Clinical Threshold | > 15-25% considered elevated | > 25% considered elevated [8] |
| Biological Significance | Indicator of sperm nuclear immaturity with unprocessed nuclear proteins and/or poorly condensed chromatin [43] | Weak correlation with established nuclear maturity tests (CMA3, AB, TB) [44] |
| Impact on Fertilization | Suggested lower fertilization rates with conventional IVF [43] | No demonstrated correlation with classic clinical infertility patterns (asthenozoospermia, teratozoospermia) [44] |
| Relationship with ART Outcomes | Theoretical concern for abnormal gene expression in embryos [8] | Poor predictive value for ART outcomes; one study reported paradoxical positive relationship with high-quality embryo rate [26] |
The SCSA Diagnostics clinical report indicates that semen samples with HDS > 15% may have lower fertilization rates with conventional IVF but not with ICSI [43]. However, contemporary research raises questions about this interpretation. A 2020 study comparing SCSA with multiple sperm nuclear integrity tests found that "HDS correlates poorly with most tests that focus specifically on the level of maturity of the sperm nucleus" and "does not appear to be a reliable indicator of nuclear immaturity" [44]. Similarly, a 2025 retrospective cohort study (N=3,970 couples) concluded that "HDS might not be an appropriate marker for male fertility" [26].
Notably, while DFI shows a well-established increase with advancing male age, HDS remains relatively unchanged during aging, further questioning its biological significance [5]. This evolving understanding necessitates cautious interpretation of HDS values in clinical practice.
SCSA Methodology and Protocol
Sample Collection and Preparation
Proper sample collection and handling are critical for reliable SCSA results. The standardized protocol ensures consistency across assessments [8].
Basic Protocol 1: Sperm Chromatin Structure Assay
Sample Collection: Collect raw semen samples via masturbation into sterile containers after 2-7 days of sexual abstinence. Record abstinence duration precisely as it influences DFI values [26].
Sample Shipping:
- Pipette a small portion of raw, liquefied semen into a cryogenic tube
- Immediately place tube in a pre-cooled dry shipper where the sample flash-freezes
- Ship via overnight carrier to a CLIA-certified SCSA laboratory (SCSA Diagnostics is currently the only CLIA-approved facility) [43]
Sample Preparation:
- Thaw frozen semen samples if necessary (SCSA validated for fresh or frozen/thawed specimens)
- Dilute samples in TNE buffer (0.01 M Tris-HCl, 0.15 M NaCl, 1 mM EDTA, pH 7.4) to a concentration of 1-2×10⁶ sperm/ml
- Note: Samples with very low sperm counts (<500,000/ml to 750,000/ml) and/or high levels of seminal debris may yield inconclusive results [43]
DNA Denaturation and Staining
The core SCSA methodology involves controlled DNA denaturation followed by specific fluorescent staining [8]:
Acid Denaturation:
- Treat diluted sperm suspension with low-pH buffer (0.08 M HCl, 0.15 M NaCl, 0.1% v/v Triton X-100, pH 1.20) for 30 seconds
- This critical step preferentially denatures DNA at sites of strand breaks while leaving intact DNA largely double-stranded
Acridine Orange Staining:
- Immediately after denaturation, stain samples with acridine orange (AO) solution (6 µg/mL AO in 0.1 M citric acid, 0.2 M Na₂HPO₄, 1 mM EDTA, 0.15 M NaCl, pH 6.0)
- AO intercalates into double-stranded DNA (emitting green fluorescence at 515-530 nm) and stacks onto single-stranded DNA (emitting red fluorescence at >630 nm)
- Incubate for 3 minutes before flow cytometric analysis
Flow Cytometric Analysis and Data Interpretation
SCSA employs precise flow cytometry conditions to ensure reproducible results [8]:
Instrument Setup:
- Use a flow cytometer equipped with a 488 nm excitation laser
- Set green fluorescence detector with 515-530 BP filter
- Set red fluorescence detector with 630 LP filter
- Calibrate daily using reference samples with known DFI values
Data Acquisition:
- Analyze 5,000-10,000 events per sample at a rate of ~200-300 cells/second
- Record both green (dsDNA) and red (ssDNA) fluorescence parameters for each cell
Data Analysis (Two Methods) [8]:
- Method A: Create a scatter plot of green versus red fluorescence and set computer-gated regions to determine %DFI and %HDS
- Method B: Transform data to total DNA stainability (red + green fluorescence) versus alpha-t (red/red+green fluorescence), generate frequency histogram, and calculate %DFI from the histogram
Research Applications and Methodological Considerations
SCSA in Environmental and Toxicological Research
The sensitivity of SCSA to environmental exposures makes it valuable for reproductive toxicology studies. Recent research demonstrates its utility in identifying specific reproductive toxicants:
Air Pollution: A large cross-sectional study (N=21,851) utilizing SCSA revealed that exposure to fine particulate matter (PM2.5) was significantly associated with increased DFI, showing a nonlinear dose-response relationship that peaked at approximately 11 µg/m³ [45]. Notably, this study identified a significant interaction between PM2.5 exposure and socioeconomic status (estimate=0.45; P=0.0148), with men from lower SES areas experiencing stronger pollution-related DNA damage [45].
Metal Exposure: A case-control study (N=590) measuring 13 metals in seminal plasma found that chromium (Cr) levels were positively associated with DFI, HDS, and idiopathic oligoasthenoteratozoospermia (iOAT) risk [27]. Thallium (Tl) exposure was similarly associated with increased DFI and iOAT risk, with mediation analysis showing that DFI mediated 63.29% of the effect of Tl on iOAT risk [27]. In contrast, HDS did not significantly mediate the relationship between metal exposure and iOAT risk, further questioning its biological significance [27].
Comparative Methodological Studies
Understanding SCSA performance relative to other sperm DNA integrity tests is essential for methodological decisions in research:
SCSA vs. TUNEL: A large-scale study (N≈10,000) directly comparing SCSA and flow cytometry-assisted TUNEL demonstrated that both assays produce concordant data on sperm DNA fragmentation, though TUNEL systematically yields lower fragmentation values than SCSA [5]. Both tests identified a linear increase in DNA fragmentation with advancing age, while HDS remained unchanged [5]. Researchers should consider these methodological differences when comparing studies or establishing laboratory-specific thresholds.
SCSA Advantages: The SCSA provides superior statistical robustness through rapid, machine-based measurement of thousands of sperm, compared to microscope-based tests (COMET, SCD) that typically assess only 50-200 cells per sample [6]. The standardized, fixed SCSA protocol facilitates cross-study comparisons, unlike the numerous variations existing for other sperm DNA fragmentation tests [6].
Essential Research Reagents and Materials
Table 3: Key Research Reagents for SCSA Implementation
| Reagent/Equipment | Specification | Research Function |
|---|---|---|
| Acridine Orange | Cell-permeable nucleic acid binding dye | Differential staining of dsDNA (green) and ssDNA (red) |
| TNE Buffer | 0.01 M Tris-HCl, 0.15 M NaCl, 1 mM EDTA, pH 7.4 | Sample dilution and maintenance of chromatin integrity |
| Acid Denaturation Buffer | 0.08 M HCl, 0.15 M NaCl, 0.1% Triton X-100, pH 1.20 | Selective denaturation of DNA at strand break sites |
| Staining Buffer | 0.1 M citric acid, 0.2 M Na₂HPO₄, 1 mM EDTA, 0.15 M NaCl, pH 6.0 | Optimal environment for acridine orange binding |
| Flow Cytometer | 488 nm laser, 515-530 BP and 630 LP filters | Quantitative multiparameter analysis of individual sperm |
| Reference Samples | Pre-tested samples with known DFI values | Daily instrument calibration and quality control |
The SCSA provides robust, quantitative assessment of sperm DNA integrity through standardized measurement of DFI and HDS. Well-validated DFI thresholds (<15% excellent to >40% very poor) strongly predict fertility potential across natural conception and assisted reproduction, while the biological and clinical significance of HDS remains uncertain based on contemporary evidence. The methodology offers particular utility in environmental reproductive health research, reliably detecting sperm chromatin damage associated with exposures to air pollutants and metals. Proper implementation of the standardized SCSA protocol—from controlled sample collection through specific denaturation and staining conditions to rigorous flow cytometric analysis—ensures generation of reliable, actionable data for both clinical assessment and research applications.
The Sperm Chromatin Structure Assay (SCSA) is widely recognized as a diagnostic tool for male infertility, providing a robust measure of sperm DNA fragmentation through the DNA Fragmentation Index (DFI) [17]. However, its applications extend far beyond the clinical fertility setting. The SCSA serves as a sensitive and objective biomarker for assessing sperm nuclear DNA integrity in toxicology studies and broader sperm quality research [47] [17]. The assay's precision, flow cytometry-based rapid analysis of thousands of sperm, and minimal subjective bias make it particularly valuable for detecting the subtle, damaging effects of various genotoxic agents on the male germ line [36] [47]. This application note details the experimental protocols and summarizes key research findings that establish the SCSA as a critical tool for researchers and drug development professionals.
SCSA in Toxicology and Sperm Quality Research
Core Principle and Quantitative Measures
The SCSA indirectly quantifies sperm DNA strand breaks by measuring its susceptibility to acid-induced denaturation in situ, followed by staining with the metachromatic dye Acridine Orange (AO) [36] [17]. Sperm with intact double-stranded DNA fluoresce green, while those with DNA fragmentation (single-stranded DNA) fluoresce red due to the metachromatic shift of aggregated AO molecules [17]. Flow cytometry analysis of this red and green fluorescence provides two primary quantitative parameters, detailed in Table 1.
Table 1: Core SCSA Parameters for Research Applications
| Parameter | Full Name & Description | Research Interpretation |
|---|---|---|
| DFI | DNA Fragmentation Index (Also known as COMPαt, Cells Outside Main Population) [17]. Percentage of sperm with DNA damage, indicated by high red fluorescence [36] [17]. | Primary indicator of genotoxic damage. An increase in DFI is a direct, dose-dependent response to exposure to reproductive toxicants [47]. |
| HDS | High DNA Stainable fraction [17]. Percentage of sperm with immature chromatin, indicated by high green fluorescence due to incomplete protamination [48] [17]. | Indicator of disturbances in spermiogenesis (sperm maturation). Elevated HDS suggests defective protamine exchange, often linked to oxidative stress or other toxic insults [17]. |
Key Advantages for Research
The SCSA offers distinct advantages that make it suitable for toxicology and quality control research, as summarized in Table 2.
Table 2: Advantages of SCSA for Toxicology and Sperm Quality Research
| Feature | Description | Benefit for Research |
|---|---|---|
| Objective & Robust | Flow cytometric analysis of 5,000-10,000 sperm per sample in seconds [36] [47]. | Provides high statistical power, exceptional precision, and low intra- and inter-laboratory variation, which is crucial for detecting subtle treatment effects [36] [47]. |
| Dose-Response Capability | The assay has demonstrated excellent, low variability dose-response data in genotoxic experiments [47]. | Validates the SCSA as a highly powerful assay for quantifying the extent of sperm DNA damage in response to varying levels of a toxicant [47]. |
| High-Throughput | Rapid machine-based measurement allows for processing large sample volumes efficiently [17]. | Ideal for screening studies in toxicology or for monitoring sperm quality in livestock and laboratory animal breeding programs [17]. |
Research Reagent Solutions
The following table lists the essential materials and reagents required to perform the SCSA according to the standardized protocol.
Table 3: Essential Research Reagents and Materials for SCSA
| Reagent/Material | Function & Specification |
|---|---|
| TNE Buffer | A buffered saline solution (0.15M NaCl, 0.01M Tris-HCl, 1mM EDTA, pH 7.4) used for diluting and washing sperm samples [17]. |
| Acid Denaturation Solution | Low-pH solution (pH ~1.2) containing 0.15M NaCl, 0.08M HCl, and 0.1% Triton X-100. Induces partial denaturation of DNA at the sites of strand breaks [17]. |
| Acridine Orange (AO) Staining Solution | Metachromatic fluorescent dye (6 µg/mL in a phosphate-citrate buffer, pH 6.0). Intercalates into double-stranded DNA (green fluorescence) and aggregates on single-stranded DNA (red fluorescence) [17]. |
| Flow Cytometer | Instrument equipped with a 488 nm (blue) excitation laser and filters for detecting green (FITC, ~530 nm) and red (PI, >630 nm) fluorescence [17]. |
| SCSAsoft Software | Proprietary software for data analysis. Converts flow cytometry data into scatter plots and histograms to calculate DFI and HDS [36] [17]. |
Experimental Protocols
Standard SCSA Protocol for Human or Animal Sperm
This protocol is adapted from the trademarked SCSA protocol developed by Evenson et al. [17].
Step 1: Sample Preparation
- Fresh or frozen semen samples can be used. For frozen samples, thaw in a 37°C water bath for 3-5 minutes [17].
- Dilute the sample in TNE buffer to a concentration of 1-2 x 10⁶ sperm/mL. For a standard test, 200 µL of this suspension is used [17].
Step 2: Acid-Induced Denaturation
- Add 400 µL of the pre-prepared acid denaturation solution (pH 1.2) directly to the 200 µL sperm suspension.
- Incubate exactly for 30 seconds. This brief, low-pH treatment denatures DNA specifically at sites of breaks or defects [17].
Step 3: Acridine Orange Staining
- Immediately after the 30-second denaturation, add 1.2 mL of the Acridine Orange staining solution (6 µg/mL) to the test tube.
- The stained sample should be analyzed by flow cytometry within 3-10 minutes to ensure staining stability [17].
Step 4: Flow Cytometric Analysis
- Analyze the sample using a flow cytometer equipped with a 488 nm laser.
- Set instrument gains so that the main population of sperm cells (αt population) is centered on the cytogram for a reference control sample.
- Acquire data for a minimum of 5,000 events (sperm) per sample to ensure statistical robustness [36] [17].
Step 5: Data Analysis
- Use the SCSAsoft software to generate a scatter plot (red vs. green fluorescence) and a corresponding frequency histogram.
- The software automatically calculates the key parameters: DFI (%) and HDS (%) [36] [17].
The following workflow diagram illustrates the key steps of the standard SCSA protocol:
Protocol for Toxicology Studies
The SCSA can be integrated into standard toxicology study designs to assess the impact of chemicals, environmental agents, or pharmaceuticals on sperm DNA quality.
Experimental Design:
- Treatment Groups: Include a control group and multiple dose-level groups of the test compound (e.g., low, medium, high) administered to laboratory animals (e.g., rodents) for a defined duration.
- Sample Collection: Collect sperm from the cauda epididymis or via ejaculate at the end of the treatment and a potential recovery period.
- Sample Processing: Process all samples identically using the Standard SCSA Protocol outlined in section 4.1.
Data Interpretation:
- A statistically significant, dose-dependent increase in the mean DFI of treated groups compared to the control group is a clear indicator of genotoxicity [47].
- An increase in the HDS parameter may suggest that the toxicant disrupts the late stages of spermatogenesis (spermiogenesis), specifically the histone-to-protamine transition [17].
The logical framework for interpreting SCSA results in a toxicological context is shown below:
Key Research Findings and Data
Research using the SCSA has quantified the impact of various extrinsic factors on sperm DNA integrity. Table 4 summarizes findings from toxicological and sperm quality studies.
Table 4: SCSA Research Findings on Extrinsic Factors Affecting Sperm DNA
| Factor | SCSA Findings & Quantitative Impact | Research Context |
|---|---|---|
| Age | Older males show increased sperm DNA fragmentation (DFI) and decreased frequency of apoptosis, suggesting deteriorated sperm selection and quality [17]. | Human and animal studies comparing young vs. older subjects [17]. |
| Smoking | Significantly elevated levels of seminal ROS and oxidative DNA damage, leading to increased apoptosis and DFI [17]. Comparative studies show a clear increase in DFI in smokers versus non-smokers [17]. | Human observational studies [17]. |
| Heat Stress | Testis overheating is associated with impaired sperm chromatin integrity and reduced fertility potential [17]. | Studies involving febrile illness, varicocele, or occupational heat exposure [17]. |
| Genotoxic Agents | The SCSA shows excellent dose-response data with very low coefficients of variation, validating it for detecting DNA damage from chemical toxicants [47]. | Controlled laboratory experiments exposing animals to known reproductive toxicants [47]. |
| Alcohol Use | A retrospective analysis indicated that alcohol use can negatively affect sperm chromatin structure, increasing DNA fragmentation [41]. | Clinical study analyzing patient data [41]. |
The SCSA transcends its role as a mere infertility diagnostic, proving to be an indispensable tool in toxicology and advanced sperm quality research. Its objective, quantitative, and high-throughput nature allows for the sensitive detection of genotoxic effects and subtle perturbations in spermatogenesis. The standardized protocol ensures reproducibility across studies, making SCSA-derived DFI and HDS values reliable biomarkers for researchers assessing the impact of environmental, chemical, and pharmaceutical agents on male reproductive health. Its continued application will be vital for drug safety testing, environmental risk assessment, and the preservation of genetic quality in assisted reproduction and animal husbandry.
Troubleshooting SCSA Assay: Enhancing Precision and Addressing Common Pitfalls
The reliability of the Sperm Chromatin Structure Assay (SCSA) is critically dependent on rigorous pre-analytical procedures, particularly the management of freeze-thaw cycles and the composition of cryopreservation buffers. This application note synthesizes current research to detail the quantifiable impact of these factors on sperm DNA fragmentation (SDF) and chromatin integrity. We provide evidence-based protocols designed to standardize sample preparation, mitigate DNA damage, and ensure the analytical integrity of SCSA results for research and clinical diagnostics.
The Sperm Chromatin Structure Assay (SCSA) is a flow cytometric technique that provides a robust, quantitative assessment of sperm DNA integrity, a parameter critically associated with male fertility outcomes [6] [17]. The assay measures the susceptibility of sperm DNA to acid-induced denaturation in situ, reporting the DNA Fragmentation Index (DFI) and the High DNA Stainability (HDS) as key clinical parameters [22] [17]. However, the diagnostic validity of SCSA is profoundly influenced by pre-analytical conditions. The process of cryopreservation and thawing—essential for sample logistics and storage—can induce iatrogenic DNA damage, compromising data quality [49] [50]. This note delineates the impact of freeze-thaw cycles and buffer composition on sperm chromatin, and establishes optimized protocols to preserve sample integrity.
The Impact of Freeze-Thaw Cycles on Sperm Chromatin
Repeated freezing and thawing of semen samples induces cumulative stress, leading to structural and DNA damage. The following data summarize the specific effects of multiple freeze-thaw cycles.
Table 1: Impact of Repeated Freeze-Thaw Cycles on Sperm DNA and Quality Parameters
| Freeze-Thaw Cycles | Sperm DNA Fragmentation (%DFI) | Sperm Motility (%) | Vitality (%) | Key Findings |
|---|---|---|---|---|
| Fresh (0 cycles) | Baseline | Baseline | Baseline | Reference values pre-freezing [50] |
| 1 Cycle | Significant increase | Significant decrease | Significant decrease | Initial cycle causes the most pronounced damage to motility and vitality [50] |
| 2 Cycles | Further significant increase | Further decrease | Further decrease | Cumulative damage observed [50] |
| 3 Cycles | Further significant increase | Lowest levels | Lowest levels | DFI remains elevated; cell survival metrics are severely impacted [50] |
A pivotal study demonstrated that the percentage of sperm DNA fragmentation rises significantly following each successive freeze-thaw cycle [50]. Crucially, the protocol for handling samples between cycles is a major determinant of damage. Samples that were not washed and were refrozen in their original cryoprotectant exhibited significantly lower levels of DNA fragmentation and higher cell survival compared to samples that underwent washing and the addition of fresh cryoprotectant between cycles [50]. This underscores the importance of minimizing procedural manipulation during re-freezing.
Beyond sperm cells, the damaging principle of freeze-thaw cycles is also observed in protein biochemistry. Studies on protein isolates reveal that multiple cycles can induce protein aggregation, oxidation (measured by increased carbonyl content), and alterations in secondary structure, reinforcing the concept that cyclic phase transitions are inherently disruptive to biomolecular integrity [51] [52].
The Role of Buffer Composition and Cryoprotectants
The choice of cryoprotective agents (CPAs) is a critical factor in mitigating the damage caused by freezing. Different buffer formulations offer varying levels of protection for sperm DNA and function.
Table 2: Efficacy of Different Cryoprotectant Media on Sperm Quality Post-Thaw
| Cryoprotectant Medium | Impact on DNA Fragmentation | Impact on Motility & Morphology | Notes & Mechanism |
|---|---|---|---|
| Egg Yolk + Glycerol | Moderate increase post-thaw | Better preservation of motility; slight increase in morphological abnormalities | Egg yolk lipids protect the sperm plasma membrane; a widely used and effective combination [53] |
| Sucrose + Glycerol | Moderate increase post-thaw | Comparable preservation to egg-yolk based media | Sucrose acts as a non-penetrating osmolyte, helping to stabilize the cell against osmotic shock [53] |
| Glycerol Alone | Pronounced increase | Poorer preservation of motility and morphology | Lacks supplementary stabilizing agents, offering inadequate protection compared to complex media [53] |
The composition of the aqueous buffer itself is equally vital. For instance, in phosphate-buffered systems, a dangerous pH shift can occur during freezing. This is caused by the selective crystallization of disodium hydrogen phosphate (Na₂HPO₄), which lowers the pH of the unfrozen fraction dramatically—sometimes by over 3 units [52]. This acidic shift can denature proteins and aggravate DNA fragmentation. Strategies to mitigate this include:
- Using low buffer concentrations (e.g., 10 mM) to minimize the crystallizable solute mass [52].
- Incorporating non-crystallizing excipients like cellobiose or sucrose, which inhibit buffer salt crystallization and thus stabilize the pH throughout the freeze-thaw process [52].
Optimized SCSA Protocol with Detailed Workflow
The following is a standardized protocol for SCSA sample preparation, incorporating best practices for freeze-thaw and buffer use.
Materials and Reagents
Research Reagent Solutions
| Reagent/Buffer | Function/Description |
|---|---|
| TNE Buffer | Primary dilution buffer for sperm, containing Tris, NaCl, and EDTA to maintain a stable osmotic environment and pH. |
| Acid Detergent Solution (pH 1.2) | Induces partial denaturation of sperm DNA at sites of strand breaks. Contains 0.15M NaCl, 0.08M HCl, and 0.1% Triton X-100 [22] [17]. |
| Acridine Orange (AO) Staining Solution | Metachromatic dye that intercalates into double-stranded DNA (green fluorescence) and binds to single-stranded DNA (red fluorescence) [22]. |
| Cryoprotectant Medium (e.g., with Egg Yolk & Glycerol) | Protects sperm from ice crystal formation and osmotic shock during freeze-thaw cycles [53]. |
Step-by-Step Procedure
- Sample Collection and Initial Processing: Collect semen sample into a sterile container and allow it to liquefy for 30 minutes at 37°C [17].
- Cryopreservation for SCSA:
- Gently mix the liquefied sample with an equal volume of a validated cryoprotectant medium (e.g., containing egg yolk and glycerol) [53].
- Aliquot the mixture into cryovials.
- Employ a controlled freezing protocol: place vials at -20°C for 30 minutes, then in liquid nitrogen vapor (at -80°C to -100°C) for 10-15 minutes, before final storage in liquid nitrogen (-196°C) [53].
- Critical Note: For long-term storage and shipping, flash-freezing in a liquid nitrogen dry shipper is recommended. If re-freezing is unavoidable, do not wash the sample or alter the cryoprotectant; refreeze in the original medium to minimize additional DNA fragmentation [50].
- Thawing and Preparation for Assay:
- Acid Denaturation and Staining:
- Flow Cytometric Analysis:
- Within 3-10 minutes of staining, place the sample tube into the flow cytometer and start sample flow [22].
- Collect data from at least 5,000 events (sperm) per sample using a 488 nm laser for excitation.
- Measure green fluorescence (FITC filter, 515-530 nm) for double-stranded DNA and red fluorescence (long-pass filter, >630 nm) for single-stranded DNA [22] [17].
- Data Analysis:
- Analyze the flow cytometry data using dedicated software (e.g., SCSAsoft).
- Calculate the DNA Fragmentation Index (%DFI), defined as the ratio of red to total (red + green) fluorescence, representing the percentage of sperm with DNA damage [22] [17].
- Calculate the High DNA Stainability (%HDS), representing the percentage of sperm with immature chromatin [22] [17].
The integrity of SCSA data is highly dependent on standardized sample preparation. To minimize cryo-damage and ensure reliable results, the following evidence-based practices are recommended:
- Limit Freeze-Thaw Cycles: Ideally, freeze and thaw a sample only once. If multiple cycles are unavoidable, refreeze the sample in its original cryoprotectant medium without washing [50].
- Select a Protective Cryomedium: Use a complex cryoprotectant such as one containing egg yolk and glycerol, which provides superior protection for sperm DNA and membranes compared to glycerol alone [53].
- Stabilize Buffer pH: Be aware of the potential for pH shifts in phosphate buffers during freezing. Mitigate this risk by using lower buffer concentrations or adding non-crystallizing stabilizers like sugars [52].
- Adhere to a Fixed SCSA Protocol: Follow the registered SCSA protocol meticulously, including precise timings for acid denaturation and staining, to ensure inter-laboratory reproducibility and clinical relevance of the DFI and HDS values [22] [6] [17].
By integrating these optimized preparation strategies, researchers and clinicians can significantly enhance the accuracy and diagnostic power of the Sperm Chromatin Structure Assay.
The Sperm Chromatin Structure Assay (SCSA) is widely recognized as a robust tool for measuring sperm DNA fragmentation (SDF), a key parameter in male fertility assessment [36]. Its utility in both clinical and research settings hinges on the reliability and reproducibility of its results. A foundational multi-laboratory study demonstrated exceptional inter-laboratory consistency, with correlations of 0.9886 (p<0.001) for SCSA %DFI measurements across different sites and flow cytometer types [32]. This high level of concordance confirms that standardized SCSA protocols can yield highly reproducible data, establishing it as a more reliable method compared to many other sperm DNA integrity tests which often suffer from significant inter-laboratory variation [54] [55] [36]. This application note details the specific strategies and protocols necessary to achieve and maintain this level of standardization, ensuring data integrity across multiple sites and over time.
Quantitative Comparison of SCSA with Other SDF Assays
Understanding the performance of SCSA relative to other available tests is crucial for appreciating its role in a standardized laboratory setting.
Table 1: Comparison of Sperm DNA Fragmentation (SDF) Assays
| Assay Name | Principle of Measurement | Key Advantages | Key Disadvantages/Limitations | Reported Inter-Lab Correlation |
|---|---|---|---|---|
| SCSA [55] [36] | Measures susceptibility of sperm DNA to acid-induced denaturation using acridine orange and flow cytometry. | High repeatability and precision; measures thousands of cells rapidly; low intra- and inter-laboratory variation; established clinical thresholds. | Requires expensive flow cytometry instrumentation and highly skilled technicians. | R² = 0.9886 (p<0.001) [32] |
| TUNEL [55] [56] | Enzymatically incorporates fluorescent dUTP into single- and double-strand DNA breaks. | Sensitive and reliable with minimal inter-observer variability; can be performed on few sperm. | Lack of strict standardization leads to multiple cut-off values; difficult inter-lab comparisons. | Well correlated with SCSA, but systematically yields lower % SDF values [5]. |
| SCD (Halo Test) [54] [55] | Assesses dispersion of DNA fragments after denaturation and removal of nuclear proteins. | Simple, affordable, and does not require complex instrumentation. | Subjective assessment under microscope leads to inter-observer variability. | Shows strong correlation with DNA maturity, but inter-lab precision data is less established [54]. |
| Comet Assay [55] [56] | Electrophoretic assessment of DNA fragments from lysed sperm. | Highly sensitive; can be performed on very low sperm counts. | Requires an experienced observer; significant inter-observer variability; not standardized. | Lacks comprehensive multi-laboratory reproducibility data. |
Essential Reagents and Equipment
The following toolkit is mandatory for the execution of a standardized SCSA protocol.
Table 2: Research Reagent Solutions and Essential Materials for SCSA
| Item Name | Specification/Function | Critical Notes for Standardization |
|---|---|---|
| Acridine Orange (AO) [57] [36] | Metachromatic dye that fluoresces green when bound to native DNA and red when associated with denatured DNA. | Must be chromatographically purified. Stock and working solutions require precise preparation and storage in the dark [54]. |
| TNE Buffer [54] | Dilution buffer (0.15 M NaCl, 0.01 M Tris, 0.001 M EDTA, pH 7.4). | Maintain precise pH and osmolarity. Sterile filtration is recommended. |
| Acid Denaturation Buffer [54] [32] | Low-pH detergent solution (0.08 N HCl, 0.15 M NaCl, 0.1% Triton X-100, pH ~1.2). | The pH, detergent concentration, and exposure time (30 seconds) are critical and must be strictly adhered to [32]. |
| Flow Cytometer [32] [36] | Equipped with a 488 nm excitation laser and filters for green (515-530 nm) and red (>630 nm) fluorescence. | Regular calibration with fluorescent beads is essential. Instrument performance must be verified before each run. |
| Cryotubes and LN₂ [32] | For sample freezing and storage. | Consistent freezing and thawing protocols are vital. Samples should be rapidly frozen in liquid nitrogen vapor and thawed in a 37°C water bath for immediate analysis [32]. |
Standardized SCSA Protocol Workflow
The following diagram and detailed protocol outline the critical steps for performing a standardized SCSA.
Diagram 1: Visual overview of the key stages in the standardized Sperm Chromatin Structure Assay (SCSA) protocol.
Detailed Experimental Protocol
- Sample Preparation: Fresh or frozen semen samples can be used. For frozen samples, rapid thawing in a 37°C water bath is critical [32]. Dilute the sample in TNE buffer to a concentration of <2 x 10⁶ sperm/mL [54].
- Acid Denaturation: Place the diluted sample on ice. Pipette 200 µL of the sample into a tube containing 400 µL of pre-chilled (4°C) acid denaturation buffer. Mix gently and incubate for exactly 30 seconds [54] [32].
- Staining: After the 30-second denaturation, immediately add 1.2 mL of Acridine Orange staining solution (6 µg/mL, prepared in citrate-phosphate buffer, pH 6.0) to the tube [54].
- Flow Cytometric Analysis: Within 3 minutes of staining, place the sample in the flow cytometer chamber. Analyze a minimum of 5,000 spermatozoa per sample [32] [36]. Set the flow cytometer with a 488 nm excitation laser. Use a 515/530 nm bandpass filter for green fluorescence (native DNA) and a >630 nm longpass filter for red fluorescence (denatured DNA).
- Data Analysis: Use specialized software (e.g., SCSAsoft) to generate scatter plots. The DNA Fragmentation Index (%DFI) is calculated as the ratio of red to total (red + green) fluorescence, expressed as a percentage [32] [36]. Sperm with high green fluorescence (high DNA stainability, %HDS) are identified as those with immature chromatin [32].
Quality Control and Validation Procedures
Calculating and Monitoring Precision
To quantitatively assess assay precision, the Coefficient of Variability (CV) must be calculated for both intra- and inter-assay performance [58].
- Intra-Assay CV: This measures the repeatability within a single assay run. Analyze a single sample in duplicate or triplicate in the same run. For each sample, calculate the CV (%)= (Standard Deviation / Mean) x 100. The average CV from all duplicate pairs in the run is the intra-assay CV. An intra-assay CV of less than 10% is considered acceptable [58].
- Inter-Assay CV: This measures the consistency between different assay runs (e.g., different days). A quality control sample (e.g., a frozen aliquot of a well-characterized semen sample) should be included in every run. Calculate the mean %DFI for this QC sample from each run, then determine the overall mean, standard deviation, and CV of these means. An inter-assay CV of less than 15% is generally acceptable [58].
Table 3: Interpretation of Coefficient of Variability (CV) Metrics
| CV Type | Calculation Basis | Acceptable Threshold | Corrective Action if Exceeded |
|---|---|---|---|
| Intra-Assay CV [58] | Average of CVs from all duplicate samples in a single run. | < 10% | Check pipette calibration and technique; ensure sample mixing is consistent. |
| Inter-Assay CV [58] | CV derived from the mean values of a quality control sample across multiple runs. | < 15% | Verify reagent preparation and storage; re-calibrate flow cytometer; review staining and incubation timings. |
Protocol for Inter-Laboratory Calibration
For multi-center studies, additional harmonization is required.
- Shared QC Material: Distribute aliquots of the same frozen, well-characterized semen sample to all participating laboratories [32].
- Standardized Instrument Setup: Use a predefined flow cytometer configuration, including laser power, voltage settings for photomultiplier tubes (PMTs), and compensation [59].
- Cross-Lab Comparison: All labs analyze the shared QC material using the core SCSA protocol. Results are compiled centrally, and %DFI values are compared. The goal is a correlation coefficient of >0.95 [32] [57]. Discrepancies should trigger a review of technical execution, reagent quality, and instrument calibration.
The SCSA is a powerful tool for assessing sperm DNA integrity, but its clinical and research value is maximized only through rigorous standardization. This involves strict adherence to a detailed protocol, with particular attention to critical steps such as acid denaturation time, reagent quality, and consistent flow cytometer setup. By implementing the quality control measures and validation procedures outlined here—including routine calculation of intra- and inter-assay CVs and inter-laboratory calibration—researchers and clinicians can ensure the generation of precise, accurate, and reproducible SCSA data. This reliability is fundamental for meaningful multi-center trials, robust diagnostic applications, and confident clinical decision-making.
Flow cytometry is a powerful analytical technique that enables the rapid quantification of various cellular characteristics at a single-cell level. Its application to the Sperm Chromatin Structure Assay (SCSA) provides a robust method for measuring sperm DNA fragmentation (%DFI), a critical parameter in fertility assessment [60]. However, the accuracy and reproducibility of SCSA and similar flow cytometric assays depend heavily on two fundamental technical aspects: precise laser alignment for consistent cell illumination and optimized fluorescence detection for accurate signal measurement. This application note details protocols for troubleshooting and resolving common issues in these areas, specifically framed within SCSA research context.
The Critical Role of Hydrodynamic Focusing and Laser Alignment
In flow cytometry, the fluidic system is designed to move cells single-file through the sensing region where laser illumination occurs. This is achieved through hydrodynamic focusing, a technique where a sample core containing cells is injected into a faster-moving, particle-free sheath fluid within a flow cell [61]. This creates a laminar flow that constricts the sample core, precisely aligning cells through the center of the laser beam [61].
- Laser Spot Characteristics: The accuracy of measurement is directly influenced by laser spot size and profile. Conventional flow cytometers use elliptically focused Gaussian beams with typical dimensions of 60–150 micrometers horizontally and 5–20 micrometers vertically. Advanced systems may employ beam-shaping optics to create "flat top" laser profiles, ensuring uniform illumination intensity across the sample core [61].
- Impact of Sample Core Diameter: The sample core diameter (
d, in µm) is approximated by the formulad = 1.13 * 1000 * u / nv², whereuis the particle measurement rate (particles/second),nis the particle concentration (particles/mL), andvis the jet velocity (m/s) [61]. Increased sample flow rates widen the core, allowing cells to deviate from the laser's focal point. This results in variable illumination and decreased measurement precision.
The following diagram illustrates the relationship between the fluidics and laser system, and the potential issues that arise from misalignment.
Optimizing Fluorescence Detection for SCSA
The SCSA measures the susceptibility of sperm nuclear DNA to acid-induced denaturation in situ, using the metachromatic properties of acridine orange (AO) [60]. Intact, double-stranded DNA intercalated with AO fluoresces green (F 515–530 nm), while denatured or fragmented single-stranded DNA with stacked AO fluoresces red (F > 630 nm) [60]. The DNA Fragmentation Index (%DFI) is calculated from the ratio of red to total (red + green) fluorescence, making signal fidelity paramount.
Key Challenges in Fluorescence Detection
- Spectral Spillover: In conventional flow cytometry, the emission spectra of fluorophores often overlap, causing signal "spillover" into detectors assigned to other fluorophores. While SCSA primarily uses AO, spectral principles apply to any multicolor panel. Spectral flow cytometry addresses this by capturing the full emission spectrum for each fluorophore, allowing for more precise signal unmixing even with highly overlapping dyes [62].
- Background Fluorescence: Non-specific staining, cellular autofluorescence (a significant issue in complex matrices like carrot juice [63]), and instrument noise elevate the background, reducing the signal-to-noise ratio (S/N) and assay sensitivity [64].
- Non-Specific Antibody Binding: For immunophenotyping panels, non-specific binding via Fc receptors or dye-dye interactions can compromise data. This is mitigated using blocking reagents like normal sera and specific stain buffers [65].
Quantitative Measures of Fluorophore Performance
The Stain Index (SI) is a key metric for comparing fluorophore brightness and resolving power, as it accounts for both the intensity difference between positive and negative populations and the spread of the negative population [64]. It is calculated as follows, and is generally preferred over a simple signal-to-noise ratio:
SI = (Median Fluorescence Intensity of Positive Population - Median Fluorescence Intensity of Negative Population) / (2 × Standard Deviation of Negative Population) [64]
Table 1: Stain Index Comparison for Different Anti-CD4 Antibody Conjugates [64]
| Brightness Category | Fluorophore Conjugate | Excitation Max (nm) | Emission Max (nm) | Stain Index |
|---|---|---|---|---|
| High | APC | 645 | 660 | 200.31 |
| PE | 496, 565 | 575 | 158.46 | |
| Medium | PE-Cy5.5 | 496, 565 | 690 | 105.91 |
| Alexa Fluor 488 | 495 | 519 | 91.72 | |
| Low | Pacific Blue | 410 | 455 | 14.61 |
| PerCP | 482 | 675 | 8.75 |
Experimental Protocols for Diagnosis and Resolution
Basic Protocol 1: Verifying and Optimizing Laser Alignment
This protocol is used to diagnose issues related to broad coefficient of variation (CV) and poor resolution.
Materials:
- Alignment beads or standard particles suitable for your lasers (e.g., 2-3µm beads)
- Sheath fluid
- Deionized water
- Flow cytometer
Method:
- System Preparation: Power on the instrument and lasers. Allow the lasers to stabilize for the recommended time (typically 15-30 minutes). Ensure the fluidic system is free of air bubbles and prime with sheath fluid.
- Baseline Measurement: Resuspend alignment beads in sheath fluid according to manufacturer's instructions. Run the beads at a low flow rate (e.g., < 500 events/sec).
- CV Analysis: Record the CV for the main peak in a scatter parameter (e.g., FSC or SSC). A sharp, low CV indicates good alignment. Compare the CV to the instrument's specification or historical performance data.
- Laser Adjustment (if applicable): If the CV is unacceptably high, consult the instrument manual for laser alignment procedures. This may involve micro-adjustment of steering mirrors or the flow cell position, a task typically performed by qualified service personnel.
- Signal Intensity Check: Verify that the fluorescence intensity of the beads is within the expected range. A significant drop may indicate laser power loss or misalignment.
Basic Protocol 2: A General Blocking and Staining Procedure to Minimize Non-Specific Fluorescence
Adapted from optimization studies for high-parameter flow cytometry, this protocol reduces background and improves the signal-to-noise ratio [65].
Materials:
- Cells (e.g., sperm cells)
- Mouse serum (e.g., Thermo Fisher, cat. no. 10410)
- Rat serum (e.g., Thermo Fisher, cat. no. 10710C)
- Tandem stabilizer (e.g., BioLegend, cat. no. 421802)
- Brilliant Stain Buffer (e.g., Thermo Fisher, cat. no. 00‐4409‐75)
- FACS buffer (PBS with 1-5% FBS or BSA)
- Staining antibodies or dyes (e.g., Acridine Orange for SCSA)
- V-bottom 96-well plates
- Centrifuge
Method:
- Prepare Blocking Solution: Create a mix containing mouse serum, rat serum, and tandem stabilizer diluted in FACS buffer. A typical dilution for sera is 3.3 (e.g., 300 µl of each serum in 1 ml total volume) [65].
- Wash and Aliquot Cells: Centrifuge cells and resuspend in FACS buffer. Dispense into a V-bottom 96-well plate. Centrifuge again (300 × g, 5 min) and decant supernatant.
- Blocking Step: Resuspend the cell pellet in 20 µl of the prepared blocking solution. Incubate for 15 minutes at room temperature in the dark.
- Prepare Staining Master Mix: Dilute your staining reagents (e.g., antibodies, AO) in FACS buffer. For panels containing polymer dyes like Brilliant Violet, add Brilliant Stain Buffer (up to 30% v/v of the mix) to prevent polymer aggregation [65].
- Stain Cells: Add 100 µl of the staining mix to each well. Mix gently by pipetting. Incubate for 1 hour at room temperature in the dark.
- Wash Cells: Add 120 µl of FACS buffer to each well. Centrifuge (300 × g, 5 min) and discard the supernatant. Repeat this wash step with 200 µl of FACS buffer.
- Resuspend for Acquisition: Resuspend the final cell pellet in FACS buffer containing tandem stabilizer (1:1000 dilution) to protect tandem dyes. Acquire on the flow cytometer.
The following workflow summarizes the key steps for preparing a sample to ensure optimal fluorescence detection.
The Scientist's Toolkit: Research Reagent Solutions
Table 2: Essential Reagents for Flow Cytometry Optimization
| Reagent / Tool | Function / Purpose | Example Use Case |
|---|---|---|
| Normal Sera (e.g., Mouse, Rat) | Blocks Fc receptor-mediated non-specific binding of antibodies to off-target cells. | Added to a blocking solution before surface staining of immune cells [65]. |
| Brilliant Stain Buffer | Prevents undesirable dye-dye interactions between polymer-based fluorophores (e.g., Brilliant Violet dyes) that can cause aggregation and spectral artifacts. | Essential for multicolor panels containing two or more "Brilliant" dyes [65]. |
| Tandem Stabilizer | Protects susceptible tandem dyes (e.g., PE-Cy7, APC-Cy7) from degradation, which can cause the tandem to break apart and emit light in the channel of the donor fluorophore. | Added to cell resuspension buffer during acquisition and for sample storage [65]. |
| Cell Viability Dye | Distinguishes and allows for the exclusion of dead cells from analysis, as they bind non-specifically to antibodies, increasing background. | Used in nearly every immunophenotyping panel to gate on live cells. |
| Acridine Orange | Metachromatic dye that fluoresces green when bound to dsDNA and red when associated with ssDNA, enabling calculation of %DFI. | The core fluorescent dye used in the Sperm Chromatin Structure Assay (SCSA) [60]. |
| Fluorescence SpectraViewer (Online Tool) | Allows visualization of excitation/emission spectra and predicts spillover to facilitate optimal fluorophore selection for multicolor panels. | Used during the panel design phase to check for spectral overlaps before purchasing reagents [64]. |
Robust and reproducible flow cytometry data, especially for sensitive clinical assays like SCSA, is fundamentally dependent on proper instrument alignment and optimized fluorescence detection. Meticulous attention to hydrodynamic focusing, laser alignment, and the use of appropriate blocking and stabilization reagents mitigates common issues of signal variability, high background, and spectral artifacts. By adhering to the detailed protocols and best practices outlined in this note, researchers and drug development professionals can ensure the highest data quality, ultimately leading to more reliable diagnostic and research outcomes.
The Impact of Sperm Processing Techniques (e.g., Swim-Up) on SCSA Results
Within the framework of advanced sperm chromatin structural assay (SCSA) research, understanding the impact of pre-analytical processing is paramount. Sperm preparation techniques are not merely isolation steps; they are critical interventions that can significantly alter the apparent molecular integrity of sperm chromatin as measured by the DNA Fragmentation Index (DFI) and High DNA Stainability (HDS). These parameters, as defined by the SCSA, provide unique insights into the extent of sperm DNA fragmentation and chromatin maturity, which are crucial for predicting outcomes in both natural conception and assisted reproductive technologies (ART) [36] [8]. The SCSA measures the susceptibility of sperm DNA to acid-induced denaturation in situ, with results expressed as %DFI (the proportion of sperm with fragmented DNA) and %HDS (the proportion of sperm with immature chromatin) [37]. This application note synthesizes recent findings to provide detailed protocols and data comparing the effects of swim-up, density-gradient centrifugation, and emerging microfluidic sorting techniques on SCSA parameters, thereby offering evidence-based guidance for experimental and clinical workflows in male fertility assessment.
Quantitative Comparison of Sperm Processing Techniques
The choice of sperm processing method directly influences the yield, motility, and most importantly, the chromatin integrity of the selected sperm population, as quantified by SCSA. The following data, compiled from recent comparative studies, illustrates the efficacy of different techniques in isolating sperm with lower DNA damage.
Table 1: Comparison of Sperm Parameters Following Different Processing Techniques
| Sperm Parameter | Raw Semen | Swim-Up | Density-Gradient Centrifugation | Microfluidic Sorting |
|---|---|---|---|---|
| DNA Fragmentation Index (%DFI) | 14.3 ± 11.2 [66] | 4.9 ± 3.1 [66] | 25.6 ± 2.3 [67] | 8.2 ± 1.5 [67] |
| High DNA Stainability (%HDS) | 9.1 ± 4.2 [66] | 4.6 ± 3.0 [66] | Data Not Available | Data Not Available |
| Total Motility (%) | 49.5 ± 12.7 [66] | 87.8 ± 6.4 [66] | 70.1 ± 3.5 [67] | 85.3 ± 3.2 [67] |
| Progressive Motility (%) | Data Not Available | Data Not Available | 58.4 ± 3.1 [67] | 72.5 ± 2.8 [67] |
| Key Findings | Baseline level of DNA damage. | Effectively reduces %DFI and %HDS. | Can induce iatrogenic DNA damage. | Selects for sperm with low DFI and high motility. |
The data demonstrates that while both swim-up and microfluidic sorting effectively reduce sperm DNA fragmentation, the latter appears to offer superior selection for high-motility sperm with minimal DFI. Density-gradient centrifugation, despite its widespread use, may be associated with higher DFI, potentially due to centrifugation-induced oxidative stress [67]. The clinical implications are significant, as a DFI threshold of >25–30% is associated with reduced likelihood of pregnancy and increased risk of early embryonic loss [68] [69].
Detailed Experimental Protocols
To ensure reproducibility and accurate interpretation of SCSA results, standardized protocols for both sperm preparation and the subsequent SCSA are essential. Below are detailed methodologies for the key techniques investigated.
Protocol 1: Swim-Up Technique
- Principle: This method leverages the innate motility of sperm to swim out of seminal plasma and into a culture medium layer, thereby selecting a population with better motility and, typically, lower DNA fragmentation [66].
- Procedure:
- Liquefy the semen sample at room temperature for 20-30 minutes.
- Mix the sample gently and transfer 1 mL to a conical centrifuge tube.
- Carefully layer 1-2 mL of pre-warmed culture medium (e.g., SpermMedium, MediCult) underneath the semen sample or gently overlay it on top, creating a clean interface.
- Incubate the tube at a 45° angle for 45-60 minutes in a 5% CO₂ incubator at 37°C. The inclined position increases the surface area for motile sperm to migrate.
- After incubation, carefully aspirate approximately 0.5-1 mL of the upper medium layer, which now contains the most motile sperm.
- Assess the concentration and motility of the recovered sperm fraction [66].
- Notes: This method is simple but may yield lower sperm numbers in cases of severe oligoasthenozoospermia. The incubation time can be adjusted based on initial sperm motility.
Protocol 2: Density-Gradient Centrifugation
- Principle: Sperm are separated based on their buoyant density through centrifugation through a colloidal silica matrix. Mature, morphologically normal sperm with denser nuclei penetrate the gradient pellet, while immotile sperm, leukocytes, and debris are retained in the upper layers [67] [70].
- Procedure:
- Prepare a discontinuous gradient in a 15 mL conical tube by layering 1 mL of a lower density (40%) isotonic solution (e.g., ISolate, Cook) over 1 mL of a higher density (80%) solution.
- Gently overlay 1 mL of liquefied semen onto the top of the gradient.
- Centrifuge at 300 ×g for 15-20 minutes at room temperature.
- Carefully aspirate and discard the supernatant, leaving the sperm pellet at the bottom.
- Resuspend the pellet in 2-5 mL of fresh culture medium and centrifuge at 200 ×g for 5-10 minutes to wash away residual gradient material.
- Repeat the wash step once more.
- Resuspend the final pellet in a small volume (e.g., 0.5 mL) of medium for analysis [67].
- Notes: Although effective for isolating motile sperm, the mechanical force of centrifugation can generate reactive oxygen species (ROS), potentially increasing sperm DNA damage [67].
Protocol 3: Microfluidic Sperm Sorting
- Principle: This method utilizes laminar flow and microscale channels in a chip to passively select sperm based on their motility and morphology, without the need for centrifugation. Motile sperm can navigate specific paths and separate from immotile sperm, cellular debris, and seminal plasma [67].
- Procedure:
- Load the liquefied semen sample into the designated input reservoir of the microfluidic chip.
- Simultaneously or sequentially, load the culture medium into its respective input reservoir.
- Allow the device to operate by capillary action or controlled flow for approximately 30 minutes. During this time, motile sperm actively swim across the microchannels into the medium stream directed toward the collection outlet.
- Collect the processed sperm sample from the output reservoir.
- The device is designed for single use and requires only two pipetting steps, minimizing technical variability [67].
- Notes: This novel technique shows promise in selecting sperm with significantly lower DFI and higher motility while reducing oxidative stress by avoiding centrifugation [67].
Core Protocol: Sperm Chromatin Structure Assay (SCSA)
- Principle: The SCSA quantifies the susceptibility of sperm chromatin to acid-induced denaturation. Sperm with DNA strand breaks have more single-stranded DNA, which stains red with Acridine Orange (AO), while sperm with intact double-stranded DNA stain green. The ratio of red to total fluorescence gives the DFI [37] [8].
- Procedure:
- Sample Preparation: Dilute raw or prepared sperm in TNE buffer (0.01 mol l⁻¹ Tris-HCl, 0.15 mol l⁻¹ NaCl, 1 mmol l⁻¹ EDTA, pH 7.4) to a concentration of 1-2 × 10⁶ sperm/mL.
- Flash Freezing: For batch analysis or shipping, flash-freeze the diluted samples and store at or below -80°C. Note that the SCSA is highly precise and repeatable with frozen-thawed samples [37].
- Acid Denaturation: On the day of analysis, thaw samples rapidly. Treat 200 µL of the cell suspension with 400 µL of a low-pH detergent solution (0.1% Triton X-100, 0.15 mol l⁻¹ NaCl, 0.08 mol l⁻¹ HCl, pH 1.2) for 30 seconds.
- Staining: Add 1.2 mL of AO staining solution (6 µg/mL in 0.1 mol l⁻¹ citric acid, 0.2 mol l⁻¹ Na₂HPO₄, 1 mmol l⁻¹ EDTA, 0.15 mol l⁻¹ NaCl, pH 6.0) immediately after the denaturation step.
- Flow Cytometry: Within 3-5 minutes of staining, analyze the sample using a flow cytometer equipped with a 488 nm laser. Measure green fluorescence (native DNA) at 515-530 nm and red fluorescence (denatured DNA) at >630 nm.
- Data Analysis: Acquire data for a minimum of 5,000-10,000 events per sample. Using dedicated SCSAsoft software, the DNA Fragmentation Index (%DFI, ratio of red to total fluorescence) and High DNA Stainability (%HDS, percentage of sperm with immature chromatin) are calculated [37] [8].
Workflow and Pathway Visualizations
SCSA and Sperm Processing Workflow
The following diagram illustrates the logical sequence of steps from semen collection to the final interpretation of SCSA data, highlighting the critical role of the sperm processing technique.
SCSA Principle and DNA Integrity Pathway
This diagram outlines the core biochemical principle of the SCSA, depicting how the test distinguishes between sperm with intact and fragmented DNA based on their differential fluorescence after acid denaturation and staining.
The Scientist's Toolkit: Essential Research Reagents and Materials
The following table details key reagents and materials essential for conducting the sperm processing and SCSA protocols described in this document.
Table 2: Key Research Reagent Solutions for Sperm Processing and SCSA
| Item | Function/Description | Example Sources / Components |
|---|---|---|
| Acridine Orange | Metachromatic fluorescent dye that differentially stains double-stranded (green) and single-stranded (red) DNA. The core stain for SCSA. | Sigma-Aldrich, SCSA Diagnostics [37] [8] |
| TNE Buffer | Dilution and freezing buffer for sperm samples; maintains cell integrity prior to SCSA analysis. | 0.01 mol l⁻¹ Tris-HCl, 0.15 mol l⁻¹ NaCl, 1 mmol l⁻¹ EDTA, pH 7.4 [66] [8] |
| Low-pH Detergent Solution | Denatures sperm chromatin in situ at sites of DNA strand breaks, a critical step for SCSA. | 0.1% Triton X-100, 0.15 mol l⁻¹ NaCl, 0.08 mol l⁻¹ HCl, pH 1.2 [37] [8] |
| Sperm Culture Medium | Provides nutrients and osmotic support for sperm during swim-up and post-processing incubation. | Human Tubal Fluid (HTF), SpermMedium (MediCult) [67] [66] |
| Density Gradient Medium | Colloidal silica solution for isolating sperm based on density via centrifugation. | ISolate (Cook), PureSperm (Nidacon) [67] |
| Microfluidic Sorting Chip | Device for selecting motile sperm with low DNA fragmentation using microfluidic principles. | Commercial chips (e.g., FERTILE, ZyMōt) [67] |
| Flow Cytometer | Instrument for rapid, quantitative analysis of Acridine Orange fluorescence in thousands of individual sperm. | BD Biosciences, Beckman Coulter systems [37] [41] |
| SCSAsoft Software | Proprietary software for the precise calculation of %DFI and %HDS from flow cytometry data. | SCSA Diagnostics [37] [8] |
The integration of robust sperm processing protocols with the precise SCSA is fundamental for accurate male fertility assessment. Evidence conclusively demonstrates that the choice of processing technique—swim-up, density-gradient centrifugation, or microfluidic sorting—directly and significantly impacts the resulting SCSA parameters, particularly the DNA Fragmentation Index. While traditional methods like swim-up effectively reduce DNA fragmentation, emerging technologies like microfluidic sorting show superior performance in selecting sperm with high motility and minimal DFI, potentially by mitigating centrifugation-induced oxidative stress. For researchers and clinicians, this underscores the necessity of standardizing and carefully selecting the sperm preparation method, as it is an integral part of the diagnostic pathway. The protocols and data provided herein serve as a detailed guide for implementing these techniques within a rigorous research or clinical framework, ultimately contributing to more reliable predictive models and improved outcomes in reproductive medicine.
Within the framework of advanced sperm chromatin structural assay (SCSA) research, the implementation of robust quality control (QC) measures is fundamental to ensuring data integrity and reproducibility. The SCSA is a flow cytometric method that simultaneously measures sperm DNA integrity (DNA Fragmentation Index, %DFI) and chromatin structure (High DNA Stainability, %HDS) [22] [17]. Unlike subjective microscopic assessments, the SCSA provides a rapid, machine-based measurement of thousands of sperm cells, offering exceptional precision and repeatability [6]. However, this precision is critically dependent on consistent instrument performance and standardized sample handling. Reference samples serve as the cornerstone of this QC system, enabling researchers to validate assay conditions, calibrate instrumentation, and monitor inter-assay variability, thereby guaranteeing that clinical and research findings are both accurate and reliable [22].
The SCSA in Brief: Principles and Parameters
The SCSA diagnostic protocol leverages the metachromatic properties of acridine orange (AO). Briefly, raw semen samples are treated with a low-pH buffer that denatures DNA at sites of strand breaks. Upon staining with AO, double-stranded (intact) DNA intercalates with the dye and fluoresces green, while single-stranded (fragmented) DNA allows the dye to stack and fluoresces red when analyzed by flow cytometry [22] [8] [17]. The assay simultaneously generates two key parameters:
- %DFI (DNA Fragmentation Index): The percentage of sperm with significant DNA strand breaks. This is the primary indicator of DNA integrity [22] [17].
- %HDS (High DNA Stainability): The percentage of sperm with immature chromatin, characterized by an excess of nuclear histones that have not been replaced by protamines. This results in increased accessibility to the AO stain [22] [8].
These parameters have established clinical utility. For human fertility, a %DFI threshold of 25% is used to distinguish between samples suitable for natural conception or intrauterine insemination (IUI) and those for which intracytoplasmic sperm injection (ICSI) should be considered. An %HDS value exceeding 25% may indicate a risk of early embryo death due to abnormal chromatin structure [22] [8].
The Critical Function of Reference Samples in SCSA
Reference samples in SCSA are stable, well-characterized semen specimens with known %DFI and %HDS values. Their use is integral to every stage of the assay's lifecycle, from initial setup to daily clinical diagnostics. The primary functions of reference samples are detailed below.
Instrument Calibration and Setup
Before analyzing patient samples, the flow cytometer must be calibrated to ensure the accurate detection of red and green fluorescence. Reference samples are used to set photomultiplier tube (PMT) voltages, laser delay, and fluidics settings to achieve a consistent and defined signal distribution for both red and green fluorescence channels [22]. This step verifies that the instrument is performing within specified parameters and is sensitive enough to detect variations in DNA integrity.
Inter-Assay Precision Monitoring
A core challenge in longitudinal studies or multi-center trials is maintaining consistency over time and across different laboratories. By running a specific reference sample with each batch of tests, researchers can monitor day-to-day and inter-laboratory variations in %DFI and %HDS measurements. This practice is vital for normalizing data, ensuring that observed changes are biological rather than technical, and enabling valid comparisons across studies [22] [57].
Protocol and Technician Proficiency Validation
The SCSA protocol involves precise timing and specific reagent conditions [22]. Reference samples act as a positive control to validate that the entire protocol—from sample thawing and acid denaturation to AO staining—has been executed correctly. Consistent results from a reference sample confirm technician proficiency and reagent integrity, safeguarding against procedural errors.
Data Normalization and Threshold Establishment
In research, reference samples are instrumental for establishing normative ranges for new species or experimental models. For instance, a study in rhesus macaques used reference samples to validate the SCSA protocol before establishing a normal %DFI range of 0.1–2.4% for fertile males [57]. This provides a quantitative baseline against which the effects of toxins, diseases, or treatments can be accurately assessed.
SCSA Reference Sample Protocol
Selection and Preparation of Reference Samples
Reference samples should be selected from individuals or pools with stable and well-defined %DFI and %HDS values, covering a range relevant to the study (e.g., low, moderate, and high %DFI) [22]. The preparation follows a strict protocol to ensure stability and longevity.
Materials:
- Raw semen sample from a donor or animal model.
- TNE buffer: 0.15M Sodium Chloride, 0.08M Tris Hydrochloric Acid, 0.1% Triton-X 100, pH 7.4 [22] [17].
- 2-ml cryotubes.
- Liquid nitrogen (LN₂) dry shipper or ultracold freezer (≥ -70°C).
Procedure:
- Liquefaction and Dilution: Allow a freshly ejaculated semen sample to liquefy for 30 minutes at 37°C. Dilute the raw semen with TNE buffer to achieve a concentration of approximately 1–2 x 10⁶ sperm/ml [22].
- Aliquoting and Flash-Freezing: Dispense the diluted semen into multiple 0.5–1.0 ml snap-cap cryotubes. Immediately flash-freeze the aliquots by immersing them directly into liquid nitrogen. This rapid freezing is critical to prevent ice crystal formation and subsequent DNA damage [22].
- Long-Term Storage: Transfer and store the frozen reference samples in an ultracold freezer (-70°C to -110°C) or, preferably, in a liquid nitrogen tank to ensure long-term stability [22].
Utilization of Reference Samples in Daily Practice
The following workflow integrates the use of reference samples into the standard SCSA protocol for quality control purposes.
Diagram 1: Workflow for integrating reference samples into the SCSA quality control process.
Procedure:
- Thawing: Thaw a single frozen reference sample cryotube by immersing it in a 37°C water bath until the last remnant of ice disappears. Patient samples are processed simultaneously [22].
- Acid Denaturation and Staining:
- Transfer the thawed reference sample into 200 µl of TNE buffer.
- Add 400 µl of acid-detergent solution (pH 1.2), mix on a lab vortex for 30 seconds.
- Add 1.20 ml of AO staining solution (working solution), mix on a vortex.
- Place the sample tube into the flow cytometer and start sample flow.
- Data Acquisition: Begin acquisition of flow cytometry data at 3 minutes to allow for AO equilibration. Collect data for at least 5,000 events [22].
- QC Check: Analyze the reference sample to determine its %DFI and %HDS. Compare these values to its established historical range.
- If values are within the expected range: The instrument and reagents are verified to be performing correctly. Proceed with the analysis of patient samples.
- If values are outside the expected range: Do not proceed with patient analysis. Investigate potential issues with instrument calibration, reagent integrity, or procedural errors [22].
Essential Research Reagent Solutions
The following table catalogs the key reagents and materials required for performing the SCSA and preparing reference samples, as detailed in the protocols.
Table 1: Key Research Reagents and Materials for SCSA
| Reagent/Material | Function and Specification |
|---|---|
| TNE Buffer [22] [17] | A pH-stabilizing buffer (50 mM Tris HCl, 100 mM NaCl, 0.1 mM EDTA, pH 7.4) used to dilute raw semen samples to the optimal concentration for analysis (~1-2 x 10⁶ sperm/ml). |
| Acid-Detergent Solution [22] [17] | A low-pH solution (0.08N HCl, 0.1% Triton X-100, pH 1.2) that denatures DNA at sites of strand breaks for 30 seconds, which is a critical step in the SCSA protocol. |
| Acridine Orange (AO) Stock Solution [22] | The fluorescent dye (1.0 mg/ml) that differentially stains double-stranded (green fluorescence) and single-stranded (red fluorescence) DNA. It is the core detection reagent of the assay. |
| AO Staining Buffer & Working Solution [22] | A buffer used to create the working AO staining solution (6 µg AO/ml) that is added to the denatured sperm sample for flow cytometric analysis. |
| Cryotubes [22] | Specific tubes (e.g., 0.5-1.0 ml snap cap) used for aliquoting and flash-freezing reference semen samples in liquid nitrogen for long-term storage. |
| Liquid Nitrogen (LN₂) Dry Shipper [22] | Essential equipment for the flash-freezing of reference samples and their stable shipment or storage, preventing DNA damage from slow freezing. |
| Flow Cytometer [22] | Instrument requiring a 488 nm laser and detectors for green (515–530 nm) and red (>630 nm) fluorescence. It must be calibrated using reference samples. |
Data Reproducibility and Comparative Analysis
The rigorous use of reference samples directly contributes to the high reproducibility of the SCSA. Studies have demonstrated low intra-laboratory and inter-laboratory coefficients of variation when standardized protocols are followed [6] [57]. Furthermore, reference samples enable meaningful comparisons between SCSA and other sperm DNA fragmentation (SDF) assays.
A large-scale 2023 study comparing SCSA and the TUNEL assay on approximately 10,000 samples found that while the two methods produce concordant data, the SCSA systematically reports a higher %DFI for the same sample than TUNEL. This underscores the importance of using assay-specific thresholds and reference materials, as values are not directly interchangeable [40].
Table 2: Comparison of Sperm DNA Fragmentation Assays
| Assay | Principle | Method of Analysis | Key Differentiating Factor |
|---|---|---|---|
| SCSA [22] [6] [17] | Acid-induced DNA denaturation at break sites, detected by Acridine Orange metachromatic shift. | Flow Cytometry (5,000-10,000 sperm in minutes). | Federally registered, fixed protocol; high statistical robustness and repeatability. |
| TUNEL [40] [6] [35] | Enzymatic labeling of DNA strand breaks with fluorescent nucleotides. | Flow Cytometry or Fluorescence Microscopy (200-500 sperm). | Multiple protocol variations exist; can be less sensitive than SCSA [40]. |
| Comet Assay [6] [35] | Electrophoresis of single cells to visualize DNA fragments as a "comet tail". | Fluorescence Microscopy (50-100 sperm). | Can differentiate single vs. double-strand breaks; low throughput and statistical power. |
| SCD (Halo Test) [6] [35] | Acid-induced denaturation and protein removal, visualizing dispersed DNA as a halo. | Bright-Field Microscopy (300-500 sperm). | Simpler setup but lacks the statistical power of flow-based methods. |
In the context of SCSA research and diagnostics, reference samples are not merely supplementary but are fundamental to rigorous quality control. They transform the SCSA from a potentially variable technique into a gold-standard assay for sperm DNA integrity. By ensuring instrument stability, verifying procedural fidelity, and enabling data normalization, reference samples empower researchers and clinicians to generate reliable, reproducible, and clinically actionable data, thereby upholding the highest standards of scientific and diagnostic excellence.
SCSA in the Diagnostic Landscape: Validation and Comparison with TUNEL and SCD Assays
Sperm DNA fragmentation (sDF) is a critical parameter of semen quality, with levels that demonstrate a stronger correlation with natural conception outcomes than conventional semen parameters [71] [72]. The assessment of sDF has become an integral component of the male infertility work-up, as recommended by the World Health Organization [72]. Among the available techniques, the Sperm Chromatin Structure Assay (SCSA), Terminal Deoxynucleotidyl Transferase dUTP Nick-End Labeling (TUNEL), and Sperm Chromatin Dispersion (SCD) test represent three fundamental approaches with distinct underlying principles. These tests are structurally different from one another, potentially detecting varying aspects of sperm chromatin damage [72]. Understanding their unique measurement principles, protocols, and performance characteristics is essential for researchers and clinicians in selecting the most appropriate assay for specific experimental or diagnostic contexts. This comparative analysis examines these three established methodologies within the framework of sperm chromatin structural assessment protocols, providing detailed technical insights for their application in research and clinical environments.
Fundamental Measurement Principles
TUNEL Assay Principle
The TUNEL (Terminal deoxynucleotidyl transferase dUTP Nick-End Labeling) assay detects DNA fragmentation by identifying the 3'-hydroxyl termini of DNA single- and double-strand breaks generated during apoptosis [73]. This method utilizes the enzyme terminal deoxynucleotidyl transferase (TdT), which catalyzes the template-independent addition of modified deoxynucleotides to the 3'-OH ends of fragmented DNA [74] [73]. The incorporated nucleotides are typically tagged with fluorophores (e.g., FITC, Alexa Fluor dyes) or haptens (e.g., biotin, bromine) that enable direct fluorescence detection or indirect detection via streptavidin or antibody complexes [74] [73]. The TUNEL assay is particularly valued for its direct detection of DNA breakage rather than chromatin abnormalities [72]. Modern implementations, such as the Click-iT TUNEL assay, utilize click chemistry—a copper-catalyzed reaction between an azide and alkyne—which offers improved sensitivity due to better penetration of small Alexa Fluor azides (MW ~1,000) compared to antibodies (MW ~150,000) [74].
SCSA Principle
The Sperm Chromatin Structure Assay (SCSA) operates on a fundamentally different principle, measuring the susceptibility of sperm chromatin to denature following acid treatment [71] [72]. This technique exploits the fact that sperm with abnormal chromatin packaging possess increased susceptibility to acid-induced denaturation. In the SCSA protocol, sperm DNA is briefly exposed to a mild acid solution, which denatures DNA at sites of existing chromatin abnormalities. The sample is then stained with acridine orange, a metachromatic dye that fluoresces green when intercalated into double-stranded DNA and red when associated with single-stranded DNA [72]. The extent of DNA denaturation is quantified by flow cytometry, generating a DNA Fragmentation Index (DFI) that represents the ratio of red to total (red plus green) fluorescence. Unlike TUNEL which detects actual DNA strand breaks, SCSA primarily identifies abnormalities in sperm chromatin organization and compaction that predispose DNA to denaturation [72].
SCD Test Principle
The Sperm Chromatin Dispersion (SCD) test assesses DNA fragmentation based on the differential dispersion of DNA fragments following acid denaturation and removal of nuclear proteins [72] [75]. In this technique, sperm embedded in an agarose microgel are treated with an acid solution to denature DNA containing breaks, followed by a lysing solution to remove nuclear proteins and membranes. Sperm with non-fragmented DNA produce characteristic halos of dispersed DNA loops around a central core, while sperm with fragmented DNA exhibit minimal or no halo formation due to the inability of broken DNA to maintain a organized dispersion pattern [75]. The differential morphologies are visualized under a fluorescence microscope after DNA staining, allowing for classification of sperm into categories based on halo size and appearance. The SCD test detects the functional consequence of DNA fragmentation on chromatin dispersion capacity rather than directly detecting the breaks themselves [72].
Table 1: Comparative Principles of Sperm DNA Fragmentation Assays
| Assay | Primary Detection Target | Underlying Principle | Detection Method | Type of Damage Revealed |
|---|---|---|---|---|
| TUNEL | 3'-OH ends of DNA single- and double-strand breaks [73] | Enzymatic addition of modified nucleotides to DNA ends by TdT [74] | Fluorescence microscopy or flow cytometry [73] | Real DNA breakage [72] |
| SCSA | Chromatin susceptibility to denaturation [72] | Acid-induced DNA denaturation at sites of chromatin abnormalities [72] | Flow cytometry (acridine orange fluorescence) [72] | Abnormalities in sperm chromatin structure [72] |
| SCD | Chromatin dispersion capacity [75] | Differential halo formation after nuclear protein removal [75] | Bright-field or fluorescence microscopy [75] | Functional consequence of DNA fragmentation [72] |
Quantitative Performance Comparison
Recent comparative studies have provided valuable insights into the performance characteristics of TUNEL, SCSA, and SCD tests under different experimental conditions. A 2025 study by Calamai et al. directly compared these assays by measuring sDF before and after inducing DNA damage through cryopreservation and in vitro incubation [71] [72]. While all three tests detected significant increases in sDF following both cryopreservation and incubation, the magnitude of response varied considerably between assays. TUNEL demonstrated the highest sensitivity to cryopreservation-induced damage, revealing substantially greater fold increases in sDF compared to SCSA and SCD [72]. This suggests that TUNEL may be particularly effective for detecting DNA damage resulting from cryopreservation stress.
Statistical analysis of paired comparisons revealed generally poor concordance between the tests. Lin's concordance correlation coefficients (CCCs) for pairwise comparisons between TUNEL and SCSA were below 0.5 during both cryopreservation [-0.080 (95% CI -0.506–0.377)] and incubation [-0.082 (95% CI -0.498–0.364)] [72]. Similarly, comparisons between TUNEL and SCD test showed poor CCC values during both cryopreservation [0.057 (95% CI -0.157–0.267)] and incubation [0.028 (95% CI -0.401–0.448)] [72]. Bland-Altman plot analysis further confirmed that TUNEL detects higher amounts of sDF during cryopreservation compared to SCSA and SCD tests [72]. These findings underscore that these assays are not interchangeable and likely detect different aspects or types of sperm DNA damage.
Table 2: Quantitative Performance Comparison Across Experimental Conditions
| Performance Metric | TUNEL | SCSA | SCD Test |
|---|---|---|---|
| Detection of cryopreservation-induced sDF | High (Highest fold increase) [72] | Moderate [72] | Moderate [72] |
| Detection of incubation-induced sDF | Moderate [72] | Moderate [72] | Moderate [72] |
| Concordance with TUNEL | - | Poor (CCC <0.5) [72] | Poor (CCC <0.5) [72] |
| Advantages | Direct detection of DNA breaks; High sensitivity to cryopreservation damage [72] | Standardized flow cytometry; DFI calculation [72] | Simple microscopy; No specialized equipment needed [75] |
| Limitations | Requires specific enzyme and detection system [74] | Indirect measure of DNA damage [72] | Subjective halo assessment; Indirect measure [75] |
Detailed Experimental Protocols
TUNEL Assay Protocol
The TUNEL assay protocol involves specific steps for sample preparation, fixation, permeabilization, and labeling. For cellular samples, begin with fixation using 4% paraformaldehyde in PBS for 15 minutes at room temperature [74]. Remove fixative and permeabilize cells with 0.25% Triton X-100 in PBS for 20 minutes at room temperature [74]. Wash twice with deionized water. Prepare the TUNEL reaction mixture according to the manufacturer's instructions, typically containing TdT reaction buffer, EdUTP nucleotide mixture, and TdT enzyme [74]. Apply the TUNEL reaction mixture to samples and incubate for 2 hours at 37°C in a humidified chamber protected from light [74]. For the Click-iT TUNEL system, perform the click reaction by applying Click-iT reaction buffer containing Alexa Fluor azide for 30 minutes at room temperature protected from light [74]. Wash samples with PBS and counterstain nuclei with Hoechst 33342 (1:1000 in PBS) for 15 minutes [74]. Wash and mount for microscopy analysis. Include appropriate controls: a negative control omitting TdT enzyme and a positive control treated with DNase I (1-3 U/mL in DNase buffer) for 30 minutes at room temperature to induce DNA strand breaks [74].
SCSA Protocol
The Sperm Chromatin Structure Assay requires careful sample preparation and flow cytometric analysis. Begin by diluting fresh semen sample to 1-2 × 10^6 sperm/mL in TNE buffer (0.01 M Tris-HCl, 0.15 M NaCl, 1 mM EDTA, pH 7.4) [72]. Subject a 200 μL aliquot of diluted sperm to acid denaturation by adding 400 μL of acid-detergent solution (0.08 N HCl, 0.15 M NaCl, 0.1% Triton X-100, pH 1.2) for 30 seconds [72]. After exactly 30 seconds, add 1.2 mL of acridine orange staining solution (6 μg/mL in 0.1 M citric acid, 0.2 M Na2HPO4, 1 mM EDTA, 0.15 M NaCl, pH 6.0) [72]. Incubate the stained samples for 3 minutes at room temperature. Analyze samples by flow cytometry within 3-10 minutes of staining using a 488 nm excitation laser. Measure green fluorescence (515-530 nm) for double-stranded DNA and red fluorescence (>630 nm) for single-stranded DNA on a minimum of 5,000 events per sample [72]. Calculate DNA Fragmentation Index (DFI) as the ratio of red to total (red + green) fluorescence. Include reference samples with known DFI values for quality control and instrument calibration.
SCD Test Protocol
The Sperm Chromatin Dispersion test protocol involves specific steps for agarose embedding and halo development. Prepare fresh semen sample and adjust concentration to 5-10 × 10^6 sperm/mL in PBS [75]. Mix 100 μL of sperm suspension with 100 μL of 1% low-melting point agarose in PBS maintained at 37°C [75]. Immediately pipet 25-30 μL of the mixture onto pre-coated slides provided in commercial kits or onto clean microscope slides pre-coated with 0.65% standard agarose [75]. Cover with a coverslip and place slides on a cold surface (4°C) for 5 minutes to solidify the agarose. Carefully remove coverslip and immerse slides in acid denaturation solution (0.08 N HCl) for 7 minutes at room temperature [75]. Transfer slides to lysing solution (0.4 M Tris-HCl, 0.8 M DTT, 1% SDS, 0.05 M EDTA, pH 7.5) for 25 minutes at room temperature [75]. Wash slides thoroughly in distilled water and dehydrate through an ethanol series (70%, 90%, 100%) for 2 minutes each. Air dry slides and stain with DNA-specific fluorescent stain (DAPI, propidium iodide, or SYBR Green) according to manufacturer's instructions [75]. Analyze under fluorescence microscope, counting a minimum of 300 sperm per sample. Classify sperm based on halo appearance: large halos (non-fragmented DNA), medium or small halos (moderate fragmentation), or no halo (fragmented DNA) [75].
Research Reagent Solutions and Essential Materials
Table 3: Essential Research Reagents for Sperm DNA Fragmentation Assays
| Reagent/Material | Function/Purpose | Example Specifications | Compatible Assays |
|---|---|---|---|
| Terminal Deoxynucleotidyl Transferase (TdT) | Catalyzes addition of modified nucleotides to 3'-OH DNA ends [74] | Recombinant, 15 U/μL concentration [74] | TUNEL |
| Modified Nucleotides (dUTP) | Substrate for TdT; carries detection tags [74] | EdUTP, FITC-dUTP, Biotin-dUTP, BrdUTP [74] [73] | TUNEL |
| Alexa Fluor Azides | Detection via click chemistry; superior penetration [74] | Alexa Fluor 488/594/647 azides [74] | Click-iT TUNEL |
| Acridine Orange | Metachromatic DNA dye; distinguishes ssDNA vs dsDNA [72] | 6 μg/mL in citric acid-phosphate-EDTA buffer, pH 6.0 [72] | SCSA |
| Low-Melting Point Agarose | Matrix for sperm embedding in microgel [75] | 1% in PBS, molecular biology grade [75] | SCD Test |
| Acid Denaturation Solution | Denatures DNA at sites of chromatin abnormalities [72] [75] | 0.08 N HCl, 0.15 M NaCl, 0.1% Triton X-100 (SCSA) [72] | SCSA, SCD |
| Lysing Solution | Removes nuclear proteins and membranes [75] | 0.4 M Tris, 0.8 M DTT, 1% SDS, 0.05 M EDTA, pH 7.5 [75] | SCD Test |
| DNase I | Positive control induction of DNA strand breaks [74] | 1-3 U/mL in DNase buffer [74] | TUNEL |
Implementation Considerations and Decision Framework
Assay Selection Guidelines
Choosing the appropriate sperm DNA fragmentation assay depends on multiple factors, including research objectives, available equipment, and sample characteristics. For studies requiring direct quantification of DNA strand breaks, particularly in cryopreservation research, TUNEL is preferable due to its superior sensitivity in detecting this specific type of damage [72]. When evaluating chromatin structural abnormalities rather than direct DNA breaks, SCSA provides valuable information about chromatin susceptibility to denaturation [72]. For laboratories with limited access to flow cytometry or specialized equipment, the SCD test offers a practical alternative that requires only standard microscopy capabilities [75].
Consideration should also be given to the nature of the biological question. Investigations of apoptosis-specific DNA fragmentation are best served by TUNEL, which specifically detects the 3'-OH ends characteristic of programmed cell death [73]. For large-scale clinical studies requiring high-throughput analysis, SCSA's flow cytometry platform offers advantages in processing speed and standardization [72]. When studying specific sperm subpopulations or needing to correlate DNA damage with other cellular parameters, microscopic methods like TUNEL or SCD enable single-cell analysis and morphological correlation [75].
Technical Considerations and Limitations
Each assay presents specific technical considerations that impact implementation and interpretation. TUNEL assay results can be influenced by fixation and permeabilization conditions, with over-fixation potentially reducing antigen accessibility and under-fixation compromising structural integrity [74]. The choice of detection system also affects sensitivity, with click chemistry-based methods demonstrating improved performance over traditional antibody-based detection due to better penetration of small molecular weight azides [74].
SCSA requires rigorous standardization of acid treatment duration and temperature, as variations significantly impact the degree of DNA denaturation and subsequent DFI values [72]. Flow cytometer calibration is critical, with daily quality control using reference samples essential for inter-laboratory reproducibility. The SCD test's subjective halo assessment introduces potential inter-observer variability, necessitating standardized classification criteria and observer training [75]. Sample preparation methods also affect SCD results, particularly the agarose concentration and lysis solution composition.
All three assays demonstrate the capacity to detect increased sDF following cryopreservation and in vitro incubation, but with differing sensitivities and dynamic ranges [72]. This underscores the importance of using consistent methodologies within a study and caution when comparing absolute values between different assays. The poor concordance between tests highlights that they likely detect different aspects of sperm DNA damage, suggesting that a combination of complementary assays may provide the most comprehensive assessment of sperm DNA integrity in complex research scenarios.
Sperm DNA integrity is a critical parameter of male fertility, with sperm DNA fragmentation (sDF) being a key biomarker for predicting outcomes in natural conception and assisted reproductive technologies (ART) [76] [77]. Among the various assays developed to assess sDF, the Sperm Chromatin Structure Assay (SCSA) and the Terminal deoxynucleotidyl transferase dUTP nick end labeling (TUNEL) assay are widely utilized in both clinical and research settings [78]. However, a growing body of evidence from large-cohort studies indicates significant discordance between these tests, suggesting they may measure different aspects of sperm DNA damage [79] [80] [78]. This application note examines the concordance and discordance between SCSA and TUNEL assays through a comprehensive analysis of published cohort studies, providing detailed protocols and data interpretation guidelines for researchers and clinicians working in male fertility and drug development.
Key Comparative Studies: Design and Findings
Major Cohort Studies and Their Quantitative Findings
Large-cohort studies directly comparing SCSA and TUNEL assays reveal consistent patterns of discordance in their measurements of sperm DNA fragmentation. The table below summarizes the key findings from these comparative studies.
Table 1: Key Findings from Major Comparative Studies of SCSA and TUNEL Assays
| Study Cohort | Correlation Coefficient | Discordance Rate | Relationship with Semen Parameters | Primary Conclusion |
|---|---|---|---|---|
| 212 men with subfertility [79] [80] | Spearman's r = 0.31 (positive but weaker than previously reported) | 40.6% (86/212) in classifying patients as normal/abnormal | SCSA DFI correlated with concentration and motility; TUNEL showed no correlation with standard parameters | Assays measure different aspects of DNA integrity and should not be used interchangeably |
| 79 patients [78] | Significant associations between parameters but not comparable by concordance correlation | Methods not comparable per Bland-Altman plots and Passing-Bablok regression | Difference found for P- and G-pattern morphology only for SCSA mean channel fluorescence | SCSA measures 'potential' DNA denaturation susceptibility; TUNEL detects 'real' DNA strand breaks |
Conceptual Differences Between SCSA and TUNEL Assays
The fundamental differences in what SCSA and TUNEL assays measure provides crucial context for interpreting their discordant results. The following diagram illustrates the conceptual relationship between these assays and the type of DNA damage they detect:
As illustrated, SCSA measures the susceptibility of sperm DNA to denaturation under stress conditions, indicating 'potential' DNA damage, while TUNEL directly detects existing DNA strand breaks through enzymatic labeling, representing 'real' DNA damage [78]. This fundamental difference in the nature of damage detected explains why these assays yield discordant results in a significant percentage of patients [79].
Detailed Experimental Protocols
Sperm Chromatin Structure Assay (SCSA) Protocol
The SCSA protocol utilizes flow cytometry to measure the DNA Fragmentation Index (DFI) based on the susceptibility of sperm chromatin to acid-induced denaturation [76].
Table 2: Key Research Reagents for SCSA Protocol
| Reagent/Equipment | Specification/Function |
|---|---|
| TNE Buffer | 0.01 M Tris-HCl, 0.15 M NaCl, 1 mM EDTA; pH 7.4 for sperm suspension |
| Acid Denaturation Solution | 0.08 N HCl, 0.15 M NaCl, 0.1% (v:v) Triton X-100 |
| Staining Solution | 6 µg/mL acridine orange (chromatographically purified), 0.2 M Na₂HPO₄, 0.1 M citric acid, 1 mM EDTA, 0.15 M NaCl; pH 6.0 |
| Flow Cytometer | FACSCalibur or equivalent with 488 nm excitation laser |
| Analysis Software | SCSAsoft proprietary software for DFI calculation |
Step-by-Step SCSA Procedure
Sample Preparation: Thaw frozen semen samples in a 37°C water bath and immediately place on crushed ice. Dilute raw semen in TNE buffer (4°C) to a concentration of 1-2×10⁶ sperm/mL [76].
Acid Denaturation: Mix 200 µL of sperm suspension with 400 µL of acid denaturation solution (0.08 N HCl, 0.15 M NaCl, 0.1% Triton X-100) at 4°C and incubate for exactly 30 seconds [76].
Acridine Orange Staining: Add 1.2 mL of acridine orange staining solution (6 µg/mL) to the acid-treated sperm. Ensure acridine orange to DNA-P molar ratio of ≥2 for proper staining [76].
Flow Cytometric Analysis: Place stained sample in flow cytometer and analyze 5,000 sperm at an event rate of 100-250 events/sec. Maintain equilibrium between dye and sperm by avoiding high event rates [76].
Data Interpretation: SCSAsoft software calculates DFI as the percentage of sperm with measurably increased red fluorescence (denatured DNA). Analyze samples in duplicate and repeat if >10% difference in DFI between replicates [76].
SCSA Quality Control Measures
- Calibrate flow cytometer with reference sample at start of analysis and after every five test samples [76].
- Maintain consistent event rates (100-250 events/sec) to ensure proper dye equilibrium [76].
- Reject samples with >10% difference in DFI between replicate analyses [76].
Epifluorescence TUNEL Assay Protocol
The TUNEL assay directly detects DNA strand breaks by labeling 3'-OH termini with modified nucleotides using terminal deoxynucleotidyl transferase (TdT) [79] [77].
Table 3: Essential Research Reagents for TUNEL Assay
| Reagent/Equipment | Specification/Function |
|---|---|
| Terminal Deoxynucleotidyl Transferase (TdT) | Enzyme that catalyzes addition of labeled nucleotides to 3'-OH ends of DNA breaks |
| Fluorescent-dUTP | Fluorescein-dUTP or other fluorescently-labeled nucleotides for visualization |
| Epifluorescence Microscope | Microscope with appropriate filters for visualizing fluorescent labels |
| Positive Control Samples | DNase-treated sperm samples to induce uniform DNA fragmentation |
| Permeabilization Solution | 0.1% Triton X-100 in 0.1% sodium citrate |
Step-by-Step TUNEL Procedure
Sample Preparation: Prepare sperm smears on glass slides and air dry. Fix cells in 4% paraformaldehyde for 1 hour at room temperature [77].
Permeabilization: Treat fixed sperm with permeabilization solution (0.1% Triton X-100 in 0.1% sodium citrate) for 2 minutes on ice to allow reagent penetration [77].
TUNEL Reaction Mixture: Prepare TUNEL reaction mixture according to manufacturer's instructions containing:
- Terminal deoxynucleotidyl transferase (TdT)
- Fluorescently-labeled dUTP (e.g., fluorescein-dUTP)
- Reaction buffer
Enzymatic Labeling: Apply TUNEL reaction mixture to fixed and permeabilized sperm samples. Incubate in a humidified chamber for 1 hour at 37°C [77].
Counterstaining and Visualization: Counterstain with appropriate nuclear stain (e.g., DAPI or PI) and visualize under epifluorescence microscope. Score at least 200 sperm per sample by trained technicians [79].
TUNEL Quality Control Measures
- Include positive controls (DNase-treated samples) and negative controls (omitting TdT enzyme) in each run [77].
- Standardize scoring methodology across technicians to minimize inter-observer variability [79].
- Validate fluorescence intensity thresholds for positive vs. negative sperm consistently across samples [77].
Comparative Analysis and Data Interpretation
Clinical Implications of Discordant Results
The approximately 40% discordance rate between SCSA and TUNEL assays in classifying patients as normal or abnormal has significant implications for clinical decision-making and research applications [79] [80].
The divergence in results between these assays means that clinical decisions regarding ART procedure selection (e.g., IUI vs. IVF/ICSI) may vary significantly depending on which test is used [76]. This is particularly relevant given that SCSA DFI shows moderate negative correlation with standard semen parameters (concentration and motility), while TUNEL results appear unrelated to these conventional measures [79] [80].
Guidelines for Test Selection and Implementation
Based on the comparative evidence, the following guidelines are recommended for researchers and clinicians:
Assay Selection Criteria:
Interpretation Framework:
Quality Assurance:
SCSA and TUNEL assays provide complementary but distinct assessments of sperm DNA integrity, with significant discordance observed in approximately 40% of patient classifications [79] [80]. Researchers and clinicians should recognize that SCSA measures 'potential' DNA damage susceptibility to denaturation, while TUNEL detects 'real' DNA strand breaks [78]. This fundamental difference necessitates test-specific interpretation thresholds and cautions against using these assays interchangeably in both clinical decision-making and research settings. For comprehensive assessment of sperm DNA integrity, a combination of both assays may provide the most complete picture, though practical considerations often require selection of a single methodology based on specific clinical or research questions.
Sperm DNA integrity is increasingly recognized as a critical determinant of male fertility potential, influencing outcomes in both natural conception and assisted reproductive technology (ART). The Sperm Chromatin Structure Assay (SCSA) has emerged as a powerful flow cytometric technique for assessing sperm DNA fragmentation (SDF), providing clinically relevant data beyond conventional semen parameters. This application note provides a comprehensive technical evaluation of SCSA's analytical strengths compared to alternative SDF assessment methodologies, with particular emphasis on its sensitivity profile, reproducibility metrics, and established clinical utility in diverse andrological contexts. As a standardized approach to measuring the DNA Fragmentation Index (DFI), SCSA offers researchers and clinicians a robust prognostic tool for evaluating male fertility potential, especially in cases of unexplained infertility, recurrent pregnancy loss, and recurrent ART failure.
Comparative Analysis of Sperm DNA Fragmentation Assays
The assessment of sperm DNA integrity presents significant technical challenges due to the unique and highly compact nature of sperm chromatin. Table 1 provides a systematic comparison of the major SDF testing methodologies currently employed in both research and clinical settings, highlighting their fundamental principles, analytical performance characteristics, and practical implementation considerations.
Table 1: Comparative Analysis of Sperm DNA Fragmentation Assays
| Assay | Principle | Measured Parameter | Sensitivity | Reproducibility | Clinical Utility | Key Limitations |
|---|---|---|---|---|---|---|
| SCSA | Flow cytometric measurement of DNA denaturability using acridine orange staining [26] [5] | DNA Fragmentation Index (DFI), High DNA Stainability (HDS) [26] | High; detects DNA denaturation susceptibility [5] | High inter-laboratory reproducibility with standardized protocol [81] [5] | Strong correlation with ART outcomes and natural conception [81] [82] | Requires flow cytometer and specific software; trained technician needed [81] [26] |
| TUNEL | Enzymatic labeling of DNA strand breaks with fluorescent nucleotides [83] [82] | Percentage of sperm with DNA strand breaks [83] | High; direct detection of DNA breaks [5] [82] | Moderate to high (flow cytometry); lower with microscopy [81] | Good predictive value for fertilization and pregnancy rates [82] | Protocol variability affects cutoff values; can be time-consuming [81] [83] |
| SCD (Halo Test) | Microscopic visualization of DNA dispersion halos after denaturation and protein removal [84] [81] | Percentage of sperm without characteristic DNA halo [84] [81] | Moderate [81] | Subject to inter-observer variability [81] | Useful screening tool; predicts IUI outcome [81] | Less objective; requires experienced personnel [81] |
| Comet Assay | Electrophoretic migration of DNA from individual sperm cells [81] [82] | Tail moment (length and intensity of fragmented DNA) [81] | High (detects single and double-strand breaks) [81] | Moderate; technically demanding [81] | Research tool for detailed DNA damage characterization [81] | Labor-intensive; not suitable for high-throughput analysis [81] |
The selection of an appropriate SDF testing methodology must consider the specific clinical or research context. SCSA provides a standardized approach with well-established cutoff values (DFI < 30% associated with better outcomes), while TUNEL offers direct detection of DNA breaks but with greater inter-laboratory variability in reference values [81] [5]. For clinical settings requiring high-throughput analysis with standardized interpretation, SCSA offers significant advantages despite its initial instrumentation requirements.
SCSA Protocol: Detailed Methodology
Sample Preparation and Staining
The SCSA protocol requires precise technical execution to ensure reliable and reproducible DFI measurements. The following procedure outlines the critical steps for proper sample processing based on established methodologies [85] [5]:
- Sample Dilution: Thawed or fresh semen samples are diluted in TNE buffer (0.01 M Tris-HCl, 0.15 M NaCl, 1 mM EDTA, pH 7.4) to a final concentration of 2 × 10⁶ sperm/mL [85] [5].
- Acid Denaturation: 200 µL of the diluted sperm suspension is mixed with 400 µL of acid detergent solution (0.1% Triton X-100, 0.15 M NaCl, 0.08 N HCl, pH 1.2) and homogenized for 30 seconds. This critical step induces partial DNA denaturation in sperm with existing DNA strand breaks [85] [26].
- Acridine Orange Staining: Immediately following acid treatment, 1.2 mL of acridine orange (AO) staining solution (6 µg/mL AO in 0.1 M citric acid, 0.2 M Na₂HPO₄, 1 mM EDTA, 0.15 M NaCl, pH 6.0) is added to the sample [85] [5].
- Incubation: The stained sample is incubated for 180 seconds at room temperature to allow for AO binding to DNA [85].
Flow Cytometric Analysis
Following staining, samples are analyzed using a flow cytometer equipped with a 488 nm excitation laser [85] [5]:
- Fluorescence Detection: Green fluorescence (double-stranded DNA) is measured at 525 ± 40 nm (FITC filter), while red fluorescence (single-stranded DNA) is measured at 610 ± 20 nm (ECD filter) [85].
- Data Acquisition: A minimum of 5,000 events per sample are recorded to ensure statistical reliability [5] [83].
- DFI Calculation: The DNA Fragmentation Index (%DFI) is calculated automatically using dedicated software (e.g., SCSAsoft) based on the ratio of red to total (red + green) fluorescence intensity: %DFI = [Red Fluorescence / (Red + Green Fluorescence)] × 100 [81] [85] [5].
- HDS Measurement: High DNA Stainability (HDS) is calculated as the percentage of sperm with high green fluorescence, indicating immature chromatin with incomplete protamination [26].
The following workflow diagram illustrates the key procedural stages in the SCSA protocol:
Performance Metrics and Clinical Validation
Analytical Sensitivity and Correlation with Other Methods
SCSA demonstrates high analytical sensitivity for detecting sperm DNA damage, with studies showing strong correlation with other SDF assessment methods. In a large-scale validation study comparing SCSA and TUNEL assays across approximately 10,000 patients, researchers observed that both methods produced concordant assessment of sperm DNA fragmentation as a function of patient age [5]. However, the study noted systematic differences in absolute values, with TUNEL typically reporting lower SDF values than SCSA at comparable sensitivity settings [5]. This systematic difference highlights the importance of method-specific reference ranges rather than universal cutoff values across different SDF assessment platforms.
SCSA parameters show significant correlations with conventional semen parameters. DFI demonstrates a strong negative correlation with sperm motility and morphology, while HDS shows a negative correlation with abstinence duration, patient age, and abnormal sperm head morphology [26]. These relationships underscore the biological relevance of SCSA parameters in overall semen quality assessment.
Diagnostic and Prognostic Performance
The clinical utility of SCSA stems from its demonstrated ability to predict reproductive outcomes across different conception modalities. Table 2 summarizes key performance metrics for SCSA in predicting various reproductive endpoints based on comprehensive clinical validation studies.
Table 2: Clinical Performance Metrics of SCSA in Predicting Reproductive Outcomes
| Reproductive Endpoint | SCSA Cutoff | Predictive Value | Evidence Quality | Clinical Context |
|---|---|---|---|---|
| Natural Conception/IUI | DFI < 30% | 7.1x higher pregnancy/delivery rate [81] | Strong (n=1,962) [81] | Unexplained infertility, recurrent pregnancy loss [84] [82] |
| Routine IVF | DFI < 30% | ~2.0x higher pregnancy rate [81] | Moderate (n=375) [81] | Borderline semen parameters, previous failure [82] |
| ICSI Outcomes | DFI < 30% | Non-significant trend (1.7x) [81] | Limited [81] | Severe male factor infertility [84] |
| Varicocele Impact | DFI > 30% | Significant elevation in varicocele patients [83] | Strong [83] | Varicocele-associated infertility [83] [82] |
| Age-Related Decline | DFI increase | Linear increase with aging [5] | Strong (n=10,000) [5] | Advanced paternal age counseling |
Beyond these established metrics, SCSA parameters have demonstrated particular clinical value in specific patient populations. For men with varicocele, DFI values are significantly elevated compared to fertile controls, making SCSA a valuable tool for assessing the impact of varicocele on sperm DNA integrity and potentially guiding surgical intervention decisions [83] [82]. For couples experiencing recurrent pregnancy loss or recurrent ART failure, SCSA identifies male factor contributions that may be missed by conventional semen analysis alone [84] [82].
The following diagram illustrates the relationship between SCSA parameters and their clinical significance in the diagnostic pathway:
Essential Research Reagent Solutions
The implementation of SCSA requires specific reagents and instrumentation to ensure standardized and reproducible results. The following table details the essential research reagent solutions and their critical functions in the SCSA methodology.
Table 3: Essential Research Reagent Solutions for SCSA Implementation
| Reagent/Instrument | Function | Technical Specifications | Quality Control Considerations |
|---|---|---|---|
| TNE Buffer | Sample dilution and stabilization | 0.01 M Tris-HCl, 0.15 M NaCl, 1 mM EDTA, pH 7.4 [85] | Maintain precise pH; filter sterilize to remove particulates |
| Acid Detergent Solution | Partial DNA denaturation | 0.1% Triton X-100, 0.15 M NaCl, 0.08 N HCl, pH 1.2 [85] [26] | Critical concentration; prepare fresh weekly |
| Acridine Orange Stain | Metachromatic DNA binding | 6 µg/mL in citrate-phosphate buffer, pH 6.0 [85] [5] | Protect from light; monitor dye performance with controls |
| Flow Cytometer | Cellular analysis | 488 nm laser; 525±40 nm & 610±20 nm detection [85] [5] | Daily calibration with fluorescent beads |
| SCSAsoft Software | DFI/HDS calculation | Proprietary analysis algorithm [81] | Validate with reference samples |
SCSA represents a robust and standardized approach to sperm DNA fragmentation assessment, offering high sensitivity and reproducibility for both clinical and research applications. Its demonstrated predictive value for natural conception, IUI, and IVF outcomes makes it particularly valuable in cases of unexplained infertility, recurrent pregnancy loss, and recurrent ART failure. While the method requires specialized instrumentation and technical expertise, its standardized protocol and well-established clinical cutoffs (particularly DFI < 30%) provide clinicians with actionable diagnostic information beyond conventional semen analysis. As research continues to refine the interpretation of SCSA parameters across diverse patient populations, this assay remains a cornerstone of comprehensive male fertility assessment, enabling more targeted interventions and improved reproductive counseling.
Sperm DNA fragmentation (SDF) has emerged as a crucial biomarker for male fertility assessment, with the Sperm Chromatin Structure Assay (SCSA) established as a gold standard for its measurement [36] [6]. Unlike conventional semen parameters, SDF provides direct insight into the integrity of paternal genetic material, with significant implications for fertilization, embryo development, and pregnancy outcomes in assisted reproductive technology (ART) [86] [23]. The clinical value of SDF testing hinges on methodological standardization and result reproducibility, areas where SCSA demonstrates particular strength [76] [6].
This protocol outlines the standardized SCSA methodology, presents quantitative data on its correlation with reproductive outcomes, and positions it within the current landscape of SDF detection technologies. By providing a rigorous framework for SCSA implementation, we aim to support its integration into both clinical and research settings for male fertility assessment.
Comparative Analysis of Sperm DNA Fragmentation Assays
Multiple methodologies exist for SDF detection, each with distinct technical principles, advantages, and limitations [72]. The four primary tests used in clinical practice are SCSA, Terminal deoxynucleotidyl transferase dUTP Nick-End Labeling (TUNEL), Sperm Chromatin Dispersion (SCD) test, and COMET assay [72].
Table 1: Comparison of Primary Sperm DNA Fragmentation (SDF) Detection Assays
| Assay | Principle of Detection | Method of Analysis | Key Advantages | Key Limitations |
|---|---|---|---|---|
| SCSA | Measures susceptibility of sperm chromatin to acid-induced DNA denaturation in situ [36] [6] | Flow Cytometry | High statistical robustness (5,000-10,000 cells/sample), excellent repeatability, low inter-laboratory variation, established clinical thresholds [36] [76] [6] | Requires flow cytometer and proprietary software |
| TUNEL | Detects 3'OH ends at single- and double-strand DNA breaks [72] | Flow Cytometry or Fluorescence Microscopy | Detects actual DNA breaks; considered a "direct" measure [72] | Higher inter-laboratory variability, lack of standardized protocol and universal threshold [72] [6] |
| SCD Test | Assesses halo dispersion pattern of nuclear chromatin following acid denaturation and protein removal [72] | Bright-field or Fluorescence Microscopy | Low cost, easy to use, suitable for small labs [87] | Technician-dependent, lower statistical power (50-500 cells/sample), higher coefficient of variation, kit-specific thresholds needed [76] [72] |
| COMET Assay | Detects DNA fragments that migrate during electrophoresis under alkaline conditions [72] | Fluorescence Microscopy | High sensitivity for detecting DNA damage, can analyze small numbers of sperm | Technically demanding, low throughput, high inter-laboratory variability, no standardized threshold [72] [6] |
A direct comparison of these methodologies reveals significant differences in performance and output. Studies show that SCD kits can yield significantly higher median DFI values compared to SCSA and exhibit substantially higher coefficients of variation (CV), indicating lower technical repeatability [76]. Consequently, employing SCSA-derived clinical thresholds for decisions based on SCD-kit DFI values can lead to inappropriate clinical recommendations, such as the unnecessary use of IVF/ICSI [76].
SCSA and Embryonic Development: Quantitative Evidence
The clinical utility of SCSA is underscored by its ability to predict ART outcomes. A recent meta-analysis quantified the relationship between SDF, measured predominantly by SCSA, and embryo euploidy.
Table 2: Impact of Sperm DNA Fragmentation (via SCSA) on Clinical Outcomes in ART
| Outcome Measure | SDF Threshold | Effect Size (Odds Ratio or Correlation) | Statistical Significance (p-value) | Source/Study Context |
|---|---|---|---|---|
| Embryo Euploidy Rate | < 15% (Low) | Reference | - | Meta-analysis of 1,516 ART cycles [86] |
| Embryo Euploidy Rate | 15-30% (Moderate) | Not Significant (Pooled OR = 0.897) | p > 0.05 | Meta-analysis of 1,516 ART cycles [86] |
| Embryo Euploidy Rate | ≥ 30% (High) | Significant Reduction (Pooled OR = 0.742) | p < 0.05 | Meta-analysis of 1,516 ART cycles [86] |
| Miscarriage Rate | Increasing DFI | Positive Correlation (OR 1.095 per unit increase) | p < 0.001 | Study of 6,330 IVF/ICSI cycles [23] |
| Infant Birth Weight | Increasing DFI | Negative Correlation (OR 0.913 per unit increase) | p < 0.001 | Study of 6,330 IVF/ICSI cycles [23] |
| Overall Fertility (Farm Animals) | N/A | Significant Negative Correlation (COR = -0.46) | p < 0.001 | Meta-analysis of 30 studies [88] |
The data demonstrates a threshold-dependent effect, where SDF becomes a significant factor for embryo ploidy primarily when exceeding 30% [86]. Furthermore, elevated SDF is correlated with adverse obstetric and neonatal outcomes, including higher miscarriage rates and lower infant birth weight, highlighting the far-reaching clinical implications of sperm DNA integrity [23].
Detailed SCSA Protocol
Reagents and Equipment
Table 3: Essential Research Reagent Solutions for SCSA
| Item | Specification/Function |
|---|---|
| TNE Buffer | 0.01 M Tris-HCl, 0.15 M NaCl, 1 mM EDTA; pH 7.4. Used for sperm suspension and dilution [76]. |
| Acid Denaturation Solution | 0.08 N HCl, 0.15 M NaCl, 0.1% (v/v) Triton X-100; pH ~1.2. Critical for partial DNA denaturation at sites of strand breaks [76]. |
| Acridine Orange (AO) Staining Solution | 6 µg/mL chromatographically purified AO in a citrate-phosphate buffer (0.2 M Na₂HPO₄, 0.1 M Citric Acid, 1 mM EDTA, 0.15 M NaCl; pH 6.0). Must be purified and used at a specific AO:DNA-P ratio ≥2 [76] [6]. |
| Flow Cytometer | Equipped with a 488 nm excitation laser and standard optical filters (e.g., BD FACSCalibur). Calibration is essential before sample run [76]. |
| SCSAsoft Software | Proprietary software for data analysis, generating scatter plots, and calculating DFI and HDS [76] [6]. |
Step-by-Step Experimental Workflow
Sample Preparation:
- Thaw frozen semen samples rapidly in a 37°C water bath and immediately place on crushed ice [76].
- Dilute a raw semen aliquot in ice-cold TNE buffer to a final concentration of 1-2 × 10⁶ sperm/mL [76].
Acid Denaturation:
- Pipette 200 µL of the sperm suspension into a tube.
- Rapidly add 400 µL of pre-chilled Acid Denaturation Solution.
- Incubate for exactly 30 seconds at room temperature [76].
Acridine Orange Staining:
- After the 30-second denaturation, immediately add 1.2 mL of Acridine Orange Staining Solution.
- Place the sample in the flow cytometer and initiate sample flow within 2 minutes to establish equilibrium between the dye and sperm DNA [76].
Flow Cytometric Analysis:
- Analyze 5,000 individual sperm per sample at a flow rate of 100-250 events/second.
- If the event rate exceeds 250 events/second, prepare a more dilute sample to ensure proper dye equilibrium and measurement accuracy [76].
- Calibrate the flow cytometer with a reference sample at the start of analysis and after every five test samples to maintain instrument stability [76].
Data Analysis:
- Analyze the flow cytometry data using SCSAsoft software.
- The software generates a scatter plot of red (ssDNA) versus green (dsDNA) fluorescence.
- DNA Fragmentation Index (DFI) is calculated as the percentage of sperm with denatured DNA (high red fluorescence) [36] [76].
- High DNA Stainability (HDS) is calculated as the percentage of sperm with immature chromatin (high green fluorescence) [36].
Quality Control and Troubleshooting
- Replicate Analysis: Each sample should be analyzed in duplicate. The assay should be repeated if a >10% difference in DFI is observed between replicates [76].
- Reference Samples: Use internal reference samples to monitor inter-assay precision and instrument performance [76] [6].
- Acridine Orange Quality: Use only chromatographically purified acridine orange to avoid fluorescence artifacts [76].
- Timing: Strictly adhere to the 30-second acid denaturation and subsequent 2-minute staining equilibrium periods, as timing is critical for assay reproducibility.
SCSA Clinical Interpretation and Thresholds
The SCSA provides clinically validated thresholds for male fertility potential, which are more stable and standardized than those for other SDF tests [36] [76].
Table 4: Clinically Validated SCSA Thresholds for Fertility Assessment
| DNA Fragmentation Index (DFI) | Fertility Potential Classification | Clinical Implications and Recommendations |
|---|---|---|
| ≤ 15% | Excellent to Good | Suitable for natural conception or low-complexity treatments like intrauterine insemination (IUI) [76]. |
| > 15% to ≤ 25% | Good to Fair | Consider IUI or proceed to ART (IVF). Lifestyle modifications and antioxidant therapy may be beneficial [86] [76]. |
| > 25% to ≤ 50% | Fair to Poor | Significant negative impact on fertility. Strongly recommend ART (IVF/ICSI). In cases of recurrent failure, consider testicular sperm retrieval [86] [76]. |
| > 50% | Very Poor | Very low probability of achieving pregnancy. Strongly recommend ICSI, possibly with testicular sperm [87] [76]. |
These thresholds are powerful in clinical decision-making. For instance, a DFI >25% is associated with a sharp decline in the probability of successful pregnancy, guiding clinicians toward IVF or ICSI over less complex treatments [76]. Furthermore, a DFI ≥30% is specifically linked to a reduced likelihood of generating euploid embryos, a critical factor in preimplantation genetic testing (PGT) cycles [86].
The SCSA remains the benchmark for SDF testing due to its standardized protocol, flow cytometric precision, and robust clinical thresholds. Its superior reproducibility and predictive value for embryo development and pregnancy outcomes make it an indispensable tool in both clinical andrology and reproductive research. Future efforts should focus on the broader implementation of this standardized protocol to ensure consistent and reliable SDF assessment across laboratories, ultimately improving diagnostic accuracy and patient care in reproductive medicine.
The Sperm Chromatin Structure Assay (SCSA) is a flow cytometric diagnostic tool that provides a robust, objective assessment of sperm nuclear DNA integrity. First described by Evenson et al. in 1980, the SCSA has evolved into a federally registered protocol that measures the susceptibility of sperm DNA to acid-induced denaturation at sites of DNA strand breaks [36] [22] [17]. Unlike conventional semen parameters (concentration, motility, morphology) recommended by the World Health Organization (WHO), which show poor predictive value for fertility potential, the SCSA offers a more reliable marker of male fertility with lower intraindividual and interlaboratory variation [36]. The assay simultaneously measures two critical parameters: the extent of DNA strand breaks (DNA Fragmentation Index, %DFI) and chromatin structure abnormalities (High DNA Stainable fraction, %HDS) [22]. Over the past four decades, the SCSA has been validated through hundreds of publications and has established clinical thresholds that correlate strongly with fertility outcomes across multiple species, including humans, bulls, boars, and stallions [6] [17].
Comparative Analysis of Sperm DNA Integrity Tests
Technical Specifications of Major SDF Assays
Table 1: Comparison of Major Sperm DNA Fragmentation (SDF) Assays
| Assay | Principle | Detection Method | Cells Analyzed | Primary Output | Key Advantages |
|---|---|---|---|---|---|
| SCSA | Acid-induced DNA denaturation at break sites; acridine orange staining | Flow cytometry | 5,000-10,000 | %DFI, %HDS | High statistical power; standardized protocol; excellent repeatability [36] [6] |
| TUNEL | Terminal deoxynucleotidyl transferase adds labeled nucleotides to 3'-OH DNA ends | Flow cytometry or microscopy | 5,000-10,000 (FCM) or 200-300 (microscopy) | % DNA fragmented | Direct labeling of DNA breaks; can distinguish single vs. double strand breaks [36] [5] |
| Comet | Electrophoretic DNA migration from nucleus | Fluorescence microscopy | 50-100 | Tail moment, % DNA in tail | Sensitive to low levels of damage; can detect specific break types [36] |
| SCD (HALO) | Chromatin dispersion after acid denaturation and protein removal | Bright-field microscopy | 50-100 | % sperm with halo | No specialized equipment needed; relatively simple protocol [6] |
Clinical Utility and Performance Characteristics
Table 2: Clinical Thresholds and Predictive Values of SDF Assays
| Assay | Threshold for Natural Conception/IUI | Threshold for ART Consideration | Predictive Strength for Pregnancy | Inter-laboratory Variability |
|---|---|---|---|---|
| SCSA | DFI < 25% [22] [17] | DFI > 25%: Consider ICSI; DFI > 50%: Consider TESE [17] | Strong independent predictor; OR reduced by 8-10 folds when DFI > 30% [36] [17] | Very low (R² = 0.9886 in multi-lab study) [6] |
| TUNEL | Varies (typically 15-20%) | Varies (typically 20-30%) | Moderate to strong correlation | Moderate (protocol-dependent) [5] |
| Comet | Protocol-dependent | Protocol-dependent | Variable correlation | High (protocol variations) [6] |
| SCD | ~30% (protocol-dependent) | ~30% (protocol-dependent) | Moderate correlation | High (protocol variations) [6] |
The SCSA demonstrates superior performance characteristics for clinical and research applications due to its standardized protocol, high statistical robustness from analyzing thousands of cells, and precisely defined clinical thresholds validated through large-scale studies [36] [6]. While TUNEL provides complementary data and shows good correlation with SCSA results, it systematically reports lower fragmentation values due to methodological differences in detecting DNA breaks [5] [32]. The Comet and SCD assays, while useful in research settings, suffer from higher interlaboratory variability and less statistical power due to the smaller number of cells typically analyzed [6].
SCSA Protocol: Detailed Methodologies
Reagent Preparation and Specifications
Table 3: Essential Research Reagent Solutions for SCSA
| Reagent | Composition | Function | Critical Storage Conditions |
|---|---|---|---|
| TNE Buffer | 0.15 M NaCl, 0.01 M Tris-HCl, 0.001 M EDTA, pH 7.4 | Sperm dilution and stabilization; maintains osmotic balance | 4°C; stable for 3 months [22] |
| Acid Detergent Solution | 0.15 M NaCl, 0.08 M HCl, 0.1% Triton X-100, pH 1.2 | Induces partial DNA denaturation at sites of strand breaks | Room temperature in amber glass; stable 6 months [22] [85] |
| Acridine Orange (AO) Stock Solution | 1 mg/ml AO in distilled water | Metachromatic nucleic acid stain; intercalates into dsDNA (green) and binds ssDNA (red) | 4°C in dark; stable 3 months [22] |
| AO Staining Solution | 0.037 M citric acid, 0.126 M Na₂HPO₄, 0.001 M EDTA, 0.15 M NaCl, 6 μg/ml AO, pH 6.0 | Working solution for differential DNA staining | Prepare fresh daily [22] |
Step-by-Step SCSA Protocol
Sample Preparation:
- Fresh or Frozen Samples: Fresh liquefied semen can be processed immediately. Frozen samples should be thawed in a 37°C water bath until the last remnant of ice disappears [22].
- Sperm Dilution: Transfer sufficient volume of semen into 200 μl TNE buffer to achieve approximately 1-2×10⁶ sperm/ml. For most samples, 5-10 μl provides optimal concentration [22] [85].
- Acid Denaturation: Add 400 μl of acid detergent solution (pH 1.2) to the 200 μl sperm suspension. Mix immediately on a laboratory vortex for 30 seconds [22] [85]. This step denatures DNA specifically at sites of existing DNA strand breaks without creating new breaks [32].
- Acridine Orange Staining: After exactly 30 seconds, add 1.20 ml of AO staining solution using an automatic bottle dispenser. Mix immediately on a laboratory vortex [22] [85].
- Flow Cytometric Analysis: Place the sample tube into the flow cytometer and start sample flow. Begin acquisition of data at 3 minutes to allow for AO equilibration and hydrodynamic stabilization [22]. Collect data for at least 5,000 events, ensuring the flow rate does not exceed 300 cells/second [22].
Quality Control Measures:
- Perform duplicate measurements for statistical validation [22]
- Use reference samples with known DFI values for instrument calibration [22]
- Regularly clean flow cytometer tubing with appropriate cleansers to prevent carryover contamination [22]
- Process one sample at a time rather than using an automatic carousel to prevent staining artifacts [22]
SCSA Data Analysis and Interpretation
Computational Analysis and Parameter Definition
The SCSA utilizes specialized software (SCSAsoft) to analyze flow cytometric data and generate two primary parameters [17]:
DNA Fragmentation Index (%DFI): Represents the percentage of sperm with DNA strand breaks, calculated from the ratio of red to total (red + green) fluorescence [36] [17]. The clinical threshold of 25% DFI distinguishes samples with good prognosis for natural conception or IUI from those that may require ICSI [22] [17].
High DNA Stainable (%HDS) Fraction: Measures the percentage of sperm with immature chromatin characterized by incomplete protamination, identified by high green fluorescence due to increased AO binding to histone-complexed DNA [17] [32]. The clinical threshold is 25%, with values above this level associated with early embryonic death due to abnormal chromatin structure [22].
SCSA Experimental Workflow and Clinical Decision Pathway
Clinical Correlation and Predictive Value
The predictive value of SCSA parameters for fertility outcomes has been firmly established through large-scale clinical studies:
Natural Conception: In a study of 165 couples attempting natural conception, 84% of males who achieved pregnancy within 3 months had DFI <15%, while no couples achieved pregnancy when DFI exceeded 30% [32]. Fecundability begins to decline at 20% DFI and becomes negligible at 30-40% DFI [17] [32].
Assisted Reproduction: For intrauterine insemination (IUI), success rates decrease significantly when DFI exceeds 25-30% [36] [17]. In IVF/ICSI treatments, elevated DFI is associated with reduced fertilization rates, impaired embryo quality, and higher miscarriage rates, though the data are more conflicting [36].
Clinical Implications of DNA Fragmentation Index (DFI) Values
Etiology and Implications of Sperm DNA Damage
Biological Mechanisms of DNA Fragmentation
The integrity of sperm DNA can be compromised through multiple interconnected pathways:
Abortive Apoptosis: Defective programmed cell death during spermatogenesis allows abnormal spermatozoa to escape elimination [17].
Oxidative Stress: Reactive oxygen species (ROS) overwhelm antioxidant defenses in seminal plasma, leading to DNA base oxidation and strand breaks [36] [17]. Leukocytes and abnormal spermatozoa are the primary sources of ROS in semen [36].
Defective Chromatin Remodeling: Errors during the histone-to-protamine exchange in spermiogenesis result in poorly compacted chromatin vulnerable to damage [17].
Environmental and Lifestyle Factors: Advanced age, smoking, fever, varicocele, and exposure to genotoxic agents significantly increase DNA fragmentation levels [36] [17].
Impact of Male Age on Sperm DNA Integrity
Recent large-cohort studies (approximately 10,000 patients) demonstrate a strong positive correlation between advancing male age and increasing SDF, as measured by both SCSA and TUNEL assays [5]. This age-dependent increase in DNA fragmentation occurs independently of conventional semen parameters, which show minimal change with aging [5]. The linear increase in SDF with age is attributed to accumulated oxidative damage and reduced DNA repair capacity in spermatogonial stem cells, which undergo approximately 350 replication cycles by age 25 and 750 cycles by age 45 [5].
Implementation Guidelines for Clinical and Research Settings
Test Selection Criteria
When selecting sperm DNA integrity tests for clinical or research applications, consider the following factors:
Statistical Power Requirements: SCSA's analysis of 5,000-10,000 cells provides superior statistical robustness compared to microscopy-based methods analyzing only 50-300 cells [6].
Standardization Needs: SCSA's fixed protocol enables reliable interlaboratory comparisons, while other assays have multiple protocol variations that complicate data interpretation [6] [32].
Clinical Utility: SCSA has well-established thresholds predictive of natural conception, IUI success, and potential need for ICSI, supported by large clinical studies [36] [17] [32].
Sample Logistics: SCSA allows analysis of fresh or flash-frozen samples shipped in liquid nitrogen dry shippers, facilitating multi-center studies and clinical referrals [22].
Applications Beyond Clinical Infertility
The SCSA methodology has diverse applications in research and clinical contexts:
Toxicology Studies: SCSA detects dose-responsive sperm DNA damage from environmental contaminants, pharmaceuticals, and occupational exposures [6] [17].
Male Health Assessment: Elevated SDF serves as a biomarker for general health conditions, including varicocele, metabolic syndrome, and infectious diseases [22].
Animal Breeding Programs: SCSA optimizes selection of breeding stock in agricultural and conservation settings through precise assessment of sperm quality [6].
Assisted Reproduction Technology (ART) Selection: SCSA parameters guide appropriate ART method selection (IUI, IVF, or ICSI) based on individual patient profiles [36] [17].
The comprehensive evidence base supporting SCSA, combined with its standardized protocol and well-defined clinical thresholds, establishes it as the preferred method for assessing sperm DNA integrity in both research and clinical practice. Its implementation provides valuable insights beyond conventional semen analysis, enabling more accurate diagnosis, targeted treatment selection, and improved reproductive outcomes.
Conclusion
The Sperm Chromatin Structure Assay stands as a robust, standardized, and clinically validated tool for assessing sperm DNA integrity, with established thresholds that powerfully predict fertility outcomes. Its precision, reproducibility, and dual-parameter output (DFI and HDS) make it an indispensable asset in both clinical andrology and research. Future directions should focus on the continued refinement of protocol standardization across laboratories and the integration of SCSA data with other omics technologies for a holistic understanding of male factor infertility. For biomedical research, SCSA provides a critical endpoint for studies in reproductive toxicology, the impact of lifestyle on germ cells, and the development of novel therapeutic interventions to improve sperm DNA quality.
References
- 1. The structural organization of sperm chromatin - PubMed - NIH [https://pubmed.ncbi.nlm.nih.gov/12775710/]
- 2. The Art of Packaging the Sperm Genome: Molecular and ... [https://www.frontiersin.org/journals/endocrinology/articles/10.3389/fendo.2022.895502/full]
- 3. Sperm chromatin structure: Insights from in vitro to in situ ... [https://www.sciencedirect.com/science/article/pii/S0955067422000217]
- 4. Comparison of DNA fragmentation index and fertility rate ... [https://pmc.ncbi.nlm.nih.gov/articles/PMC12536677/]
- 5. Sperm chromatin structure assay (SCSA®) and flow cytometry ... [https://bacandrology.biomedcentral.com/articles/10.1186/s12610-023-00208-9]
- 6. The Sperm Chromatin Structure Assay (SCSA®) and other ... [https://www.sciencedirect.com/science/article/pii/S0378432016300276]
- 7. Mapping of histone-binding sites in histone replacement ... [https://www.nature.com/articles/s41467-018-06243-9]
- 8. Sperm Chromatin Structure Assay (SCSA®) for Fertility ... [https://pubmed.ncbi.nlm.nih.gov/35926128/]
- 9. Semen chromatin structure assay (SCSA) [https://bio-protocol.org/exchange/minidetail?id=1981149&type=30]
- 10. Direct but Not Indirect Methods Correlate the Percentages ... [https://www.frontiersin.org/journals/veterinary-science/articles/10.3389/fvets.2021.719319/full]
- 11. Sperm DNA Fragmentation: causes, evaluation and ... [https://pmc.ncbi.nlm.nih.gov/articles/PMC11152411/]
- 12. Understanding the Impact of Sperm DNA Fragmentation on ... [https://posterityhealth.com/ivf-process-for-males/understanding-the-impact-of-sperm-dna-fragmentation-on-ivf-outcomes/]
- 13. Correlation analysis of sperm DNA fragmentation index ... [https://www.nature.com/articles/s41598-023-28765-z]
- 14. Sperm DNA fragmentation testing: a cross sectional survey ... [https://pmc.ncbi.nlm.nih.gov/articles/PMC5643631/]
- 15. Types, Causes, Detection and Repair of DNA ... [https://pmc.ncbi.nlm.nih.gov/articles/PMC3509564/]
- 16. A Comparison Between Two Assays for Measuring ... [https://www.mdpi.com/2073-4425/10/3/236]
- 17. - Wikipedia Sperm Chromatin Structure Assay [https://en.wikipedia.org/wiki/Sperm_Chromatin_Structure_Assay]
- 18. Sperm DNA fragmentation index and high DNA stainability ... [https://pmc.ncbi.nlm.nih.gov/articles/PMC7748016/]
- 19. DNA Fragmentation - an overview [https://www.sciencedirect.com/topics/medicine-and-dentistry/dna-fragmentation]
- 20. clinical practice guidelines for sperm DNA fragmentation ... [https://tau.amegroups.org/article/view/16120/html]
- 21. High DNA Stainability (HDS) [https://www.andrologycenter.in/genetics-hormonal-factors-glossary/high-dna-stainability-hds/]
- 22. ( Sperm ®) for Fertility Assessment... Chromatin Structure Assay SCSA [https://pmc.ncbi.nlm.nih.gov/articles/PMC12016460/]
- 23. Sperm DNA fragmentation index affect pregnancy ... [https://www.nature.com/articles/s41598-023-45091-6]
- 24. The effect of sperm DNA fragmentation index on assisted ... [https://pmc.ncbi.nlm.nih.gov/articles/PMC6732090/]
- 25. Impact of sperm DNA fragmentation index on assisted ... [https://www.frontiersin.org/journals/endocrinology/articles/10.3389/fendo.2024.1530972/full]
- 26. High sperm DNA stainability might not be an accurate ... [https://www.frontiersin.org/journals/endocrinology/articles/10.3389/fendo.2025.1510114/full]
- 27. The mediating role of sperm chromatin [https://www.sciencedirect.com/science/article/pii/S0147651325008887]
- 28. Sperm DNA integrity is critically impacted by male age but ... [https://pmc.ncbi.nlm.nih.gov/articles/PMC9186781/]
- 29. Understanding the impact of lifestyle and demographic ... [https://pmc.ncbi.nlm.nih.gov/articles/PMC12335158/]
- 30. Impact of sperm DNA fragmentation index on assisted ... [https://pubmed.ncbi.nlm.nih.gov/39906032/]
- 31. Sperm chromatin structure assay (SCSA) [https://bio-protocol.org/exchange/minidetail?id=5728069&type=30]
- 32. Evaluation of sperm chromatin structure and DNA strand ... [https://tau.amegroups.org/article/view/16392/html]
- 33. The sperm chromatin structure assay: a review of clinical ... [https://pubmed.ncbi.nlm.nih.gov/16140481/]
- 34. The sperm chromatin structure assay: A review of clinical ... [https://www.sciencedirect.com/science/article/abs/pii/S0378432005001946]
- 35. a comparison of their predictive power for male infertility [https://ecerm.org/journal/view.php?doi=10.5653/cerm.2019.46.1.14]
- 36. Sperm chromatin structure assay (SCSA): a tool in diagnosis ... [https://pmc.ncbi.nlm.nih.gov/articles/PMC3739398/]
- 37. Sperm chromatin structure assay (SCSA®) [https://pubmed.ncbi.nlm.nih.gov/22992911/]
- 38. Chromatin Structure Assessment Using Flow Cytometry ... [https://pubmed.ncbi.nlm.nih.gov/40202645/]
- 39. Flow Cytometry [https://www.scsadiagnostics.com/test/flow-cytometry]
- 40. Sperm chromatin structure assay (SCSA®) and flow cytometry ... [https://pmc.ncbi.nlm.nih.gov/articles/PMC10688019/]
- 41. Assessment of the sperm DNA Fragmentation using SCSA ... [https://www.jomh.org/articles/10.22514/jomh.2024.167]
- 42. Sperm chromatic structure assay (SCSA) [https://bio-protocol.org/exchange/minidetail?id=6991482&type=30]
- 43. FAQs [https://www.scsadiagnostics.com/test/faqs]
- 44. Could high DNA stainability ( HDS ) be a valuable indicator of sperm... [https://bacandrology.biomedcentral.com/articles/10.1186/s12610-020-00110-8]
- 45. Fine particulate matter exposure and sperm DNA ... [https://pmc.ncbi.nlm.nih.gov/articles/PMC12491671/]
- 46. Negative Impact of Elevated DNA Fragmentation and Human... [https://pubmed.ncbi.nlm.nih.gov/33670283/]
- 47. The Sperm Chromatin Structure Assay (SCSA(®)) and ... [https://pubmed.ncbi.nlm.nih.gov/26919909/]
- 48. Sperm Chromatin Structure Assay (SCSA) [https://www.ohsu.edu/womens-health/sperm-chromatin-structure-assay-scsa]
- 49. Effect of freeze-thawing procedure on chromatin stability, ... [https://pubmed.ncbi.nlm.nih.gov/10367235/]
- 50. The effect of repeated freezing and thawing on human ... [https://www.sciencedirect.com/science/article/pii/S0015028208045858]
- 51. Effects of Freeze–Thaw Cycles on the Structures and ... [https://pmc.ncbi.nlm.nih.gov/articles/PMC10418645/]
- 52. Freezing-induced protein aggregation - Role of pH shift ... [https://www.sciencedirect.com/science/article/abs/pii/S0168365920302467]
- 53. Impact of cryopreservation agents on sperm quality, DNA ... [https://www.nature.com/articles/s41598-025-15456-0]
- 54. Comparing the different methods of sperm chromatin ... [https://pmc.ncbi.nlm.nih.gov/articles/PMC7483454/]
- 55. Clinical utility of sperm DNA fragmentation testing [https://pmc.ncbi.nlm.nih.gov/articles/PMC5643614/]
- 56. A systematic review on sperm DNA fragmentation in male ... [https://www.sciencedirect.com/science/article/pii/S2090598X17301523]
- 57. Establishing the normal range of sperm DNA fragmentation ... [https://www.nature.com/articles/s41598-023-46928-w]
- 58. Calculating Inter- and Intra-Assay Coefficients of Variability [https://salimetrics.com/calculating-inter-and-intra-assay-coefficients-of-variability/]
- 59. Multi-laboratory assessment of reproducibility, qualitative and ... [https://pmc.ncbi.nlm.nih.gov/articles/PMC5566333/]
- 60. Establishing the normal range of sperm DNA fragmentation ... [https://pmc.ncbi.nlm.nih.gov/articles/PMC10654681/]
- 61. Guidelines for the use of flow cytometry and cell sorting in ... [https://pmc.ncbi.nlm.nih.gov/articles/PMC9165548/]
- 62. Beyond the Limits: How Is Spectral Flow Cytometry ... [https://pmc.ncbi.nlm.nih.gov/articles/PMC12248732/]
- 63. Optimization of the flow cytometry method of detection, ... [https://www.sciencedirect.com/science/article/pii/S0308814624022568]
- 64. Flow Cytometry Panel Design: The Basics [https://www.thermofisher.com/us/en/home/references/newsletters-and-journals/bioprobes-journal-of-cell-biology-applications/bioprobes-71/bioprobes-71-flow-cytometry-panel-design.html]
- 65. Optimization of the Blocking and Signal Preservation ... [https://pmc.ncbi.nlm.nih.gov/articles/PMC12462741/]
- 66. Sperm chromatin structure assay results after swim-up are ... [https://pmc.ncbi.nlm.nih.gov/articles/PMC3739549/]
- 67. Comparative Efficacy of Swim-Up, Density-Gradient ... [https://pmc.ncbi.nlm.nih.gov/articles/PMC12049673/]
- 68. Sperm chromatin structure assay (scsa®) parameters are ... [https://www.sciencedirect.com/science/article/pii/S0015028204000378]
- 69. SCSA Test [https://www.scsadiagnostics.com/test]
- 70. swim-up versus gradient-density centrifugation technique [https://www.sciencedirect.com/science/article/pii/S0015028207041349]
- 71. Comparison of TUNEL, SCSA, SCD Test and COMET Assay [https://pubmed.ncbi.nlm.nih.gov/41009547/]
- 72. Comparison of TUNEL, SCSA, SCD Test and COMET Assay [https://www.mdpi.com/1422-0067/26/18/8978]
- 73. TUNEL staining [https://www.abcam.com/en-us/technical-resources/guides/cell-health-guide/tunel-staining-or-tunel-assay]
- 74. Click-iT TUNEL Alexa Fluor Imaging Assay Protocol [https://www.thermofisher.com/us/en/home/references/protocols/cell-and-tissue-analysis/apoptosis-protocol/tunel-protocols/click-it-tunel-alexa-fluor-imaging-assay-protocol.html]
- 75. Validation of the sperm chromatin dispersion (SCD) test in ... [https://pubmed.ncbi.nlm.nih.gov/25482041/]
- 76. Sperm chromatin structure assay versus ... [https://pmc.ncbi.nlm.nih.gov/articles/PMC7711102/]
- 77. SCSA vs TUNEL vs SCD: Which Sperm DNA Test Is Best? [https://www.andrologycenter.in/blog/scsa-vs-tunel-vs-scd-which-sperm-dna-test-is-most-accurate/]
- 78. TUNEL assay and SCSA determine different aspects of ... [https://pubmed.ncbi.nlm.nih.gov/20860629/]
- 79. Concordance among sperm deoxyribonucleic acid integrity ... [https://www.sciencedirect.com/science/article/pii/S0015028215002964]
- 80. Concordance among sperm deoxyribonucleic acid integrity ... [https://pubmed.ncbi.nlm.nih.gov/25989978/]
- 81. Utility of sperm DNA fragmentation testing in different ... [https://pmc.ncbi.nlm.nih.gov/articles/PMC5643697/]
- 82. Commentary: the value of testing sperm DNA fragmentation in ... [https://tau.amegroups.org/article/view/13998/html]
- 83. DNA breakpoints and free DNA fragments as potential ... [https://www.nature.com/articles/s41598-024-81252-x]
- 84. Efficacy of Various Sperm Selection Strategies in Obtaining ... [https://pmc.ncbi.nlm.nih.gov/articles/PMC12541169/]
- 85. 2.3.3. Sperm chromatin structure assay (SCSA) [https://bio-protocol.org/exchange/minidetail?id=18899337&type=30]
- 86. Effect of sperm DNA fragmentation on embryo euploidy rate in ... [https://pmc.ncbi.nlm.nih.gov/articles/PMC12625451/]
- 87. Study Protocol: Comparison of Clinical Pregnancy ... [https://pmc.ncbi.nlm.nih.gov/articles/PMC12156518/]
- 88. Association between sperm DNA fragmentation and fertility ... [https://bmcvetres.biomedcentral.com/articles/10.1186/s12917-025-04652-9]