WGBS vs. EPIC Array vs. EM-seq: A 2025 Researcher's Guide to DNA Methylation Analysis
Accurate DNA methylation quantification is pivotal for epigenetics research and clinical biomarker development.
WGBS vs. EPIC Array vs. EM-seq: A 2025 Researcher's Guide to DNA Methylation Analysis
Abstract
Accurate DNA methylation quantification is pivotal for epigenetics research and clinical biomarker development. This article provides a comprehensive, evidence-based comparison of three cornerstone technologies: the established gold standard Whole-Genome Bisulfite Sequencing (WGBS), the high-throughput Illumina EPIC array, and the emerging enzymatic method, EM-seq. Drawing on the latest 2025 research, we dissect their fundamental principles, guide method selection for specific applications like liquid biopsies and low-input samples, address common troubleshooting and optimization challenges, and present rigorous validation data. Designed for researchers and drug development professionals, this guide delivers actionable insights to inform robust experimental design and data interpretation in methylation studies.
Core Principles of DNA Methylation Profiling: From Bisulfite Chemistry to Enzymatic Conversion
For decades, whole-genome bisulfite sequencing (WGBS) has stood as the undisputed gold standard for DNA methylation analysis, providing researchers with comprehensive, single-base resolution maps of 5-methylcytosine (5mC) across the genome. This epigenetic mark plays crucial roles in gene regulation, cellular differentiation, and disease pathogenesis. However, this unparalleled resolution comes with a significant compromise: the harsh chemical treatment required for bisulfite conversion severely compromises DNA integrity, fragmenting molecules and limiting applications where sample material is precious or already fragmented. This fundamental flaw has driven the development of alternative technologies, including the Infinium MethylationEPIC (EPIC) microarray and the more recent enzymatic methyl-sequencing (EM-seq), each offering distinct trade-offs between coverage, resolution, DNA preservation, and cost. This guide objectively compares the performance of WGBS against the EPIC array and EM-seq, providing researchers with the experimental data necessary to select the optimal method for their specific investigation.
Methodological Foundations: Core Technologies and Workflows
Whole-Genome Bisulfite Sequencing (WGBS)
The conventional WGBS workflow begins with bisulfite treatment of genomic DNA, typically using high concentrations of sodium bisulfite under elevated temperatures and acidic conditions. This treatment deaminates unmethylated cytosines to uracils, which are subsequently read as thymines during PCR amplification and sequencing, while methylated cytosines remain protected from conversion. The critical limitation is that the same reaction conditions that drive efficient cytosine deamination also cause extensive DNA damage through depurination and backbone cleavage [1]. As one recent study noted, "Bisulfite treatment is a harsh method involving extreme temperatures and strong basic conditions, introducing single-strand breaks and substantial fragmentation of DNA" [1]. Following conversion, libraries are prepared through adapter ligation, amplification, and ultimately sequenced on short-read platforms, with bioinformatic pipelines reconstructing methylation patterns by comparing sequence reads to a reference genome.
Infinium MethylationEPIC BeadChip Array
The EPIC array technology employs a fundamentally different approach, using probe hybridization rather than sequencing to assess methylation status. The platform features over 930,000 pre-designed probes targeting specific CpG sites primarily located in gene promoters, enhancers, and other regulatory regions. The method relies on differential hybridization of bisulfite-converted DNA to these probes, with fluorescent signals indicating methylation levels at each site. The current EPICv2 array retains approximately 77% of probes from its predecessor (EPICv1) while adding over 200,000 new probes designed for enhanced coverage of regulatory elements, with annotation to the GRCh38/hg38 human genome build [2]. The method provides a cost-effective solution for population-scale studies but is fundamentally limited to interrogating pre-defined genomic positions.
Enzymatic Methyl-Sequencing (EM-seq)
EM-seq represents a technological advancement that replaces chemical deamination with an enzymatic conversion process to distinguish methylated from unmethylated cytosines. The method first uses the TET2 enzyme to oxidize 5-methylcytosine (5mC) to 5-carboxylcytosine (5caC), while T4 β-glucosyltransferase protects 5-hydroxymethylcytosine from further oxidation. The APOBEC enzyme then selectively deaminates unmodified cytosines to uracils, while all modified cytosines remain protected [1] [3]. This enzymatic approach circumvents the DNA fragmentation issues inherent to bisulfite treatment while achieving the same base-resolution output as WGBS. As noted in benchmarking studies, "Unlike bisulfite treatment, enzymatic conversion does not further fragment the DNA after adapter ligation, thereby preserving DNA integrity and reducing sequencing bias while also improving CpG detection" [1].
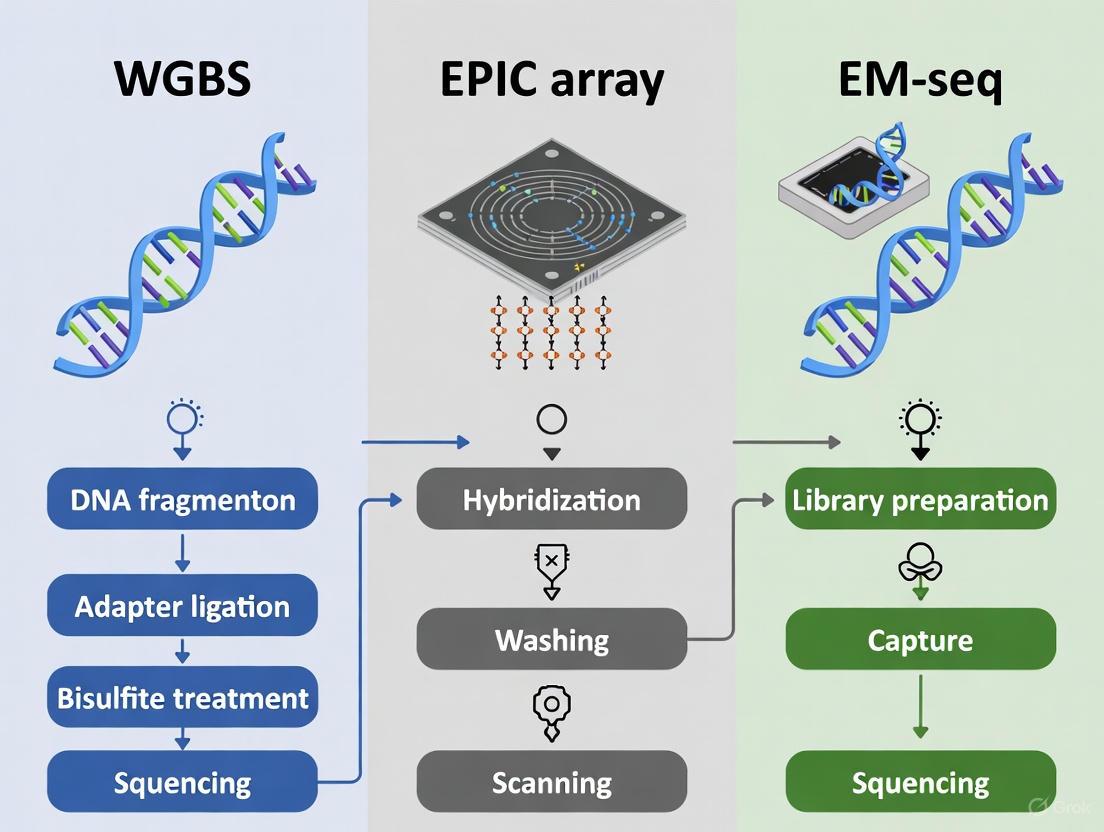
The diagram below illustrates the fundamental procedural differences between these three core methodologies:
Comparative Performance Analysis: Quantitative Data
The table below summarizes key performance metrics for WGBS, EPIC array, and EM-seq based on recent comparative studies:
| Performance Metric | WGBS | EPIC Array | EM-seq |
|---|---|---|---|
| Resolution | Single-base | Single-base (but targeted) | Single-base |
| Genomic Coverage | ~80% of CpGs [1] | >930,000 predefined CpGs [2] | Comparable to WGBS [1] |
| DNA Input Requirements | High (100 ng - 1 µg) [3] | Moderate (500 ng) [1] | Low (1-10 ng) [3] |
| DNA Damage | Severe fragmentation [4] [1] | Moderate (requires bisulfite conversion) | Minimal [4] [1] |
| Conversion Efficiency | >99.5% (with optimized protocols) [4] | >99.5% | >99% (but higher background at low inputs) [4] |
| CpG Detection in GC-Rich Regions | Reduced due to bisulfite bias [3] | Probe-dependent, potential cross-hybridization [3] | Enhanced coverage [3] |
| Technical Reproducibility | High in high-input samples [3] | Very high [5] | High, even in low-input samples [3] |
| Cost per Sample | High [1] | Low [5] [1] | Moderate to High [3] |
| Best Applications | Comprehensive methylation discovery | Large cohort studies, clinical screening | Low-input samples, precious specimens, GC-rich regions |
A direct comparison between WGBS and EM-seq performance using low-input DNA samples from Arabidopsis thaliana revealed that EM-seq detected 32% more methylation sites on average across CG, CHG, and CHH contexts when input DNA fell below 50ng. Additionally, while both technologies showed high consistency in detecting methylation at CG sites (R² = 0.89), EM-seq maintained superior technical reproducibility with low-input samples, evidenced by a 64% reduction in methylation status misidentification compared to WGBS [3].
Technical Considerations and Method Selection Guide
Impact of DNA Degradation on Data Quality
The DNA fragmentation inherent to conventional bisulfite treatment has cascading effects on data quality. Studies demonstrate that WGBS libraries exhibit significantly shorter insert sizes (100-200bp) compared to EM-seq libraries (300-500bp) [3]. This fragmentation reduces library complexity, increases duplicate rates, and introduces coverage biases, particularly in GC-rich regions like CpG islands and gene promoters. One recent evaluation found that "bisulfite treatment results in the chemical deamination of unmethylated cytosines and subsequently their change to thymines. This induces DNA fragmentation and degradation, thus requiring high amounts of DNA input" [6]. These limitations become particularly problematic when working with clinically relevant sample types such as cell-free DNA (cfDNA), formalin-fixed paraffin-embedded (FFPE) tissues, or other specimens where DNA quantity and quality are limiting.
Advancements in Bisulfite Chemistry
Recent innovations in bisulfite chemistry have aimed to mitigate the DNA damage issue while maintaining conversion efficiency. The newly developed Ultra-Mild Bisulfite Sequencing (UMBS-seq) method optimizes bisulfite concentration and reaction pH to achieve efficient cytosine conversion under milder conditions. When compared directly to conventional bisulfite treatment and EM-seq, UMBS-seq demonstrated significantly reduced DNA fragmentation while maintaining conversion efficiencies >99.9%, even with input amounts as low as 10pg [4]. In evaluations using cfDNA, UMBS-seq preserved the characteristic triple-peak profile of cfDNA fragments after treatment, whereas conventional bisulfite methods did not, indicating superior DNA preservation [4].
Concordance Between Platforms
Despite their technical differences, studies generally report strong correlation between methylation measurements obtained from different platforms when analyzing overlapping genomic regions. A 2025 study comparing targeted bisulfite sequencing to the Infinium MethylationEPIC array found "strong sample-wise correlation between platforms, particularly in ovarian tissue samples" [5]. Similarly, evaluations of EPICv1 versus EPICv2 arrays demonstrated high concordance at the array level, though with variable agreement at individual probes, necessitating appropriate batch correction strategies for studies combining data from both versions [2]. When comparing EM-seq to WGBS, one comprehensive analysis concluded that "EM-seq showed the highest concordance with WGBS, indicating strong reliability due to their similar sequencing chemistry" [1].
Research Reagent Solutions Toolkit
The table below outlines essential reagents and kits used in DNA methylation profiling studies:
| Reagent/Kits | Primary Function | Method Applicability |
|---|---|---|
| EZ DNA Methylation-Gold Kit (Zymo Research) | Bisulfite conversion of DNA | WGBS, EPIC array |
| NEBNext EM-seq Kit (New England Biolabs) | Enzymatic conversion of DNA | EM-seq |
| QIAseq Targeted Methyl Panel (QIAGEN) | Targeted bisulfite sequencing | Focused validation studies |
| Infinium MethylationEPIC v2.0 BeadChip (Illumina) | Genome-wide methylation array | EPIC array |
| Accel-NGS Methyl-Seq Kit (Swift Biosciences) | Library preparation for bisulfite sequencing | WGBS |
| UMBS-seq Reagents | Ultra-mild bisulfite conversion | Low-input WGBS |
The landscape of DNA methylation profiling continues to evolve, with each major technology offering distinct advantages and compromises. WGBS remains the most comprehensive approach for novel methylation discovery but imposes significant costs both financially and in terms of DNA integrity. The EPIC array provides an exceptionally cost-effective solution for targeted analyses in large cohorts but lacks the flexibility to investigate regions beyond its predefined probe set. EM-seq emerges as a compelling alternative that bridges the gap between these approaches, offering WGBS-like resolution with dramatically reduced DNA damage, particularly advantageous for low-input and precious samples.
Future methodological developments will likely focus on further reducing input requirements, improving coverage uniformity in challenging genomic regions, and decreasing costs to enable even larger-scale studies. The integration of long-read sequencing technologies for methylation analysis presents another promising direction, potentially allowing for phased methylation mapping and resolution of complex genomic regions. As these technologies mature, researchers must continue to make informed decisions based on their specific experimental needs, sample limitations, and analytical requirements, recognizing that the choice of methylation profiling platform fundamentally shapes the biological insights that can be obtained.
DNA methylation is a fundamental epigenetic mechanism that regulates gene expression without altering the underlying DNA sequence, playing crucial roles in development, aging, and disease pathogenesis [7]. As interest in epigenetics has grown, so too has the methodological landscape for profiling genome-wide methylation patterns. Three prominent technologies have emerged as leaders in the field: whole-genome bisulfite sequencing (WGBS), which offers single-base resolution across the entire genome; enzymatic methyl-sequencing (EM-seq), which uses enzymatic conversion to avoid DNA degradation; and the EPIC array, a probe-based microarray platform designed for targeted high-throughput analysis [7] [8]. The EPIC array's specific design philosophy centers on efficiently targeting pre-defined genomic regions of high biological interest, making it particularly suitable for large-scale epidemiological studies and clinical research where hundreds or thousands of samples must be processed economically [9] [10]. This review systematically compares the technical performance, practical considerations, and optimal application contexts of these three dominant methylation profiling approaches, with particular emphasis on the EPIC array's targeted design advantages for cohort studies.
Technical Comparison of Major Methylation Profiling Methods
The following table summarizes the core characteristics of WGBS, EM-seq, and EPIC array technologies, highlighting their distinct advantages and limitations for different research scenarios.
Table 1: Technical comparison of WGBS, EM-seq, and EPIC array technologies
| Feature | WGBS | EM-seq | EPIC Array |
|---|---|---|---|
| Resolution | Single-base | Single-base | Single-base (but targeted only) |
| Coverage | ~28 million CpGs (~80% of genome) [11] | Comparable to WGBS [7] | ~935,000 predefined CpG sites (EPICv2) [10] |
| Conversion Method | Bisulfite (chemical) | Enzymatic (TET2/APOBEC) [8] | Bisulfite (chemical) |
| DNA Input | High (μg level) [8] | Low (ng level, down to 10 ng) [8] | 250 ng recommended, down to 20 ng demonstrated [9] |
| DNA Degradation | Significant fragmentation [7] [11] | Minimal damage [8] | Not a primary concern post-conversion |
| GC-Rich Region Bias | Yes, poor coverage [11] | More uniform coverage [11] | Probe-dependent, some cross-hybridization concerns [3] |
| Cost per Sample | High | High | Low to moderate [7] |
| Data Analysis Complexity | High | High (specialized tools needed) [8] | Low (standardized pipelines) [7] |
| Throughput | Moderate | Moderate | High [12] |
| Best For | Discovery without pre-selection, non-model organisms | Low-input samples, GC-rich regions, minimal DNA damage | Large cohort studies, clinical applications, targeted analysis |
Performance Metrics and Experimental Data
Recent comparative studies have quantitatively assessed the performance of these methylation profiling platforms across multiple dimensions, including reproducibility, coverage uniformity, and accuracy relative to established standards.
Table 2: Performance comparison based on recent experimental studies
| Performance Metric | WGBS | EM-seq | EPIC Array |
|---|---|---|---|
| Correlation with WGBS | Gold Standard | Very high (highest concordance) [7] | High for shared CpG sites [7] |
| Technical Reproducibility | High (but input-dependent) | Very high (ICC >0.85) [3] | Very high (Spearman ρ >0.995) [9] [10] |
| CpG Detection in GC-Rich Regions | Low coverage [11] | Superior to WGBS [11] | Varies by specific probe design |
| Probe Detection Rate with Low-Input/Fragmented DNA | Not applicable | Maintained with low input [8] | ~90% (100 ng, 350 bp fragments) to ~43% (highly fragmented) [9] |
| Library Complexity/Uniformity | Good, but GC-biased | Higher than WGBS, less biased [11] | Consistent across samples |
Experimental evidence from a comprehensive 2025 evaluation demonstrates that EM-seq shows the highest concordance with WGBS, confirming its reliability for full-genome methylation analysis [7]. Meanwhile, the EPIC array platform generates highly reproducible data, with technical replicates showing Spearman correlation coefficients exceeding 0.995 under optimal conditions (high-quality DNA, 250 ng input) [9] [10]. This reproducibility remains robust even with suboptimal inputs, maintaining a 90% probe detection rate with 100 ng of 350 bp average fragment size DNA [9].
When assessing performance with challenging samples, EPIC arrays maintain better data quality with moderately degraded DNA compared to WGBS, though highly fragmented DNA (95 bp average fragment size) fails quality control regardless of input amount [9]. EM-seq consistently outperforms WGBS in coverage uniformity, particularly in GC-rich regions like CpG islands, due to its less destructive conversion methodology [11].
Experimental Protocols for Method Evaluation
DNA Sample Preparation and Processing
For systematic comparisons of methylation detection technologies, researchers typically begin with well-characterized DNA samples from various sources. Recent comparative studies have utilized DNA extracted from human tissue, cell lines (such as GM12878, LNCaP, K562, and HCT116), and whole blood [7] [10]. DNA purity is assessed using NanoDrop 260/280 and 260/230 ratios, followed by quantification with fluorometric methods like Qubit to ensure accurate measurement of double-stranded DNA content [7].
To evaluate platform performance with degraded material, systematic fragmentation using instruments such as the Covaris S220 can be employed to create DNA with defined average fragment sizes (350, 230, 165, and 95 bp) [9]. The degree of fragmentation is confirmed using microfluidic analysis systems like the Agilent Bioanalyzer, and Degradation Indexes can be calculated using quantitative PCR methods such as the Quantifiler Trio DNA Quantification Kit [9].
Platform-Specific Library Preparation and Processing
EPIC Array Protocol: The standard protocol begins with bisulfite conversion of 250-500 ng genomic DNA using the EZ DNA Methylation Kit (Zymo Research), following manufacturer recommendations for Infinium assays [7] [9]. The bisulfite-converted DNA is then whole-genome amplified, fragmented, and hybridized to the EPIC BeadChip array. After hybridization, the array undergoes single-base extension with fluorescently labeled nucleotides, followed by imaging on the iScan System to obtain raw intensity data files (.idat) [9]. Data preprocessing typically employs packages like minfi or SeSAMe in R, which perform normalization and calculate β-values representing methylation levels (from 0 for completely unmethylated to 1 for fully methylated) [7] [9].
WGBS Protocol: Standard WGBS protocols involve fragmenting genomic DNA, followed by bisulfite conversion using kits such as the EZ DNA Methylation-Gold Kit (Zymo Research). After conversion, libraries are prepared with methylated adapters, PCR amplified, and sequenced on high-throughput platforms like Illumina NovaSeq to achieve sufficient coverage (typically 10-30×) [7]. Bioinformatic processing involves alignment to a bisulfite-converted reference genome using tools like Bismark or BSMAP, followed by methylation extraction at each cytosine position.
EM-seq Protocol: The EM-seq approach begins with enzymatic conversion rather than bisulfite treatment. Specifically, the TET2 enzyme oxidizes 5-methylcytosine (5mC) and 5-hydroxymethylcytosine (5hmC) to 5-carboxylcytosine (5caC), while T4 β-glucosyltransferase (T4-BGT) glucosylates 5hmC to protect it from deamination [7] [8]. The APOBEC enzyme then deaminates unmodified cytosines to uracils, while all oxidized derivatives remain protected. After this enzymatic conversion, standard library preparation for Illumina sequencing follows [8].
Essential Research Reagent Solutions
The following table catalogues key laboratory reagents and their specific functions in DNA methylation analysis protocols across the three platforms.
Table 3: Essential research reagents for DNA methylation analysis
| Reagent/Kits | Function | Application Across Technologies |
|---|---|---|
| EZ DNA Methylation Kit (Zymo Research) | Bisulfite conversion of unmethylated cytosines | WGBS, EPIC Array [7] [9] |
| Nanobind Tissue Big DNA Kit (Circulomics) | High-quality DNA extraction from tissue samples | All methods (sample preparation) [7] |
| DNeasy Blood & Tissue Kit (Qiagen) | DNA extraction from blood and cell lines | All methods (sample preparation) [7] |
| Infinium MethylationEPIC v2.0 BeadChip | Microarray with ~935,000 probes for methylation detection | EPIC Array exclusively [9] [10] |
| TET2 Enzyme & APOBEC Mix | Enzymatic conversion of unmodified cytosines | EM-seq exclusively [8] |
| Covaris S220 System | DNA shearing for controlled fragmentation | Method evaluation studies [9] |
| High Sensitivity DNA Kit (Agilent) | Quality control of DNA fragment size | All methods (QC) [9] |
| Qubit dsDNA HS Assay Kit | Accurate DNA quantification | All methods (QC) [9] |
Workflow and Technology Selection Diagrams
DNA Methylation Analysis Workflow Comparison
Methylation Technology Selection Guide
The EPIC array occupies a distinct and valuable position in the landscape of DNA methylation analysis technologies. While WGBS remains the gold standard for comprehensive genome-wide discovery and EM-seq offers superior performance for low-input samples and GC-rich regions, the EPIC array provides an optimal solution for large-scale targeted methylation studies [7] [11]. Its strengths in cost-effectiveness, high throughput, analytical reproducibility, and user-friendly data analysis make it particularly suitable for epigenome-wide association studies (EWAS) involving thousands of samples [7] [10].
Recent enhancements in the EPICv2 array, including expanded coverage of enhancer regions and improved probe mapping, have further strengthened its utility for diverse research applications [10] [12]. However, researchers must remain cognizant of its limitations in genome-wide discovery and performance with highly degraded DNA samples [9]. The choice between these technologies ultimately depends on specific research questions, sample characteristics, and resource constraints, with the understanding that these methods often provide complementary insights into the complex landscape of DNA methylation.
DNA methylation, the covalent addition of a methyl group to the fifth carbon of a cytosine base, is a fundamental epigenetic mechanism that regulates gene expression without altering the underlying DNA sequence [7] [13]. This modification plays crucial roles in genomic imprinting, X-chromosome inactivation, embryonic development, and cellular differentiation, with alterations in methylation patterns being implicated in various diseases, including cancer [7] [14]. For decades, bisulfite conversion-based methods have been the gold standard for detecting DNA methylation, particularly whole-genome bisulfite sequencing (WGBS) which provides single-base resolution methylation data across the entire genome [7] [13]. However, the harsh conditions of bisulfite treatment—involving extreme temperatures and pH levels—cause substantial DNA degradation through depyrimidination, leading to DNA fragmentation, loss of sequencing material, and biased genome coverage [7] [14] [11].
The limitations of bisulfite-based methods have driven the development of alternative approaches that circumvent these issues while maintaining detection accuracy. Among these emerging technologies, Enzymatic Methyl Sequencing (EM-seq) has positioned itself as a robust alternative that replaces chemical conversion with a gentler enzymatic process [7] [14]. This article explores the enzymatic mechanism of EM-seq, comparing its performance against established methods like WGBS and EPIC arrays, with a focus on its unique advantages in preserving DNA integrity and enhancing coverage, particularly in challenging genomic regions.
Understanding the EM-seq Enzymatic Mechanism
The Step-by-Step Enzymatic Conversion Process
EM-seq utilizes a series of enzymatic reactions to distinguish methylated from unmethylated cytosines without damaging the DNA backbone. The process involves two primary enzymatic steps that protect modified cytosines while converting unmodified ones:
Protection of 5-methylcytosine (5mC) and 5-hydroxymethylcytosine (5hmC): The first reaction employs the TET2 enzyme, a Fe(II)/alpha-ketoglutarate-dependent dioxygenase that oxidizes 5mC through a cascade of reactions: first to 5hmC, then to 5-formylcytosine (5fC), and finally to 5-carboxylcytosine (5caC) [14] [15]. Simultaneously, T4 phage beta-glucosyltransferase (T4-BGT) glucosylates any endogenous 5hmC present in the DNA sample, forming 5-(β-glucosyloxymethyl)cytosine (5gmC) [14]. This combined action effectively "protects" all methylated and hydroxymethylated cytosines from subsequent deamination.
Deamination of Unmodified Cytosines: Following the protection step, the enzyme APOBEC3A (apolipoprotein B mRNA editing enzyme catalytic subunit 3A) deaminates unmodified cytosines, converting them to uracils [14] [15]. The protected forms of cytosine (5caC, 5gmC) are resistant to this deamination. During subsequent PCR amplification, the uracils are converted to thymines, while the protected cytosines are read as cytosines, enabling discrimination between methylated and unmethylated positions during sequencing [14].
This enzymatic cascade can be visualized through the following pathway diagram:
Key Advantages Over Bisulfite Conversion
The enzymatic approach of EM-seq offers several distinct advantages over traditional bisulfite conversion:
Preserved DNA Integrity: Unlike bisulfite treatment which causes DNA strand breaks and fragmentation, the enzymatic reactions in EM-seq are much gentler, maintaining DNA integrity and molecular length [14] [15]. This results in higher-quality sequencing libraries with less biased representation of genomic regions.
Superior Coverage in GC-Rich Regions: Bisulfite conversion disproportionately affects GC-rich regions due to their high cytosine content, leading to substantial coverage gaps [11]. EM-seq demonstrates more uniform coverage across the genome, including CpG islands and promoter regions which are typically GC-rich [7] [11].
Lower DNA Input Requirements: EM-seq effectively handles lower amounts of input DNA (as little as 100 picograms), making it suitable for precious or limited samples such as clinical biopsies, cell-free DNA, and single-cell analyses [14] [15] [3].
Detection of Multiple Cytosine Modifications: The EM-seq methodology naturally enables detection of both 5mC and 5hmC, providing a more comprehensive view of the methylation landscape [14] [15].
Comparative Performance Analysis: EM-seq vs. Established Methods
Methodology of Comparison Studies
Recent comprehensive studies have directly compared EM-seq with established methylation profiling methods using identical biological samples to ensure fair evaluation. The standard experimental approach involves:
Sample Selection: DNA is extracted from multiple sources, typically including human cell lines (e.g., MCF7 breast cancer cells), whole blood, and tissues (e.g., colorectal cancer biopsies) [7] [11]. This diversity ensures assessment across various biological contexts.
Parallel Library Preparation: For each sample type, libraries are prepared in parallel using:
- EM-seq: Utilizing the enzymatic conversion method with TET2, T4-BGT, and APOBEC3A [14]
- WGBS: Employing standard sodium bisulfite conversion protocols [7]
- EPIC Array: Using the Illumina Infinium MethylationEPIC BeadChip platform [7] [11]
- Oxford Nanopore Technologies (ONT): Direct sequencing without conversion [7] [11]
Sequencing and Data Analysis: Libraries are sequenced on appropriate platforms, followed by bioinformatic processing using standardized pipelines such as Bismark for read alignment and MethylC-analyzer for downstream analysis [16]. Key metrics including coverage uniformity, CpG detection, methylation concordance, and GC bias are systematically evaluated [7] [11] [16].
Table 1: Technical Comparison of DNA Methylation Profiling Methods
| Parameter | EM-seq | WGBS | EPIC Array | ONT Sequencing |
|---|---|---|---|---|
| Conversion Method | Enzymatic | Bisulfite | Bisulfite | None (direct detection) |
| DNA Integrity | Preserved | Fragmented | Fragmented | Preserved |
| Single-Base Resolution | Yes | Yes | No (targeted) | Yes |
| Input DNA Requirements | 100 pg - 100 ng [14] [3] | 100 ng+ [3] | 500 ng [7] | ~1 μg [7] |
| Genome Coverage | ~28 million CpGs [11] | ~28 million CpGs [11] | ~935,000 CpGs [7] [11] | Varies with sequencing depth |
| GC-Rich Region Performance | Uniform coverage [7] [11] | Significant bias and gaps [11] | Probe-dependent, cross-hybridization issues [3] | Good coverage [11] |
| 5hmC Detection | Yes [14] [15] | No (5mC and 5hmC conflated) | No | Yes [7] |
| Multiplexing Capacity | High | High | Very High | Medium |
Quantitative Performance Metrics
Empirical comparisons reveal distinct performance differences between methods across multiple metrics:
Coverage Uniformity and GC Bias: EM-seq libraries demonstrate significantly more even coverage distribution compared to WGBS, particularly in high-GC regions [11]. One study rarefied sequencing libraries to equal depths and found EM-seq maintained consistent coverage across GC percentages, while WGBS showed substantial dropout in GC-rich areas [11]. This translates to EM-seq detecting approximately 15% more CpG sites than WGBS at comparable sequencing depths [3].
Concordance with Established Methods: EM-seq shows high correlation with WGBS in methylation beta values (Pearson correlation coefficients ranging from 0.826 to 0.906) [7] [11], indicating strong reliability despite different conversion mechanisms. The methylation levels at specific genomic contexts (CG, CHG, CHH) show particularly high agreement between the two methods [7] [3].
Library Complexity and Mapping Efficiency: EM-seq libraries consistently outperform bisulfite-converted libraries in complexity metrics, displaying lower duplication rates, higher unique mapping rates, and better retention of original DNA fragment length distributions [14] [3]. This increased library complexity translates to more efficient sequencing and better data quality per gigabase sequenced.
Table 2: Empirical Performance Comparison Based on Experimental Data
| Performance Metric | EM-seq | WGBS | EPIC Array | ONT |
|---|---|---|---|---|
| CpG Sites Detected | ~28.7 million (human) [11] | ~28.2 million (human) [11] | 935,000 (targeted) [7] [11] | Varies with depth |
| Coverage in GC-Rich Regions | Uniform, minimal bias [7] [11] | Significant dropout [11] | Probe-dependent [3] | Good coverage [11] |
| Methylation Concordance (vs. WGBS) | R = 0.826-0.906 [11] | Reference | R > 0.9 [11] | Lower agreement [7] |
| Library Complexity | Higher, lower duplication [14] [3] | Lower, higher duplication [14] | Not applicable | Medium |
| Sensitivity in Low-Input Conditions | High (effective with 100 pg) [14] [3] | Limited below 50 ng [3] | Requires 500 ng [7] | Requires ~1 μg [7] |
The Scientist's Toolkit: Essential Reagents and Materials for EM-seq
Successful implementation of EM-seq requires specific enzymatic and molecular biology reagents. The following toolkit outlines essential components and their functions:
Table 3: Essential Research Reagent Solutions for EM-seq
| Reagent/Kit | Function | Application Notes |
|---|---|---|
| TET2 Enzyme | Oxidizes 5mC to 5caC through 5hmC and 5fC intermediates | Critical for protecting methylated cytosines from deamination; requires optimal reaction conditions [14] [15] |
| T4-BGT (T4 β-glucosyltransferase) | Glucosylates 5hmC to form 5gmC | Protects endogenous 5hmC from deamination; works concurrently with TET2 [14] |
| APOBEC3A Enzyme | Deaminates unmodified cytosines to uracils | Must be highly specific to avoid deaminating protected cytosine forms; reaction time requires optimization [14] |
| EM-seq Library Preparation Kits | Complete reagent sets for end-to-end workflow | Commercial kits available (e.g., from New England Biolabs); ensure compatibility with sequencing platform [14] |
| High-Fidelity PCR Mix | Amplification of converted libraries | Maintains sequence fidelity during library amplification; should be optimized for biased libraries [15] |
| DNA Cleanup Beads/Columns | Size selection and purification between steps | Magnetic beads preferred for minimal DNA loss; crucial for low-input applications [15] [17] |
| Quality Control Assays | Assess library quantity and quality | Fluorometric quantification (Qubit) and fragment analyzers; verify conversion efficiency [17] |
Experimental Protocols: From DNA to Data
Standard EM-seq Library Preparation Workflow
The typical EM-seq protocol involves the following key steps, which can be completed in 2-4 days [3]:
DNA Input and Quality Assessment: Begin with high-quality genomic DNA (or crude cell lysates for limited samples [17]). Assess purity via NanoDrop (260/280 and 260/230 ratios) and quantify using fluorometric methods (Qubit) [7]. While standard protocols recommend nanogram amounts, EM-seq has been successfully performed with as little as 100 pg of input DNA [14] [3].
Enzymatic Conversion:
- Prepare the oxidation master mix containing TET2 and oxidation enhancer in an appropriate reaction buffer.
- Incubate DNA with the oxidation mixture to convert 5mC to 5caC (typically at 37°C for 1 hour) [14].
- Simultaneously, T4-BGT glucosylates any 5hmC present in the sample.
- Heat-inactivate the enzymes to stop the reaction.
Deamination Reaction:
- Add APOBEC3A to the converted DNA and incubate at 37°C for 2-3 hours to deaminate unmodified cytosines to uracils [14].
- The reaction time may require optimization based on input DNA quality and quantity.
Library Construction and Amplification:
- Proceed with standard library preparation steps including end-repair, adapter ligation, and size selection [15].
- Amplify libraries using high-fidelity PCR with a low cycle number (typically 10-15 cycles) to minimize amplification bias.
- Purify the final library and quantify using appropriate methods.
Quality Control and Sequencing:
- Assess library quality using Bioanalyzer or TapeStation to verify appropriate fragment size distribution.
- Measure conversion efficiency using control sequences or spike-ins.
- Sequence on Illumina platforms with appropriate read length (typically 2×150 bp for whole-genome methylation) [15].
The complete workflow can be visualized as follows:
Data Analysis Pipeline
EM-seq data analysis shares similarities with WGBS analysis but requires attention to specific nuances:
Quality Control and Preprocessing: Use FastQC to assess read quality, followed by trimming of adapters and low-quality bases with tools like Trimmomatic [15] [16].
Alignment and Methylation Calling: Map reads to a reference genome using bisulfite-aware aligners such as Bismark or BS-Seeker2, which handle the C-to-T conversions in the sequencing reads [15] [16]. Following alignment, extract methylation calls for individual cytosines in all sequence contexts (CG, CHG, CHH).
Differential Methylation Analysis: Identify differentially methylated regions (DMRs) between sample groups using tools like MethylC-analyzer, which provides comprehensive downstream analysis including DMR detection, genomic feature annotation, and visualization [16].
Visualization and Interpretation: Explore methylation patterns genome-wide using browsers such as IGV (Integrative Genomics Viewer) [15]. Generate meta-plots to examine methylation patterns around specific genomic features like transcription start sites or CpG islands.
EM-seq represents a significant advancement in DNA methylation profiling, addressing critical limitations of bisulfite-based methods while maintaining high accuracy and single-base resolution. The enzymatic approach demonstrates particular strength in applications where DNA integrity and comprehensive genome coverage are paramount:
Clinical Epigenetics: EM-seq's ability to work with low-input and degraded DNA (e.g., from FFPE tissues, cell-free DNA) makes it ideal for biomarker discovery and clinical diagnostics [14] [17] [3].
Developmental Biology: The technique's sensitivity enables detailed analysis of methylation dynamics during embryonic development and cellular differentiation, where sample material is often limited [15].
Plant Epigenomics: With its ability to detect non-CG methylation (prevalent in plants) and provide uniform coverage across GC-rich regions, EM-seq offers distinct advantages for plant epigenetic studies [3] [16].
Single-Cell and Low-Input Applications: The minimal DNA requirements position EM-seq as a promising platform for single-cell methylome analysis, opening new avenues for understanding cellular heterogeneity [14] [3].
While EM-seq requires careful optimization of enzymatic reactions and involves higher costs than traditional WGBS, its advantages in data quality, coverage uniformity, and DNA preservation make it increasingly competitive for modern epigenomic studies. As the field continues to evolve, EM-seq is poised to become a leading methodology for comprehensive DNA methylation analysis across diverse biological and clinical contexts.
DNA methylation, a fundamental epigenetic mechanism regulating gene expression, requires precise measurement technologies for research and clinical applications. The performance of these methods directly impacts the biological insights we can derive. Whole-genome bisulfite sequencing (WGBS), Illumina MethylationEPIC (EPIC) BeadChip microarray, and enzymatic methyl sequencing (EM-seq) represent the most prominent platforms for genome-wide methylation analysis, each with distinct technical characteristics. Understanding their key performance metrics—resolution, genomic coverage, and bias—is essential for selecting the appropriate method for specific research goals, from large-scale epigenome-wide association studies to targeted biomarker discovery.
This guide provides an objective comparison of these three dominant methodologies, supported by experimental data quantifying their capabilities in detecting cytosine methylation across the human genome. By examining their technical performance through standardized metrics, researchers can make informed decisions that align with their specific experimental requirements, sample limitations, and analytical objectives.
The three major methylation profiling technologies operate on fundamentally different principles, which directly influence their performance characteristics. The table below summarizes their core methodologies and overall performance profile.
Table 1: Core Methodologies and Performance Profiles of Major Methylation Detection Platforms
| Technology | Core Principle | Best Application Context | Key Strength | Principal Limitation |
|---|---|---|---|---|
| WGBS | Chemical conversion via sodium bisulfite; unmethylated cytosines deaminate to uracils [18] | Gold standard for comprehensive discovery research; requires high-quality, sufficient DNA input [7] | Single-base resolution with nominally unbiased genome-wide coverage [18] | Substantial DNA degradation and fragmentation; GC-coverage bias [7] [14] |
| EPIC Array | BeadChip microarray with probes for ~930,000 predefined CpG sites following bisulfite conversion [18] [19] | High-throughput, cost-effective population-scale studies (EWAS) [20] [19] | Standardized workflow, low cost per sample, simple data analysis [20] [19] | Limited to predefined sites; cannot expand beyond probe-dictated regions [20] |
| EM-seq | Enzymatic conversion using TET2 and APOBEC3A; oxidizes and protects 5mC/5hmC, deaminates unmodified C to U [14] | Scenarios requiring maximal data quality from minimal or precious samples (e.g., cfDNA, low-input biopsies) [21] [3] | Superior library complexity and uniformity; minimal DNA damage; excellent GC-rich region coverage [7] [14] [21] | Longer, more complex library preparation protocol (2-4 days) [3] |
Quantitative Performance Comparison
Direct comparative studies reveal significant differences in the quantitative output and quality of data generated by each platform. The following table synthesizes key performance metrics from empirical evaluations.
Table 2: Quantitative Performance Metrics Across Methylation Profiling Technologies
| Performance Metric | WGBS | EPIC Array | EM-seq |
|---|---|---|---|
| Approximate CpG Sites Detected | ~28 million (theoretical, all genomic CpGs) [18] | ~860,000 - 930,000 (predesigned probes) [7] [19] | ~4 million (at 10X coverage in human samples) [20] [21] |
| Typical Sequencing Depth / Coverage | ~30X (recommended minimum) [22] | N/A (Microarray) | ~30X (recommended minimum) [21] |
| Recommended DNA Input | 1 μg (standard protocols) [21] [22] | 250 ng [21] | As low as 10 ng (standard), 100 pg (demonstrated) [14] [21] |
| CpG Detection Concordance | Gold standard reference | High correlation with WGBS (r=0.98 reported) [20] | Highest concordance with WGBS among alternatives [7] |
| DNA Degradation & Fragmentation | Severe (due to harsh bisulfite conditions) [7] [14] | Moderate (also uses bisulfite conversion) [7] | Minimal (gentle enzymatic treatment preserves integrity) [14] [21] |
| GC Coverage Uniformity | Poor (underrepresents GC-rich regions) [3] | Moderate (probe-specific issues in GC-rich regions) [3] | Excellent (even coverage distribution) [21] |
| Unique Regional Access | Standard genome coverage | Enhanced regulatory element targeting (58% of FANTOM5 enhancers) [18] | Superior coverage in challenging repetitive and GC-rich regions [7] |
Detailed Analysis of Key Performance Metrics
Resolution and Genomic Coverage
Resolution refers to the granularity at which a technology can detect methylation status, while genomic coverage indicates the proportion of the genome's CpG sites it can assess.
Single-Base Resolution Methods: Both WGBS and EM-seq provide true single-base resolution, meaning they can determine the methylation status of individual cytosine bases throughout the genome without being constrained by predefined positions [18] [21]. This enables the discovery of novel methylation sites and patterns outside previously annotated regions.
Targeted Coverage: The EPIC array employs a fixed-design approach,interrogating approximately 930,000 predefined CpG sites located primarily in promoter regions, gene bodies, and enhancer elements identified through projects like FANTOM5 and ENCODE [18] [19]. While this covers many biologically relevant regions, it cannot detect methylation at sites not included in the probe design.
Coverage Density: In practical applications, EM-seq demonstrates a significant advantage in coverage density. In a direct comparative study, EM-seq detected approximately 2.74 million CpGs with at least 10X coverage in breast tissue samples, compared to approximately 752,000 CpGs detected by the EPIC array in the same samples [20]. WGBS theoretically covers all ~28 million CpGs in the human genome but often achieves practical coverage of approximately 80% of CpG sites due to sequencing depth limitations and mapping challenges [7] [18].
Technical Biases and Artifacts
Each technology introduces specific technical biases that can affect data interpretation and biological conclusions.
Bisulfite-Induced Bias (WGBS and EPIC Array): The fundamental limitation of bisulfite-based methods is DNA degradation. Bisulfite treatment requires extreme temperatures and pH conditions, causing depyrimidination, substantial DNA fragmentation, and single-strand breaks [7] [14]. This process disproportionately damages unmethylated cytosines compared to methylated ones, resulting in libraries with reduced mapping rates and skewed GC content representation [14]. Specifically, bisulfite-converted DNA underrepresents G- and C-containing dinucleotides while overrepresenting AA-, AT-, and TA-containing dinucleotides compared to a non-converted genome [14].
Enzymatic Conversion Advantages (EM-seq): The enzymatic approach of EM-seq eliminates bisulfite-induced damage through a milder biochemical process. TET2 oxidizes 5-methylcytosine (5mC) and 5-hydroxymethylcytosine (5hmC) to 5-carboxylcytosine (5caC), while T4-BGT glucosylates 5hmC, protecting both modifications from subsequent deamination by APOBEC3A, which converts unmodified cytosines to uracils [14]. This preserves DNA integrity, resulting in longer library fragments (300-500bp versus 100-200bp for WGBS), higher complexity, and more uniform GC coverage [21] [3].
Platform-Specific Biases: The EPIC array suffers from limitations inherent to hybridization technology, including potential errors from probe cross-hybridization, particularly in GC-rich regions [20] [3]. Additionally, its two different probe designs (Infinium I and II) have different dynamic ranges, requiring specialized normalization methods [18]. A 2025 study using Quartet reference materials also identified strand-specific methylation biases across all major protocols, including WGBS, EM-seq, and TAPS (TET-assisted pyridine borane sequencing) [23].
Reproducibility and Accuracy
Cross-Platform Concordance: Studies consistently show high quantitative agreement between platforms for overlapping CpG sites. One investigation found a Pearson correlation of r=0.98 between the EPIC array and TruSeq EPIC (a targeted bisulfite sequencing method) for common CpG sites [20]. Similarly, EM-seq shows the highest concordance with WGBS despite their different conversion methods, indicating strong reliability [7].
Inter-Laboratory Reproducibility: A 2025 multi-laboratory assessment using Quartet DNA reference materials revealed high quantitative agreement (mean Pearson correlation coefficient = 0.96) across technical replicates, but notably low detection concordance (mean Jaccard index = 0.36), highlighting that while methylation levels are consistently measured, the specific CpG sites detected can vary substantially between technical replicates [23].
Dynamic Range and Sensitivity: Sequencing-based methods (WGBS and EM-seq) provide a wider dynamic range for detecting methylation differences compared to microarray technology. The EPIC array suffers from compression at extreme methylation values (β close to 0 or 1), while sequencing methods more accurately quantify both hypo- and hyper-methylated sites [20]. EM-seq particularly excels in detecting methylation in low-complexity and GC-rich regions where other methods underperform [3].
Experimental Protocols and Methodologies
The experimental workflows for each technology incorporate both shared and distinct steps that directly influence their performance characteristics.
Core Workflows
Key Experimental Considerations
Bisulfite Conversion Efficiency: For WGBS and EPIC array protocols, conversion efficiency must be rigorously monitored. Incomplete conversion of unmethylated cytosines to uracils leads to false-positive methylation calls [7]. Efficiency is typically verified using spike-in controls like unmethylated lambda phage DNA, with expected conversion rates ≥99.5% [21].
Enzymatic Reaction Optimization: EM-seq requires precise optimization of enzyme ratios and reaction times. The TET2 enzyme must efficiently oxidize ≥99% of 5mCs, while APOBEC3A must fully deaminate unmodified cytosines without affecting oxidized derivatives [14]. Commercial EM-seq kits typically achieve conversion efficiencies of 99.5-99.8% [21].
Library Complexity Preservation: EM-seq libraries maintain significantly higher complexity than WGBS libraries, with duplication rates approximately 30% lower in low-input scenarios (10ng DNA), making EM-seq particularly advantageous for limited samples [3].
Quality Control Metrics: Cross-platform evaluations using reference materials like the Quartet DNA samples recommend monitoring strand consistency, with mean absolute deviation between complementary strands typically below 20% for high-quality data [23].
Essential Research Reagents and Materials
Successful methylation profiling requires specific reagents and materials tailored to each technology's requirements.
Table 3: Essential Research Reagents and Materials for DNA Methylation Analysis
| Reagent/Material | Function | Technology Application | Key Considerations |
|---|---|---|---|
| Sodium Bisulfite | Chemical deamination of unmethylated cytosines to uracils | WGBS, EPIC Array | Purity and freshness critical for conversion efficiency; causes DNA fragmentation [7] [18] |
| TET2 Enzyme | Oxidation of 5mC to 5caC through 5hmC and 5fC intermediates | EM-seq | Requires Fe(II)/α-ketoglutarate cofactors; oxidation efficiency ≥99% [14] |
| APOBEC3A Enzyme | Deamination of unmodified cytosines to uracils | EM-seq | Specificity for unmodified C; minimal activity on 5caC/5gmC [14] |
| T4-BGT (T4 β-glucosyltransferase) | Glucosylation of 5hmC to 5gmC | EM-seq | Protects 5hmC from oxidation and deamination [14] |
| DNA Preservation Reagents | Maintain DNA integrity during storage/extraction | All methods | Critical for minimizing pre-analytical degradation, especially for bisulfite-based methods |
| Methylation-Free Control DNA | Conversion efficiency monitoring | All methods | Unmethylated lambda phage DNA; expected methylation ~0.2% [21] |
| Highly Methylated Control DNA | Conversion specificity verification | All methods | CpG-methylated pUC19 DNA; expected methylation 95-98% [21] |
| Library Preparation Kits | Platform-specific library construction | WGBS, EM-seq | Optimized for converted DNA; EM-seq kits specifically designed for enzymatic conversion [21] |
| Quartet Reference Materials | Cross-platform benchmarking and QC | All methods | Certified reference DNA from family quartet enables standardized performance assessment [23] |
The optimal choice among WGBS, EPIC array, and EM-seq depends primarily on research objectives, sample characteristics, and analytical requirements.
Select WGBS when conducting discovery-phase research requiring the most established comprehensive methylation mapping and when sample quantity and quality are sufficient to withstand bisulfite degradation [7] [18].
Choose the EPIC Array for large-scale epigenome-wide association studies (EWAS) where cost-effectiveness, high throughput, and standardized analysis pipelines are prioritized over comprehensive genome coverage [20] [19].
Utilize EM-seq for scenarios demanding the highest data quality from limited or precious samples, when analyzing GC-rich genomic regions, or when seeking to minimize technical biases introduced by bisulfite conversion [7] [14] [21].
As methylation profiling technologies continue evolving, methods like EM-seq and third-generation sequencing platforms show increasing promise for overcoming the limitations of established approaches. Regardless of the selected platform, rigorous quality control using standardized reference materials and consistent analytical pipelines remains essential for generating reliable, reproducible methylation data that advances our understanding of epigenetic regulation in health and disease.
Strategic Method Selection: Matching WGBS, EPIC, and EM-seq to Your Research Goals
DNA methylation, a fundamental epigenetic mechanism involving the addition of a methyl group to cytosine bases, plays a critical role in gene expression regulation, cellular differentiation, embryonic development, and disease pathogenesis [8] [7]. The advancement of technologies for genome-wide methylation profiling has revolutionized our understanding of epigenetics in human health and disease. Two distinct phases typically characterize the methylation research pipeline: an initial unbiased discovery phase for comprehensive mapping of methylation patterns across the genome, followed by a targeted validation phase for confirming findings in larger cohorts. Whole-genome bisulfite sequencing (WGBS) has long been the gold standard for discovery, but enzymatic methyl-sequencing (EM-seq) is emerging as a powerful alternative [8] [7]. For validation studies, the EPIC DNA methylation microarray offers a cost-effective, high-throughput solution [24] [25]. This guide objectively compares the performance of these technologies, providing experimental data and protocols to help researchers select the optimal methodology for their specific research goals.
Technology Comparison: Principles, Advantages, and Limitations
Whole-Genome Bisulfite Sequencing (WGBS)
Principle: WGBS relies on sodium bisulfite treatment of genomic DNA, which converts unmethylated cytosines to uracils while leaving methylated cytosines unchanged. Subsequent PCR amplification and high-throughput sequencing then reveal the methylation status at single-base resolution [8] [26].
Key Applications: WGBS is widely used for comprehensive methylation analysis in cell differentiation, tissue development, animal and plant breeding, and human disease research [8].
Enzymatic Methyl-Sequencing (EM-seq)
Principle: EM-seq utilizes a series of enzymatic reactions instead of chemical conversion. The process involves:
- Oxidation: The TET2 enzyme oxidizes 5-methylcytosine (5mC) and 5-hydroxymethylcytosine (5hmC) to derivatives (5caC, 5fC).
- Protection and Deamination: Any 5hmC is protected by glucosylation (T4-BGT). The APOBEC enzyme then deaminates unmethylated cytosines to uracils, while all modified cytosines (5mC, 5hmC, 5caC, 5fC) are protected from deamination [8] [7] [26].
This process allows methylated bases to be read as cytosines and unmethylated bases as thymines in subsequent sequencing [26].
Key Applications: EM-seq is suitable for tissues, cells, and body fluids, and is particularly advantageous for micro-fragile DNA samples like circulating tumor DNA (ctDNA), with input requirements as low as 10 ng [8].
EPIC DNA Methylation Microarray
Principle: The EPIC array uses probe hybridization to target a predefined set of CpG sites. After bisulfite conversion of DNA, probes complementary to the converted sequences are hybridized. Single-base extension with fluorescently labeled nucleotides allows methylation quantification at specific loci, reported as beta-values ranging from 0 (unmethylated) to 1 (fully methylated) [24] [25].
Key Applications: The EPIC array is designed for large-scale epigenome-wide association studies (EWAS) and clinical validation, with the latest version (EPICv2) covering over 935,000 CpG sites, including enhanced coverage of enhancers and other regulatory regions [27] [24] [25].
Comparative Analysis of Technical Specifications
Table 1: Technical comparison of WGBS, EM-seq, and EPIC microarray
| Feature | WGBS | EM-seq | EPIC Microarray |
|---|---|---|---|
| Principle | Bisulfite conversion [8] | Enzymatic conversion [8] | Probe hybridization [24] |
| Resolution | Single-base [8] | Single-base [8] | Single-CpG (but targeted) [24] |
| Genome Coverage | ~28 million CpGs (near-complete) [24] | Comparable to WGBS [7] | ~935,000 CpGs (targeted) [24] [25] |
| DNA Input | High (μg level) [8] | Low (10 ng) [8] | Medium (150-500 ng) [27] [7] |
| DNA Damage | Severe (fragmentation & degradation) [8] | Minimal (gentle enzymatic treatment) [8] | Moderate (still requires bisulfite conversion) [25] |
| Key Advantage | Mature gold standard, comprehensive data [8] | Superior DNA preservation, uniform coverage [8] [3] | Cost-effective, high-throughput, simple analysis [24] |
| Primary Limitation | High DNA input, GC bias, amplification bias [8] | Higher cost, complex data analysis [8] | Limited to pre-designed probes, cannot discover novel sites [27] |
| Best Suited For | Unbiased discovery, novel methylation site identification [8] | Discovery with precious/low-input samples, GC-rich regions [8] [3] | Targeted validation, large cohort screening, clinical testing [24] [28] |
Experimental Data and Performance Benchmarks
Data Quality and Concordance
Studies directly comparing these technologies demonstrate strong correlation in methylation measurements where they overlap, while also highlighting critical differences in data quality and coverage.
EM-seq vs. WGBS: A 2020 study on Arabidopsis thaliana showed that EM-seq and WGBS methylation levels are highly correlated (R²=0.89 for CG and CHG sites) [3]. EM-seq demonstrated higher sensitivity in low-input conditions (10 ng), detecting 32% more methylation sites on average than WGBS and exhibiting better technical reproducibility as DNA input decreased [3]. EM-seq also provides more uniform coverage, particularly in GC-rich regions, and generates longer DNA fragment lengths (300-500 bp) after treatment compared to the severe fragmentation seen with bisulfite conversion (100-200 bp) in WGBS [8] [3].
EPIC vs. Sequencing Methods: A cross-platform evaluation in human samples found that EM-seq showed the highest concordance with WGBS, confirming the reliability of its sequencing chemistry [7]. When comparing EPIC with methylation capture sequencing (MC-seq, a targeted sequencing method), among the 472,540 CpG sites captured by both platforms, the majority were highly correlated (r: 0.98–0.99) in the same sample [27]. However, a small proportion of CpGs (N = 235) showed significant differences in beta values (>0.5), indicating that caution is needed when interpreting results for specific loci [27].
Practical Performance Metrics
Table 2: Performance benchmarking across DNA methylation platforms
| Performance Metric | WGBS | EM-seq | EPIC Microarray |
|---|---|---|---|
| CpG Sites Detected (per sample) | ~28 million [24] | Comparable to WGBS [7] | ~846,464 (EPICv1) [27] to >935,000 (EPICv2) [24] |
| Reproducibility (Correlation Coefficient) | High but input-dependent [3] | High (ICC >0.85 even with low input) [3] | Very High (r >0.96) [27] [25] |
| Cost per Sample | High [24] | High [8] | Low [24] |
| Handling of GC-rich Regions | Poor (GC bias) [8] | Excellent (uniform coverage) [8] [3] | Limited (probe cross-hybridization issues) [25] [3] |
| Distinction of 5mC/5hmC | No [26] | No [26] | No |
Experimental Protocols and Workflows
Detailed Methodologies for Key Experiments
4.1.1 EM-seq Library Construction Protocol [8] [26] [17]
The EM-seq library preparation involves a multi-step enzymatic process:
- DNA Input and Fragmentation: Start with as little as 10 ng of purified genomic DNA. Fragment DNA to a desired size (e.g., 150-200 bp) using focused acoustic shearing.
- End Repair and Adapter Ligation: Repair fragmented DNA ends using T4 DNA Polymerase and Polynucleotide Kinase. Add an "A" base to the 3' ends using Klenow fragment. Ligate methylated sequencing adapters using T4 DNA ligase.
- Enzymatic Conversion: This core step avoids harsh bisulfite chemistry:
- Oxidation: Use the TET2 enzyme and an oxidation enhancer to oxidize 5mC and 5hmC to 5caC and 5fC, protecting them from subsequent deamination.
- Deamination: Use the APOBEC/AID enzyme family to deaminate unmethylated cytosines to uracils. The oxidized, modified cytosines remain unchanged.
- Purification and PCR Amplification: Purify the reaction mixture to remove enzymes. Perform PCR amplification to create the final sequencing library.
- Quality Control and Sequencing: Assess library quality and quantity using qPCR and fragment analysis. Sequence on a high-throughput platform (e.g., Illumina NovaSeq) with 100-150 bp paired-end reads.
4.1.2 EPIC Microarray Hybridization Protocol [27] [7] [24]
The standard workflow for the EPIC array is robust and well-established:
- DNA Input and Bisulfite Conversion: Use 500 ng of genomic DNA. Perform bisulfite conversion using a kit (e.g., EZ DNA Methylation-Gold Kit, Zymo Research). This critical step converts unmethylated cytosines to uracils.
- Whole Genome Amplification: Amplify the bisulfite-converted DNA.
- Fragmentation, Precipitation, and Resuspension: Fragment the amplified product to a size optimal for hybridization. Precipitate the DNA to concentrate it, then resuspend in an appropriate hybridization buffer.
- Microarray Hybridization: Dispense the resuspended sample onto the EPIC BeadChip. Incubate the array to allow the bisulfite-converted DNA to hybridize to the locus-specific probes on the chip.
- Single-Base Extension and Staining: After hybridization, perform a single-base extension using DNA polymerase. The incorporated nucleotides are labeled with fluorescent dyes.
- Imaging and Data Extraction: Scan the BeadChip using an imaging system (e.g., iScan or iScan System, Illumina). Extract the fluorescence intensity data for each probe, which is used to calculate the beta-value representing the methylation level.
Workflow Visualization
Diagram 1: Comparative workflows for WGBS, EM-seq, and EPIC microarray, highlighting their alignment with discovery and validation phases.
The Scientist's Toolkit: Essential Reagents and Materials
Table 3: Key research reagent solutions for DNA methylation analysis
| Reagent / Kit | Function | Application Notes |
|---|---|---|
| NEBNext EM-seq Kit | Provides all necessary enzymes (TET2, APOBEC) and reagents for enzymatic conversion and library preparation. [26] | Essential for EM-seq workflow. Designed for low DNA input (from 10 ng) and minimizes DNA damage. [8] [26] |
| SureSelectXT Methyl-Seq | Target enrichment system for methylation capture sequencing. [27] | Used in MC-seq studies for focused analysis; allows higher multiplexing and lower cost than whole-genome methods. [27] |
| Infinium HD Assay Kit | Reagents for DNA bisulfite conversion, amplification, fragmentation, and microarray hybridization. [24] | Standard for Illumina methylation arrays (EPIC). Optimized for 500 ng input DNA. [7] [24] |
| EZ DNA Methylation-Gold Kit | Rapid bisulfite conversion of unmethylated cytosines. [27] | Widely used for both WGBS and EPIC array protocols. Critical step that requires high conversion efficiency. [27] [7] |
| KAPA Library Quantification Kit | Accurate quantification of sequencing libraries via qPCR. [27] | Crucial for pooling libraries at correct concentrations for efficient sequencing on Illumina platforms. [27] |
| Agilent Bioanalyzer / TapeStation | Microfluidic analysis of DNA and library fragment size distribution and quality. [27] | Used to assess DNA integrity post-extraction and final library quality before sequencing or hybridization. [27] |
Integrated Analysis Strategy: From Discovery to Validation
A robust methylation study often leverages the strengths of multiple technologies in a phased approach. The following framework outlines a strategic pipeline from initial discovery to final validation:
Diagram 2: A recommended integrated strategy for methylation analysis, combining discovery and validation platforms.
The choice between WGBS, EM-seq, and EPIC microarray is not a matter of identifying a single superior technology, but rather of selecting the right tool for the specific research question and stage of investigation. WGBS remains a mature and comprehensive discovery tool, while EM-seq emerges as a powerful next-generation discovery platform that excels in applications involving precious, low-input, or degraded samples due to its gentle enzymatic treatment and superior data uniformity [8] [3]. For large-scale validation and screening, the EPIC microarray is unparalleled in its cost-effectiveness and throughput, making it ideal for EWAS and clinical assay development [24] [25] [28].
As the field advances, an integrated strategy that utilizes EM-seq for initial unbiased discovery in a small sample set, followed by targeted validation of identified loci using the EPIC microarray in large cohorts, represents a powerful and efficient pipeline for translating epigenetic discoveries into meaningful biological insights and clinical applications.
DNA methylation analysis is crucial for understanding gene regulation, development, and disease mechanisms. However, researchers face significant challenges when working with limited or damaged samples such as cell-free DNA (cfDNA) and formalin-fixed paraffin-embedded (FFPE) tissues. These sample types are invaluable for clinical and translational research but are often incompatible with traditional methylation analysis methods due to DNA degradation and low yield. This guide objectively compares the performance of Enzymatic Methyl Sequencing (EM-seq) with established methods—Whole Genome Bisulfite Sequencing (WGBS), EPIC microarrays, and Oxford Nanopore Technologies (ONT)—specifically for challenging samples, providing experimental data to inform method selection for your research.
Technical Comparison of DNA Methylation Profiling Methods
The following table summarizes the fundamental characteristics of the four main technologies for genome-wide DNA methylation analysis.
| Method | Core Principle | Optimal Input Requirements | Key Technical Advantages | Key Technical Limitations |
|---|---|---|---|---|
| EM-seq | Enzymatic conversion of unmodified cytosines using TET2 and APOBEC enzymes [3] [14] | As low as 100 pg (0.1 ng) to 10 ng [3] [14] | Minimal DNA damage; even coverage of GC-rich regions; low duplication rates [3] [11] [29] | Longer protocol (2-4 days); higher reagent cost; potential for incomplete conversion in low-input samples [3] [4] |
| WGBS | Chemical conversion of unmodified cytosines using sodium bisulfite [3] [7] | 100 ng or more for standard protocols [3] | Considered the gold standard; mature technology and data analysis pipelines [3] [7] | Severe DNA degradation/fragmentation; high GC bias; overestimation of methylation levels [3] [7] [11] |
| EPIC Array | Hybridization of bisulfite-converted DNA to microarray probes [3] [7] | 500 ng for reliable results [7] | Low cost per sample; standardized workflow and data analysis; suitable for large cohort studies [3] [7] [30] | Limited to ~935,000 pre-defined CpG sites; cannot detect novel sites; probe cross-hybridization in GC-rich regions [3] [7] |
| ONT | Direct detection of modified bases via changes in electrical current [3] [7] | ~1 μg for a standard library [7] | No conversion-induced bias or damage; long reads for phasing methylation events; detects complex genomic regions [3] [7] [11] | High DNA input requirement; lower single-base accuracy; complex data analysis; high cost [3] [7] |
Performance Benchmarking with Low-Input and Degraded DNA
Independent studies have systematically evaluated these methods to provide quantitative performance data, particularly for low-input and challenging samples.
Quantitative Performance Metrics
The table below consolidates key experimental findings from comparative studies, highlighting performance across critical metrics.
| Performance Metric | EM-seq | WGBS | EPIC Array | ONT | Experimental Context & Citation |
|---|---|---|---|---|---|
| Library Complexity (Duplication Rate) | Low (~10%) at 1-10 ng input [3] | High (>25%) at <50 ng input [3] | Not Applicable | Varies | Human genomic DNA (NA12878) at low inputs (1-10 ng) [3] |
| CpG Sites Detected | 32% more than WGBS at 10 ng input in A. thaliana [3] | Baseline | ~935,000 (pre-defined) [7] | ~28 million (theoretical, coverage-dependent) [11] | Arabidopsis thaliana with 10 ng DNA input [3] |
| Coverage Uniformity (GC Bias) | Uniform coverage, even in high-GC regions [11] [29] | Strong AT over-representation, GC under-representation [11] [29] | Probe performance drops in GC-rich regions [3] | Minimal GC bias [7] [11] | Human whole blood samples; analysis of GC content distribution [11] [29] |
| Correlation with WGBS (CpG sites) | Pearson R ≈ 0.89 [3] [7] | Baseline (R=1) | High correlation (R >0.98) at overlapping sites [30] | Lower agreement than EM-seq [7] | Human tissue, cell line, and blood samples [7] |
| Background Cytosine Conversion Error | Can exceed 1% at very low inputs (<10 pg) [4] | Typically <0.5% [4] | Not Applicable | Not Applicable | Controlled study using unmethylated lambda DNA [4] |
| Performance with FFPE/cfDNA | Effective for cfDNA and FFPE; preserves fragment size profile [4] [14] | Severe fragmentation; not recommended for intact cfDNA analysis [4] | Requires high-quality, high-input DNA; challenging for fragmented samples [31] | Suitable for long fragments; may struggle with short, degraded DNA [31] | Libraries from cfDNA and FFPE-derived DNA [4] [14] |
Case Study: EM-seq vs. PBAT for Low-Input DNA
A 2022 study in Epigenetics directly compared EM-seq and Post-Bisulfite Adapter Tagging (PBAT, a WGBS variant for low inputs) using 10 ng DNA [3]. EM-seq demonstrated a 25% higher library conversion rate and 30% higher data complexity, effectively producing more usable data from the same starting material [3]. While PBAT showed a slightly higher correlation with standard WGBS at CG sites (R=0.92 vs. R=0.89 for EM-seq), EM-seq was significantly more sensitive at detecting methylation at CHG and CHH sites, identifying 18% more rare methylation sites missed by PBAT [3].
Detailed Experimental Protocols
To ensure reproducibility, below are the core methodologies for the key experiments cited in this guide.
Protocol 1: EM-seq Library Construction for Low-Input Samples
This protocol is adapted from the NEBNext Enzymatic Methyl-seq method and related research papers [3] [29] [14].
- DNA Input and Shearing: Use 100 pg to 10 ng of fragmented genomic DNA, cfDNA, or FFPE DNA. If necessary, shear high-quality DNA to 300 bp using focused acoustics (e.g., Covaris).
- Enzymatic Conversion:
- Step 1 (Oxidation): Incubate DNA with the TET2 enzyme and an oxidation enhancer. TET2 oxidizes 5-methylcytosine (5mC) and 5-hydroxymethylcytosine (5hmC) through 5hmC and 5fC to 5-carboxylcytosine (5caC).
- Step 2 (Glucosylation): The enhancer also contains T4-BGT, which glucosylates 5hmC to 5gmC, protecting it.
- Step 3 (Deamination): Add APOBEC3A, which deaminates unmodified cytosines to uracils. The oxidized (5caC) and glucosylated (5gmC) derivatives are protected from deamination.
- Library Preparation: Use the accompanying NEBNext Ultra II reagents to prepare sequencing libraries. This involves end-repair, dA-tailing, and adapter ligation. The adapters are ligated after the enzymatic conversion.
- Library Amplification: Amplify the final library using a high-fidelity PCR master mix for a minimal number of cycles (e.g., 8-12 cycles).
- Sequencing: Sequence on an Illumina platform using standard paired-end protocols.
Protocol 2: Comparative Performance Evaluation
This outlines the general methodology used in head-to-head method comparisons [7] [11] [4].
- Sample Selection: Obtain DNA from multiple sources (e.g., cell line (MCF-7), whole blood, and FFPE or cfDNA samples) to assess method robustness.
- DNA QC: Quantify DNA using fluorometry (e.g., Qubit) and assess purity/fragmentation (e.g., Bioanalyzer, TapeStation).
- Parallel Library Prep: For each sample type, prepare libraries using all methods being compared (EM-seq, WGBS, EPIC, ONT) from the same DNA aliquot. Use a range of input amounts (e.g., 1 ng, 10 ng, 100 ng) where feasible.
- Sequencing and Data Processing: Sequence libraries to an appropriate depth. For sequencing-based methods, rarefy raw reads to the same number for fair comparison [11]. Map reads to the reference genome using appropriate aligners (e.g.,
bwa-methfor WGBS/EM-seq,minimap2for ONT). Call methylation and calculate beta values. - Data Analysis:
- Coverage: Calculate the number and percentage of CpGs covered at various depths (e.g., 1x, 10x, 30x).
- Bias: Analyze the distribution of coverage across different genomic GC contents.
- Accuracy/Concordance: Calculate Pearson correlation coefficients of beta values at overlapping CpG sites between methods.
- Sensitivity: Compare the number of CpG sites detected at a defined coverage threshold.
Visualizing the EM-seq Workflow and Performance
The following diagram illustrates the core enzymatic conversion process of EM-seq, which avoids the DNA damage associated with bisulfite treatment.
EM-seq Enzymatic Conversion Pathway
The next diagram summarizes the key performance advantages of EM-seq relative to WGBS, based on experimental data from the cited studies.
EM-seq Performance Advantages for Challenging Samples
The Scientist's Toolkit: Essential Reagent Solutions
Successful methylation profiling of challenging samples requires carefully selected reagents and kits. The table below lists key solutions for implementing EM-seq and other profiled methods.
| Product Name | Manufacturer | Primary Function | Key Application Notes |
|---|---|---|---|
| NEBNext Enzymatic Methyl-seq Kit | New England Biolabs | All-in-one solution for EM-seq library prep and enzymatic conversion [29]. | Optimized for low-input DNA (from 100 pg); includes oxidation, glucosylation, and deamination enzymes; compatible with Illumina sequencers [29] [14]. |
| NEBNext Ultra II DNA Library Prep Kit | New England Biolabs | Library construction module used in conjunction with the EM-seq conversion module [29]. | Used for steps after enzymatic conversion: end-prep, adapter ligation, and library amplification; known for high efficiency. |
| Illumina DNA Prep with Enrichment Kit | Illumina | Library preparation for standard or bisulfite-converted DNA [31]. | Can be adapted for FFPE DNA (50-1000 ng) by increasing PCR cycles; requires prior bisulfite conversion for methylation analysis [31]. |
| KAPA DNA HyperPrep Kit | Roche | Library construction for degraded and low-input DNA [31]. | Efficient, single-tube chemistry; suitable for FFPE and low-input samples (from 1 ng); available in PCR and PCR-free versions. |
| IDT xGen cfDNA & FFPE DNA Library Prep Kit | Integrated DNA Technologies | Specialized library prep for challenging cfDNA and FFPE samples [31]. | Designed for low-input (1-250 ng) and mechanically sheared DNA; includes features to inhibit adapter-dimer formation. |
| EZ DNA Methylation-Gold Kit | Zymo Research | Chemical bisulfite conversion for WGBS and EPIC array [7] [4]. | A standard for bisulfite conversion; used in many comparative studies as a benchmark for WGBS [4]. |
The choice of methylation profiling method for low-input and degraded DNA involves careful trade-offs. WGBS remains a gold standard but is often unsuitable for precious, limited samples due to its destructive nature. The EPIC array is cost-effective for large cohorts but lacks genome-wide scope and performs poorly with fragmented DNA. ONT sequencing offers long reads and no conversion bias but demands high DNA input.
For researchers prioritizing data quality and comprehensiveness from challenging samples like cfDNA and FFPE, EM-seq emerges as a superior alternative. Experimental evidence confirms its advantages: minimal DNA damage, higher library complexity from low inputs, and unbiased coverage of GC-rich regions such as CpG islands. While its protocol is longer and costs are higher than WGBS, the significant gains in data quality and the ability to profile previously inaccessible samples make EM-seq a powerful tool for advancing epigenetics research and clinical biomarker discovery.
DNA methylation, the covalent addition of a methyl group to the fifth carbon of a cytosine base (5-methylcytosine, 5mC), is a fundamental epigenetic mechanism regulating gene expression, genomic imprinting, stem cell differentiation, and embryonic development [7] [32] [24]. Aberrant DNA methylation patterns are implicated in various human diseases, including cancer, neurological disorders, and autoimmune conditions, making accurate methylation profiling crucial for both basic research and clinical applications [7] [24]. The selection of an appropriate methylation profiling method requires careful consideration of multiple factors, including cost, throughput, data comprehensiveness, and sample quality. Researchers must navigate a complex landscape of available technologies, each with distinct advantages and limitations.
This guide provides a comprehensive cost-benefit analysis of three prominent DNA methylation profiling techniques: Whole-Genome Bisulfite Sequencing (WGBS), Illumina MethylationEPIC BeadChip microarrays (EPIC array), and Enzymatic Methyl-Sequencing (EM-seq). We objectively compare their performance using published experimental data, detail standardized methodologies for reproducible results, and provide visualizations of key workflows to assist researchers in selecting the most appropriate technology for their specific research context and constraints.
Technical Comparison of Profiling Methods
Whole-Genome Bisulfite Sequencing (WGBS) has long been considered the gold standard for DNA methylation analysis, providing single-base resolution and nearly comprehensive genome-wide coverage of CpG sites [7] [32]. The method relies on sodium bisulfite conversion, which selectively deaminates unmethylated cytosines to uracils, while methylated cytosines remain unchanged [32]. The converted DNA is then sequenced, and methylation status is determined by comparing C-to-T conversion rates [33]. WGBS covers approximately 80% of all CpG sites in the human genome, enabling detection of methylation patterns beyond CpG contexts, including CHG and CHH methylation (where H is A, T, or C) [32] [34].
Illumina MethylationEPIC BeadChip (EPIC array) represents a microarray-based approach that provides a cost-effective solution for large-scale epigenetic studies [24] [10]. The technology uses probe hybridization to bisulfite-converted DNA, with two different chemical assays (Infinium I and II) detecting methylation status at specific predefined CpG sites [10]. The latest EPIC version 2 array covers over 935,000 CpG sites, with enhanced coverage of enhancer regions, open chromatin, and regulatory elements identified by ENCODE and FANTOM5 projects [24] [10]. This method sacrifices comprehensive genome coverage for substantially lower cost and simpler data analysis, making it suitable for population-scale studies [24].
Enzymatic Methyl-Sequencing (EM-seq) is an emerging enzymatic conversion method that addresses several limitations of bisulfite-based approaches [7] [34] [35]. Instead of chemical conversion, EM-seq uses a series of enzymes including TET2 and T4-BGT to convert methylated cytosines to 5-carboxylcytosine (5caC) while protecting 5-hydroxymethylcytosine (5hmC), followed by APOBEC-mediated deamination of unmodified cytosines to uracils [7] [34]. This enzymatic approach achieves the same base-resolution methylation data as WGBS while minimizing DNA damage and preserving DNA integrity [34] [35].
Comprehensive Performance Metrics Comparison
Table 1: Technical Specifications and Performance Metrics of DNA Methylation Profiling Methods
| Parameter | WGBS | EPIC Array | EM-seq |
|---|---|---|---|
| Genomic Coverage | ~80% of all CpGs (≈28 million sites) [24] | 935,000 predefined CpG sites [24] [10] | Comparable to WGBS [7] |
| Resolution | Single-base [32] | Single-CpG (predefined) [10] | Single-base [7] |
| DNA Input Requirements | High (≥100ng) [32] | Low (≥1ng for EPICv2) [10] | Low (1-10ng demonstrated) [35] |
| DNA Degradation | Substantial (up to 90% loss) [34] | Moderate (bisulfite conversion required) [7] | Minimal (enzymatic preservation) [34] [35] |
| CpG Detection Context | CG, CHG, CHH [34] | Primarily CG [24] | CG, CHG, CHH [7] [34] |
| Mapping Rate | Variable (70-83%) [32] | Not applicable | Higher than WGBS [7] [35] |
| Duplicate Rate | Variable, often high [32] [35] | Low | Lower than WGBS [34] [35] |
| Library Complexity | Moderate to low [35] | High | Higher than WGBS [35] |
| GC Bias | Significant AT bias [34] | Moderate | Minimal [7] [34] |
Table 2: Cost and Practical Considerations for DNA Methylation Profiling Methods
| Consideration | WGBS | EPIC Array | EM-seq |
|---|---|---|---|
| Cost per Sample | High [24] | Low to moderate [24] [10] | Moderate (decreasing) [36] |
| Throughput | Low to moderate | Very high [24] | Moderate to high |
| Multiplexing Capacity | Moderate | High | High [36] |
| Hands-on Time | High | Low | Moderate |
| Data Analysis Complexity | High [32] [33] | Low [24] | High (similar to WGBS) [7] |
| Sequencing Depth Required | 20-30x coverage | Not applicable | Potentially lower than WGBS [7] |
| Suitability for Population Studies | Low (cost-prohibitive) [24] | High [24] [10] | Increasing [36] |
| Technical Expertise Required | High | Moderate | High |
Experimental Data and Performance Validation
Method Agreement and Reproducibility
Recent comparative studies have systematically evaluated the performance of these methylation profiling methods. A 2025 comprehensive comparison assessed WGBS, EPIC array, EM-seq, and Oxford Nanopore Technologies (ONT) sequencing across three human genome samples derived from tissue, cell lines, and whole blood [7]. The study found that EM-seq showed the highest concordance with WGBS, indicating strong reliability due to their similar sequencing chemistry [7]. Despite substantial overlap in CpG detection among methods, each technique identified unique CpG sites, emphasizing their complementary nature rather than direct substitutability [7].
The EPICv2 array demonstrates exceptional reproducibility, with technical replicates showing Spearman's rank correlation coefficients (rho) approaching 1.0 [10]. Similarly, EM-seq shows higher consistency between sample replicates compared to WGBS, with lower false-positive rates and more uniform coverage [7] [34]. This reproducibility makes EM-seq particularly suitable for projects requiring integration of datasets from diverse sources and processing by personnel with varying expertise levels [34].
Coverage Distribution and Bias Assessment
A critical differentiator between these technologies is their coverage distribution and technical biases. WGBS suffers from substantial GC bias due to bisulfite-induced fragmentation, resulting in underrepresentation of GC-rich regions [34]. This leads to AT-rich libraries that do not accurately reflect the original sample composition [34]. In contrast, EM-seq produces more uniform coverage across different genomic contexts, with minimal GC bias, enabling more accurate methylation quantification in CpG-rich regions such as promoters and CpG islands [7] [34].
The EPIC array provides targeted coverage focused on functionally relevant genomic regions, with EPICv2 specifically enhancing coverage of enhancer regions, super-enhancers, and CTCF-binding domains [24] [10]. While this targeted approach misses intergenic and non-predefined regulatory regions, it provides cost-effective profiling of biologically significant methylation markers.
Performance with Challenging Samples
Sample quality and quantity requirements vary substantially between methods. EM-seq outperforms both WGBS and PBAT (post-bisulfite adaptor tagging) for low-input samples (1-10ng), producing larger insert sizes, higher alignment rates, and higher library complexity with lower duplication rates [35]. EM-seq also demonstrates higher CpG coverage, better CpG site overlap, and higher consistency between input series compared to bisulfite-based methods [35].
The EPICv2 array supports DNA input down to 1ng while maintaining high reproducibility, making it suitable for precious clinical samples with limited DNA availability [10]. WGBS requires substantial DNA input (typically ≥100ng) due to bisulfite-mediated degradation, limiting its application for rare cell populations or minimally invasive biopsies [32].
Detailed Methodologies for Reproducible Research
Whole-Genome Bisulfite Sequencing Protocol
Standard WGBS library preparation follows either pre-bisulfite or post-bisulfite adapter ligation approaches [32]. The pre-bisulfite method involves:
- Fragmentation: Genomic DNA is fragmented by sonication or enzymatic digestion to 200-300bp fragments.
- End Repair: Fragments are end-repaired to produce blunt-ended DNA with 5'-phosphorylation.
- Adapter Ligation: Methylated adapters are ligated to both ends of the fragments.
- Bisulfite Conversion: Adapter-ligated DNA undergoes bisulfite treatment using commercial kits (e.g., Zymo Research EZ DNA Methylation Kit) with optimized temperature cycling (typically 95-99°C for denaturation, 50-60°C for conversion) [7] [24].
- PCR Amplification: Converted DNA is amplified with 6-12 PCR cycles using methylation-aware polymerases.
- Quality Control: Libraries are validated for size distribution and concentration before sequencing [32].
Post-bisulfite methods, such as PBAT, reverse these steps by performing bisulfite conversion before adapter ligation, reducing DNA loss but potentially increasing duplication rates [32] [35].
Enzymatic Methyl-Sequencing Protocol
The EM-seq protocol (commercialized as NEBNext Enzymatic Methyl-seq Kit) involves [34] [35]:
- DNA Fragmentation: Input DNA (1ng-1μg) is sheared to desired fragment size (typically 350bp) via sonication.
- Enzymatic Conversion: The fragmented DNA undergoes a two-step enzymatic reaction:
- Step 1: TET2 enzyme oxidizes 5mC to 5caC through 5hmC and 5fC intermediates, while T4-BGT glucosylates 5hmC to protect it from oxidation.
- Step 2: APOBEC enzyme deaminates unmodified cytosines to uracils, while 5caC and glucosylated 5hmC remain unchanged.
- Library Construction: Converted DNA undergoes adapter ligation and PCR amplification (10-12 cycles).
- Quality Control: Library size distribution and quality are assessed before sequencing.
This enzymatic approach typically requires 12-16 hours hands-on time and produces libraries with longer insert sizes, higher mapping rates, and lower duplication rates compared to WGBS [34] [35].
EPIC Array Processing Protocol
The standard EPIC array workflow includes [24] [10]:
- Bisulfite Conversion: 500ng-1μg genomic DNA is bisulfite converted using optimized kits (e.g., Zymo Research EZ DNA Methylation Kit).
- Whole-Genome Amplification: Converted DNA is amplified isothermally to generate sufficient material for hybridization.
- Fragmentation and Precipitation: Amplified DNA is fragmented enzymatically and precipitated to remove salts and impurities.
- Hybridization: Processed DNA is hybridized to the EPIC BeadChip for 16-20 hours.
- Single-Base Extension and Staining: Hybridized DNA undergoes single-base extension with labeled nucleotides for methylation detection.
- Imaging and Analysis: BeadChips are imaged using the Illumina iScan system, and methylation levels are calculated from fluorescence intensities.
The entire procedure requires 3-4 days with minimal hands-on time, making it suitable for high-throughput applications [10].
Research Reagent Solutions and Essential Materials
Table 3: Essential Research Reagents for DNA Methylation Profiling
| Reagent/Kit | Application | Function | Key Features |
|---|---|---|---|
| NEBNext Enzymatic Methyl-seq Kit [34] [35] | EM-seq | Enzymatic conversion of methylation states | Avoids DNA degradation; detects 5mC and 5hmC; compatible with low input |
| Zymo Research EZ DNA Methylation Kit [7] [24] | WGBS, EPIC array | Bisulfite conversion | High conversion efficiency; optimized for various input amounts |
| Infinium MethylationEPIC v2.0 BeadChip [24] [10] | EPIC array | Multiplexed methylation detection | >935,000 CpG sites; enhanced enhancer coverage; low input requirement (1ng) |
| Qiagen DNeasy Blood & Tissue Kit [7] | DNA extraction | High-quality DNA isolation | Minimizes DNA degradation; suitable for various sample types |
| Trim Galore [32] [33] | Data processing | Quality control and adapter trimming | Handles bisulfite-converted data; automatic adapter detection |
| Bismark [32] [35] | Data analysis | Alignment and methylation extraction | Handles both WGBS and EM-seq data; supports various aligners |
| minfi R Package [7] [10] | Data analysis | EPIC array data processing | Normalization; quality control; differential methylation analysis |
Decision Framework and Concluding Recommendations
Technology Selection Guide
The optimal choice of methylation profiling technology depends on specific research goals, sample characteristics, and resource constraints. The following decision framework provides guidance for method selection:
For Comprehensive Discovery Studies: EM-seq is increasingly preferable to WGBS due to superior data quality, reduced biases, and better performance with limited samples [7] [34]. While costs remain higher than microarrays, the comprehensive genome coverage and single-base resolution justify the investment for mechanistic studies.
For Large-Scale Epidemiological or Clinical Studies: EPICv2 array provides the most cost-effective solution for profiling thousands of samples [24] [10]. The enhanced coverage of regulatory elements in EPICv2 captures biologically relevant methylation changes while maintaining practical throughput and analysis requirements.
For Limited or Degraded Samples: EM-seq outperforms WGBS for low-input samples (1-10ng) [35], while EPICv2 also supports low-input profiling down to 1ng [10]. The choice depends on whether targeted epigenome-wide (EPIC) or comprehensive genome-wide (EM-seq) coverage is required.
For Non-CpG Methylation Analysis: Both WGBS and EM-seq support non-CpG methylation profiling, with EM-seq providing more accurate quantification due to reduced bias [7] [34]. EPIC arrays are primarily limited to CpG contexts.
For Integration with Existing Data: Consider probe overlap and technical compatibility. EPICv2 retains 77.63% of probes from EPICv1, facilitating cross-study comparisons [24] [10]. EM-seq data correlates strongly with WGBS, enabling meta-analyses with proper normalization [7].
Future Outlook and Emerging Trends
The field of DNA methylation profiling continues to evolve with several promising developments. Enzymatic conversion methods like EM-seq are expected to gradually replace bisulfite-based approaches as costs decrease and protocols become more standardized [36]. Targeted EM-seq approaches, such as Targeted Methylation Sequencing (TMS), enable cost-effective profiling of specific CpG sites while maintaining the advantages of enzymatic conversion [36]. Integration of methylation profiling technologies with other multi-omics approaches will provide more comprehensive insights into epigenetic regulation in health and disease.
In conclusion, the choice between WGBS, EPIC array, and EM-seq involves balancing multiple factors including cost, throughput, data comprehensiveness, and sample requirements. While WGBS remains a valuable tool for specific applications, EM-seq offers superior data quality with fewer technical artifacts, and EPIC arrays provide unmatched cost-efficiency for large-scale studies. Researchers should carefully consider their specific research questions, sample limitations, and analytical resources when selecting the most appropriate methylation profiling technology.
At a Glance: Technology Comparison
| Feature | WGBS | EPIC Array | EM-seq |
|---|---|---|---|
| Fundamental Principle | Chemical conversion via sodium bisulfite [32] | Microarray hybridization of bisulfite-converted DNA [37] | Enzymatic conversion using TET2 & APOBEC3A [14] |
| Resolution & Coverage | Single-base; ~80% of all CpGs (whole-genome) [7] [24] | Single-base for ~930,000 predefined CpG sites [38] [24] | Single-base; whole-genome, comparable to WGBS [14] |
| DNA Input Requirement | High (typically 50-100 ng+) [3] | Moderate (250 ng) [38] | Low (can be effective with 100 pg) [14] [3] |
| Key Advantage | Gold standard, comprehensive genome coverage [32] [24] | Cost-effective for large cohorts, simple analysis [37] [24] | Superior library complexity & uniformity, minimal DNA damage [7] [14] |
| Primary Limitation | Severe DNA degradation, high sequencing depth needed [32] [7] | Limited to predefined sites, cannot discover novel CpGs [24] | Lengthy protocol, higher cost than WGBS [4] [3] |
Cancer Biomarker Discovery
The identification of novel DNA methylation biomarkers requires technologies that are both comprehensive to scan the entire genome and precise to detect subtle, cancer-specific changes.
Performance and Experimental Data
In a major study aimed at diagnosing and differentiating common adenocarcinomas, researchers leveraged the Illumina Infinium HumanMethylation450 BeadChip (HM450), a precursor to the EPIC array. The study utilized a massive identification dataset of 2,853 samples and an independent verification dataset of 782 samples [37].
- Performance: The best diagnostic panels for different cancer types (e.g., breast, colorectal, lung adenocarcinoma) showed sensitivities of 77.8–95.9% and specificities of 92.7–97.5% against other tumors [37].
- Metastasis Detection: Crucially, these EPIC array-derived panels successfully extended to liver metastases, differentiating between them with a sensitivity and specificity of 83.3–100% and a diagnostic accuracy of 86.8–91.9% [37].
This demonstrates the EPIC array's power in biomarker discovery for large-scale tissue samples.
Experimental Protocol: EPIC Array for Biomarker Discovery
The typical workflow for such a discovery project is as follows [37] [7]:
- Sample Preparation: Extract DNA from a large cohort of primary tumor samples and normal tissue controls.
- Bisulfite Conversion: Treat 500-1000 ng of DNA using a kit like the EZ DNA Methylation Kit (Zymo Research), which converts unmethylated cytosines to uracils.
- Microarray Hybridization: Apply the bisulfite-converted DNA to the Infinium MethylationEPIC BeadChip.
- Data Analysis: Preprocess data with packages like
minfiin R. Methylation levels are quantified as beta-values, ranging from 0 (completely unmethylated) to 1 (fully methylated). Bioinformatic analyses are then performed to identify probes hypermethylated in a specific cancer but unmethylated in comparator types.
Liquid Biopsy Development
Liquid biopsy, which analyzes cell-free DNA (cfDNA) from blood, presents a major challenge for methylation analysis due to the very low input and fragmented nature of the DNA. Here, methods that minimize DNA loss are critical.
Performance and Experimental Data
EM-seq shines in this area. A 2025 study introduced Ultra-Mild Bisulfite Sequencing (UMBS-seq), an improved bisulfite method, and compared it directly to EM-seq and Conventional Bisulfite Sequencing (CBS-seq) using cfDNA [4].
- Library Yield & Complexity: With low-input cfDNA (5 ng down to 10 pg), UMBS-seq and EM-seq consistently produced higher library yields and lower duplication rates than CBS-seq, indicating better preservation of the original DNA complexity [4].
- DNA Damage: Both UMBS-seq and EM-seq effectively preserved the characteristic cfDNA fragment length profile after treatment, while conventional bisulfite methods caused severe degradation [4].
- Background Noise: EM-seq showed higher background levels of unconverted cytosines at low inputs (exceeding 1%), while UMBS-seq maintained a low background of ~0.1%. This suggests enzymatic methods can be prone to false positives with trace amounts of DNA [4].
A separate study confirmed that EM-seq is effective with as little as 100 pg of DNA, maintaining high mapping efficiency and even coverage, which is ideal for cfDNA applications [14].
Experimental Protocol: EM-seq for Cell-free DNA
The EM-seq protocol for cfDNA involves the following key enzymatic steps [14]:
- Oxidation and Protection: The DNA is incubated with the enzymes TET2 and T4-BGT. TET2 oxidizes 5mC and 5hmC to derivatives (5caC), while T4-BGT glucosylates 5hmC, protecting both modified forms.
- Deamination: The enzyme APOBEC3A deaminates all unmodified cytosines to uracils. The protected 5mC/5hmC derivatives are unaffected.
- Library Preparation & Sequencing: Standard Illumina library preparation is performed, and upon sequencing, unmethylated cytosines are read as thymines, while methylated cytosines are read as cytosines.
Clinical Trial Profiling
Clinical trials that validate biomarkers for diagnostic use require a robust, cost-effective, and high-throughput method to profile hundreds or thousands of patient samples.
Performance and Experimental Data
The EPIC array is the dominant technology in this sphere. Its design is tailored for large-scale studies. The latest version, the Infinium MethylationEPIC v2.0 BeadChip, covers approximately 930,000 CpG sites and is compatible with FFPE tissue, a common sample type in biorepositories [38] [24].
- Throughput: A single instrument can process 3,024 samples per week [38].
- Reproducibility: Technical and biological validation of the EPIC v2.0 array has shown high reproducibility and consistency among technical replicates and with DNA from FFPE tissue [24].
- Content: The v2.0 array includes enhanced coverage of functional genomic regions like enhancers and CTCF-binding sites, which are increasingly important in understanding cancer biology [24].
The utility of methylation arrays in clinical trials is demonstrated by a multicenter prospective clinical trial for early esophageal cancer detection. The study successfully identified and validated cfDNA methylation markers for early-stage cancer, though the specific technology used was not detailed in the provided excerpt [39].
Experimental Protocol: EPIC Array for Large Cohorts
The standardized protocol for the EPIC array is straightforward and automatable [7] [38]:
- Bisulfite Conversion: 250 ng of DNA is bisulfite converted using a kit (e.g., Zymo Research EZ DNA Methylation Kit).
- Array Processing: The converted DNA is whole-genome amplified, fragmented, and hybridized to the EPIC BeadChip.
- Staining & Imaging: The array is stained and imaged on a system like the Illumina iScan.
- Data Analysis: Primary data analysis and quality control are performed using Illumina's GenomeStudio software with the Methylation Module. The output is a beta-value for each of the ~930,000 CpG sites per sample.
The Scientist's Toolkit: Essential Research Reagents
| Reagent / Kit | Function | Primary Application |
|---|---|---|
| EZ DNA Methylation Kit (Zymo Research) | Chemical bisulfite conversion of DNA. | WGBS, EPIC Array [7] |
| NEBNext EM-seq Kit (New England Biolabs) | Enzymatic conversion of DNA for methylation detection. | EM-seq [4] [14] |
| Infinium MethylationEPIC v2.0 BeadChip (Illumina) | Microarray for high-throughput methylation profiling at predefined sites. | EPIC Array [38] [24] |
| TET2 Enzyme | Oxidizes 5mC to 5caC for protection from deamination. | EM-seq [14] |
| APOBEC3A Enzyme | Deaminates unmodified cytosines to uracils. | EM-seq [14] |
| Nanobind Tissue Big DNA Kit (Circulomics) | High-molecular-weight DNA extraction for long-read sequencing. | DNA input for various methods [7] |
The choice of methylation profiling technology is dictated by the specific phase and goal of the research project.
- For initial, unbiased biomarker discovery where budget and sample quality permit, WGBS remains the gold standard for its comprehensive coverage [32] [24].
- For liquid biopsy development and analyzing precious, low-input or fragmented samples, EM-seq is the superior choice due to its minimal DNA damage, high library complexity, and robust performance with low DNA inputs [7] [4] [14].
- For large-scale clinical validation and profiling in trials involving thousands of samples, the EPIC array is unmatched in its throughput, cost-effectiveness, and analytical robustness [37] [38] [24].
Optimizing Performance and Overcoming Technical Hurdles in Methylation Workflows
Accurate genome-wide DNA methylation profiling is a cornerstone of modern epigenetics research, with critical applications in oncology, neurodevelopment, and biomarker discovery [40]. The integrity of DNA templates throughout experimental workflows directly determines the reliability of methylation data, making the mitigation of DNA degradation a paramount concern for researchers. For years, bisulfite conversion—the chemical process that converts unmethylated cytosines to uracils—has been the undisputed gold standard for distinguishing methylation states [41]. However, this method imposes significant DNA damage through harsh chemical conditions involving extreme temperatures and pH levels, resulting in DNA fragmentation, sequence loss, and potential introduction of biases [7] [41].
The recent emergence of enzymatic methyl-sequencing (EM-seq) offers a promising alternative that leverages enzyme-based conversion to preserve DNA integrity while maintaining high conversion efficiency [7] [42] [3]. This guide provides a comprehensive technical comparison between these approaches, focusing specifically on their capabilities for mitigating DNA degradation while providing high-quality methylation data. Framed within the broader context of comparing whole-genome bisulfite sequencing (WGBS), EPIC arrays, and EM-seq, we present experimental data, detailed methodologies, and practical recommendations to inform protocol selection for diverse research scenarios and sample types.
Technical Mechanisms: How Bisulfite and Enzymatic Methods Work
Bisulfite Conversion: Established Chemistry with Inherent DNA Damage
The traditional bisulfite conversion method relies on sodium bisulfite to deaminate unmethylated cytosines to uracils, which are then amplified as thymines during PCR. Methylated cytosines (5mC and 5hmC) resist this conversion and are amplified as cytosines [41]. This process creates specific C-to-T transitions that can be detected through sequencing or array-based platforms. The fundamental limitation of this approach lies in the deleterious effects of the conversion chemistry on DNA structure. The process involves single-strand breaks and substantial fragmentation of DNA due to depyrimidination under the required extreme reaction conditions [7] [41]. Although modern bisulfite kits have streamlined workflows and can achieve >99% conversion efficiency, they continue to present challenges regarding DNA degradation, particularly with limited or partially degraded samples [43].
EM-seq: Enzymatic Preservation of DNA Integrity
EM-seq employs a completely different mechanism that avoids harsh chemical treatments. This enzymatic approach uses Tet methylcytosine dioxygenase 2 (TET2) to oxidize 5-methylcytosine (5mC) and 5-hydroxymethylcytosine (5hmC) to specific derivatives. Subsequently, T4 bacteriophage beta-glucosyltransferase (T4-BGT) glucosylates 5hmC, protecting all modified cytosines. The APOBEC3A enzyme then deaminates unmodified cytosines to uracils, while oxidized methylated cytosines remain protected [7] [3] [40]. During PCR amplification, uracils are replaced with thymines, creating the same C-to-T transitions as bisulfite conversion but without significant DNA fragmentation. This preservation of DNA backbone integrity represents the primary advantage of EM-seq, particularly for valuable clinical samples or applications requiring long-range methylation information [41] [3].
Figure 1: Comparative workflows of EM-seq enzymatic conversion versus bisulfite chemical conversion, highlighting differential impacts on DNA integrity.
Performance Comparison: Quantitative Data Across Platforms
Direct Method Comparison Studies
Recent comprehensive studies have systematically evaluated the performance of bisulfite-based and enzymatic methods alongside array-based approaches. The evidence demonstrates that EM-seq consistently outperforms bisulfite methods in key metrics related to DNA preservation while maintaining high concordance for methylation calling.
Table 1: Comparative Performance of DNA Methylation Analysis Platforms
| Metric | WGBS | EM-seq | EPIC Array | Nanopore |
|---|---|---|---|---|
| DNA Integrity Preservation | Low (extensive fragmentation) | High (minimal damage) | Moderate (requires intact DNA for conversion) | Highest (direct sequencing) |
| Conversion Efficiency | >99% [43] | >99% [41] | >99% [43] | Not applicable |
| Input DNA Requirements | 1-5 μg [40] | 200 ng [40] | 500 ng [5] | ~1 μg [7] |
| CpG Site Coverage | ~28 million sites (genome-wide) [44] | ~28 million sites (genome-wide) [3] | 850,000-935,000 sites (targeted) [7] [40] | Genome-wide with long reads |
| Library Complexity | Reduced due to fragmentation | 25% higher than PBAT [3] | Not applicable | Not applicable |
| GC-Rich Region Performance | Biased coverage [3] | More uniform coverage [42] [3] | Probe-dependent [3] | No GC bias [3] |
A 2025 multi-protocol evaluation using certified Quartet DNA reference materials demonstrated that EM-seq produces library yields approximately 25% higher than post-bisulfite adapter tagging (PBAT) methods at the same DNA input level (10 ng), indicating superior retention of usable templates [3] [23]. Additionally, research by Han et al. (2022) showed that EM-seq generates significantly more unique reads and reduces duplicate rates in sequencing libraries—direct evidence of better-preserved complexity resulting from minimal DNA degradation [3].
Concordance with Established Platforms
When comparing methylation calls across platforms, EM-seq shows high quantitative agreement with established bisulfite-based methods. A multi-arm experiment using reference cell lines and clinical samples found that EM-seq and bisulfite sequencing were highly concordant, with Pearson correlation coefficients of 0.89-0.92 for CpG sites [41] [3]. This strong correlation indicates that the enzymatic method preserves biological signals while offering technical advantages.
For the EPIC array, targeted bisulfite sequencing approaches have demonstrated strong sample-wise correlation with array data, particularly in high-quality DNA samples. A 2025 ovarian cancer study reported strong correlation between custom bisulfite sequencing panels and Infinium Methylation EPIC arrays, though agreement was slightly reduced in cervical swabs with lower DNA quality [5]. This pattern highlights how sample integrity interacts with method performance—precisely where EM-seq's preservation advantages become most valuable.
Table 2: Quantitative Methylation Concordance Between Platforms
| Comparison | Correlation Coefficient | Study Context | Notes |
|---|---|---|---|
| EM-seq vs. WGBS | R = 0.89-0.92 [3] | Arabidopsis thaliana, human cell lines | Higher consistency in high-input DNA |
| EM-seq vs. PBAT | R = 0.89 (CG sites) [3] | Low-input DNA (10ng) | EM-seq detected 18% more rare methylation sites |
| Targeted BS vs. EPIC Array | Strong sample-wise correlation [5] | Ovarian cancer tissues | Slightly lower agreement in cervical swabs |
| MC-seq vs. EPIC Array | R: 0.98-0.99 [44] | PBMC samples | 235 CpGs showed significant differences (beta value >0.5) |
Experimental Protocols: Detailed Methodologies
Bisulfite Conversion Protocols
Standard bisulfite conversion protocols follow a general framework with kit-specific variations. The EZ DNA Methylation-Gold and EZ DNA Methylation-Lightning kits (Zymo Research) represent commonly used approaches with demonstrated effectiveness for array and sequencing applications [5] [43].
Standard Bisulfite Conversion Protocol (EZ DNA Methylation-Gold):
- DNA Input: 500 pg - 2 μg DNA in 20 μL volume [43]
- Denaturation: Add 130 μL CT Conversion Reagent, incubate at 98°C for 10 minutes
- Conversion: Incubate at 64°C for 2.5-4 hours (time optimization needed for sample type)
- Desalting: Bind samples to spin columns, add 400 μL M-Binding Buffer
- Wash: 100 μL M-Wash Buffer (two centrifugation steps)
- Desulfonation: 200 μL M-Desulphonation Buffer, room temperature for 20 minutes
- Final Wash: 200 μL M-Wash Buffer (two steps)
- Elution: 10-20 μL M-Elution Buffer [43]
For degraded or limited samples such as FFPE tissue or cell-free DNA, the EZ DNA Methylation-Direct kit enables conversion directly from cells or tissue, minimizing pre-processing losses. The more recent EZ DNA Methylation-Lightning system reduces processing time to 1.5 hours with reportedly gentler chemistry, achieving >99.5% conversion efficiency with reduced fragmentation [43].
EM-seq Library Preparation Protocol
The NEBNext Enzymatic Methyl-seq Kit provides a standardized protocol for enzymatic conversion and library preparation:
- DNA Input: 100-200 ng genomic DNA in 50 μL volume [42]
- Fragmentation: Ultrasonic shearing to 270-320 bp (Covaris LE220-plus) [42]
- End Repair & dA-Tailing: Standard NGS library preparation steps
- Adapter Ligation: Use of methylated adapters for compatibility
- Enzymatic Conversion:
- TET2 incubation: 1 hour at 37°C
- T4-BGT incubation: 30 minutes at 37°C
- APOBEC3A deamination: 1 hour at 37°C
- PCR Amplification: 8-12 cycles with index primers [42]
- Quality Control:
- Size selection: 300-500 bp fragments
- Quantification: Qubit Fluorometer and Agilent TapeStation
- Conversion efficiency verification: Unmethylated lambda DNA and methylated pUC19 controls [42]
For both protocols, inclusion of unmethylated and fully methylated control DNA is essential for validating conversion efficiency. The enzymatic protocol typically requires 2-4 days for completion compared to 1.5-4 hours for bisulfite conversion, representing a trade-off between workflow simplicity and DNA preservation [3].
The Scientist's Toolkit: Essential Research Reagents
Table 3: Essential Reagents for DNA Methylation Analysis
| Reagent/Kits | Specific Examples | Function | Considerations |
|---|---|---|---|
| Bisulfite Conversion Kits | EZ DNA Methylation-Gold, EZ DNA Methylation-Lightning (Zymo Research) [43] | Chemical conversion of unmethylated cytosines | Lightning version offers faster, gentler processing; Gold provides established reliability |
| Enzymatic Conversion Kits | NEBNext Enzymatic Methyl-seq Kit (New England Biolabs) [42] | Enzyme-based conversion preserving DNA integrity | Higher cost but superior DNA preservation; compatible with Illumina platforms |
| DNA Extraction Kits | QIAamp DNA Mini Kit (tissue), Maxwell RSC Tissue DNA Kit [5] [42] | High-quality DNA extraction | Critical for obtaining sufficient input material with minimal degradation |
| Bisulfite Control DNA | Unmethylated lambda DNA, methylated pUC19 [42] | Conversion efficiency verification | Essential for validating both bisulfite and enzymatic methods |
| Library Prep Kits | SureSelectXT Methyl-Seq (capture), Accel-NGS Methyl-Seq (bisulfite) [41] [44] | Library preparation for sequencing | Choice depends on application: whole-genome vs. targeted approaches |
| Quality Control Tools | Bioanalyzer/TapeStation, Qubit Fluorometer [5] [42] | Assessment of DNA and library quality | Critical for evaluating fragmentation levels and quantifying yields |
Application-Based Method Selection Guide
Sample Type-Specific Recommendations
The optimal choice between bisulfite conversion and EM-seq depends heavily on sample characteristics and research objectives:
High-Quality DNA Samples (fresh frozen tissue, cell lines): Traditional bisulfite conversion remains a cost-effective option with proven performance, particularly for WGBS or EPIC array applications [5] [40]. The DNA degradation concerns are less pronounced with intact, high-molecular-weight DNA.
Limited/Precision Samples (FFPE, cfDNA, biopsies): EM-seq is strongly recommended due to its superior preservation of DNA integrity and performance with low-input materials (as little as 200 ng) [41] [40]. Studies demonstrate 30% higher library complexity with enzymatic methods in low-input scenarios [3].
GC-Rich Regions (CpG islands, promoters): EM-seq provides more uniform coverage without the GC bias characteristic of bisulfite conversion [42] [3]. One study found that EM-seq improved detection in low-complexity regions by 18% compared to PBAT methods [3].
Large Cohort Studies: For human studies with hundreds to thousands of samples, EPIC arrays offer the most cost-effective solution, requiring only 500 ng of DNA per sample with standardized analysis pipelines [5] [40]. However, researchers should acknowledge the limited, pre-selected coverage of approximately 3-4% of the human methylome [40].
Figure 2: Decision framework for selecting appropriate DNA methylation analysis methods based on sample characteristics and research objectives.
The field of DNA methylation analysis continues to evolve with increasing emphasis on methods that preserve molecular integrity while maintaining analytical precision. While bisulfite conversion remains the established benchmark with extensive validation across diverse sample types, enzymatic conversion methods—particularly EM-seq—demonstrate clear advantages for applications involving limited, degraded, or precious samples where DNA preservation is paramount [41] [3].
Future methodology development will likely focus on further reducing input requirements, improving cost-effectiveness, and enhancing compatibility with single-cell and long-read sequencing platforms. The emergence of comprehensive reference datasets from projects using Quartet reference materials will enable more rigorous benchmarking and quality control across laboratories [23]. As these technologies mature, researchers must continue to match method selection to specific experimental needs, considering the critical trade-offs between DNA preservation, coverage, resolution, and practical constraints of throughput and cost.
For the present, EM-seq represents the most advanced solution for mitigating DNA degradation while providing high-quality, genome-wide methylation data. Its enzymatic conversion approach successfully addresses the fundamental limitation of bisulfite-based methods—extensive DNA fragmentation—making it particularly valuable for clinical samples, biomarker discovery, and studies requiring accurate profiling of challenging genomic regions.
The accurate mapping of DNA methylation is fundamental to understanding gene regulation, cellular differentiation, and the epigenetic mechanisms of disease. However, a significant technical challenge in this field is the presence of sequence-specific biases, particularly in GC-rich regions of the genome such as CpG islands. These areas, often located in gene promoters, are crucial for transcriptional regulation but are notoriously difficult to assess accurately with conventional methods. This guide objectively compares the performance of Enzymatic Methyl-Sequencing (EM-seq) and the Illumina MethylationEPIC (EPIC) BeadChip array with the traditional gold standard, Whole-Genome Bisulfite Sequencing (WGBS), focusing on their efficacy in mitigating biases in GC-rich contexts. Supported by experimental data, this analysis provides researchers, scientists, and drug development professionals with a clear framework for selecting the most appropriate technology for their methylation quantification research.
Table: Comparative Performance of Methylation Profiling Technologies
| Feature | Whole-Genome Bisulfite Sequencing (WGBS) | Enzymatic Methyl-Sequencing (EM-seq) | Illumina EPIC Array |
|---|---|---|---|
| Core Technology | Chemical conversion (sodium bisulfite) [45] | Enzymatic conversion (TET2 & APOBEC) [46] [47] | BeadChip microarray hybridization [25] |
| DNA Degradation | High (up to 90% degradation) [47] | Minimal (enzymatic treatment is mild) [47] [3] | Occurs during pre-processing bisulfite step [7] |
| Bias in GC-Rich Regions | Significant bias and under-representation [47] [3] | Uniform coverage; minimal GC bias [7] [3] | Probe cross-hybridization leads to overestimation [25] [3] |
| CpG Coverage | ~80% of all CpGs (theoretical genome-wide) [7] | Superior to WGBS; ~54M CpGs at 1x coverage (vs 36M for WGBS) [47] | Targeted (~935,000 predefined CpG sites) [25] |
| Input DNA Requirements | High (typically 100ng+) [3] | Low (can be as low as 100pg) [47] [3] | Moderate (500ng for standard protocol) [7] |
| Quantitative Data Concordance | Gold standard, but overestimates methylation due to damage [47] | High concordance with WGBS (R=0.89), more accurate in low-input [3] | High concordance in high/low methylation; disagreement in moderate methylation [48] |
| Best Application | Gold standard for genome-wide methylation where input is not limiting | Superior for low-input samples, long-read tech, and GC-rich region analysis [7] [47] | Cost-effective for large, population-scale epigenome-wide association studies (EWAS) [48] |
Experimental Insights and Performance Data
EM-seq's Enzymatic Conversion Minimizes DNA Damage and Bias
Experimental Protocol: In a systematic comparison of library preparation protocols, EM-seq utilized a two-step enzymatic process. First, the TET2 enzyme oxidizes 5-methylcytosine (5mC) and 5-hydroxymethylcytosine (5hmC) to derivatives, which are then protected. Second, the APOBEC enzyme deaminates unmodified cytosines to uracils. This process avoids the harsh conditions (high temperature and pH) of bisulfite conversion [46] [47].
Key Findings:
- Preserved DNA Integrity: EM-seq libraries showed significantly longer insert sizes (370-420 bp on average, up to ~550 bp) compared to the fragmented DNA from WGBS libraries [47]. This intact DNA is crucial for even genome coverage.
- Uniform CpG Detection: In a low-input (10 ng) human DNA study, EM-seq detected 54 million unique CpGs at 1x coverage depth, a 50% increase over the 36 million CpGs detected by WGBS. At a more stringent 8x coverage, EM-seq detected 11 million CpGs versus only 1.6 million for WGBS [47].
- Accuracy in Plants: A study on Arabidopsis thaliana found that with low-input DNA (10 ng), EM-seq detected 32% more methylation sites on average across CG, CHG, and CHH contexts compared to WGBS. The misjudgment rate of methylation status for EM-seq was 2.1%, nearly 64% lower than the 5.8% rate for WGBS [3].
These results demonstrate that EM-seq's gentle enzymatic treatment effectively circumvents the DNA degradation that plagues bisulfite-based methods, leading to more comprehensive and accurate coverage, particularly in challenging genomic regions.
EPIC Array's Fixed Probes Struggle with Cross-Hybridization in GC-Rich Contexts
Experimental Protocol: The EPIC array technology involves hybridizing bisulfite-converted DNA to pre-designed probes attached to beads on a microarray. Methylation levels (β-values) are calculated based on the fluorescence intensity ratio of methylated to unmethylated probes [25]. The latest EPIC v2 array contains over 935,000 predefined CpG sites [25].
Key Findings:
- Probe Cross-Hybridization: In silico analysis of the EPICv2 probe sequences demonstrates that probe cross-hybridization "remains a significant problem." Probes designed for a specific target sequence can non-specifically bind to off-target genomic regions, which is particularly problematic in GC-rich regions due to their repetitive nature [25].
- Empirical Evidence for Bias: Comparison of EPICv2 data with Whole Genome Bisulfite Sequencing (WGBS) provided "empirical evidence for preferential off-target binding," confirming that this cross-hybridization leads to inaccurate methylation quantification [25].
- Performance in Moderately Methylated Regions: A study comparing the EPIC array with a targeted sequencing method (SeqCap) found an overall high concordance (r = 0.84). However, "substantial disagreement was present between the two methods in moderately methylated regions," with the sequencing method exhibiting greater within-site variation [48].
The fixed-content design of the EPIC array makes it efficient for large studies, but its reliance on probe hybridization introduces a specific type of bias in GC-rich and other complex regions, potentially leading to overestimation of methylation levels [25] [3].
Direct Comparison Reveals EM-seq's Superiority in Complex Regions
Experimental Protocol: A 2025 comparative evaluation assessed WGBS, EPIC, EM-seq, and Oxford Nanopore Technologies (ONT) across three human genome samples (tissue, cell line, and whole blood). The study systematically compared methods based on resolution, genomic coverage, and methylation calling accuracy [7].
Key Findings:
- Coverage and Concordance: The study concluded that "EM-seq delivers consistent and uniform coverage," showing the highest concordance with WGBS. Meanwhile, "ONT... captured certain loci uniquely and enabled methylation detection in challenging genomic regions" [7].
- Complementary Nature: Despite substantial overlap, "each method identified unique CpG sites, emphasizing their complementary nature" [7]. This highlights that while EM-seq excels in uniformity, other methods like ONT can provide additional insights in specific contexts.
- Long-Range Phasing: Because EM-seq preserves DNA integrity, its longer fragment lengths make it suitable for long-read sequencing technologies like PacBio SMRT Sequencing, enabling phased methylation analysis that is impossible with heavily degraded bisulfite-converted DNA [47].
Research Reagent Solutions for Methylation Profiling
The following table details key reagents and their functions in conducting methylation studies, based on protocols cited in the experimental data.
| Research Reagent | Function in Methylation Analysis | Example Use Case |
|---|---|---|
| Sodium Bisulfite | Chemical conversion of unmethylated cytosine to uracil [45]. | Core reagent for WGBS and pre-processing for EPIC array [7] [45]. |
| TET2 Enzyme | Oxidizes 5mC and 5hmC for protection from deamination [46] [47]. | First step in the two-step EM-seq conversion process [47]. |
| APOBEC Enzyme | Deaminates unmodified cytosines to uracils [46] [47]. | Second step in the EM-seq conversion process [47]. |
| T4-BGT (T4 β-glucosyltransferase) | Glucosylates 5hmC, protecting it from oxidation and deamination [7]. | Included in EM-seq reaction to distinguish 5hmC [7]. |
| Infinium BeadChip | Microarray with probes for specific CpG sites to measure methylation [25]. | Core component of the Illumina EPIC array platform [48] [25]. |
| MspI Restriction Enzyme | Digests DNA at CCGG sites to enrich for CpG-rich regions [47]. | Used in Reduced Representation Bisulfite Sequencing (RRBS) [47]. |
The choice between EM-seq, EPIC array, and WGBS for DNA methylation research involves a clear trade-off between data quality, coverage, cost, and practicality. For investigations where the primary goal is accurate, bias-free methylation mapping across the entire genome—especially in challenging GC-rich regions and with limited DNA input—EM-seq emerges as the superior technological advance over traditional WGBS. Its enzymatic conversion approach successfully eliminates the foundational issue of DNA degradation, providing more biologically meaningful results. The EPIC array remains a powerful tool for large-scale epidemiological studies where high sample throughput and cost-effectiveness are priorities, and where its limitations in probe design and regional bias can be managed or are of less concern. Ultimately, the decision should be guided by the specific experimental requirements, but the evidence strongly positions EM-seq as the leading solution for overcoming sequence-specific biases in modern methylation profiling.
In DNA methylation research, the choice of profiling platform directly impacts data quality and biological conclusions. Key quality control parameters—conversion efficiency, coverage uniformity, and technical reproducibility—vary significantly across methods due to their fundamental biochemical principles and technical implementations. This guide provides an objective comparison of three widely used technologies: whole-genome bisulfite sequencing (WGBS), Illumina MethylationEPIC (EPIC) microarrays, and enzymatic methyl-sequencing (EM-seq). Understanding their performance characteristics is essential for selecting the appropriate method for specific research scenarios, from large-scale epigenome-wide association studies to investigations of challenging genomic regions.
Fundamental Methodological Differences
Each platform employs distinct approaches for detecting DNA methylation at cytosine bases:
WGBS relies on harsh chemical treatment with sodium bisulfite, which deaminates unmethylated cytosines to uracils while leaving methylated cytosines unchanged. This conversion enables detection through subsequent sequencing but causes substantial DNA fragmentation and introduces sequence biases [7] [11].
EPIC arrays also utilize bisulfite conversion but employ hybridization to predefined probes rather than sequencing. The microarray format Interrogates approximately 935,000 predetermined CpG sites, primarily in gene promoters and regulatory elements, providing a cost-effective solution for population-scale studies but lacking whole-genome coverage [7] [27].
EM-seq replaces chemical conversion with a two-step enzymatic process. The TET2 enzyme oxidizes methylated cytosines, followed by APOBEC-mediated deamination of unmethylated cytosines. This gentler treatment preserves DNA integrity and reduces sequence context biases [7] [3].
Biochemical Pathways
The following diagrams illustrate the core biochemical reactions for bisulfite-based and enzymatic conversion methods.
Comparative Performance Metrics
Quantitative Performance Comparison
Table 1: Comprehensive performance metrics across DNA methylation profiling platforms
| Parameter | WGBS | EPIC Array | EM-seq | Experimental Context |
|---|---|---|---|---|
| CpG Sites Detected | ~28 million sites (80% of genome) [11] | ~935,000 predefined sites [7] | Comparable to WGBS, with improved coverage in GC-rich regions [7] | Human genome analysis [7] [11] |
| Conversion Efficiency | >99% but with incomplete conversion concerns [7] | >99% but GC-rich regions problematic [7] | >99.5% with more uniform conversion [3] | Lambda phage controls [3] |
| Coverage Uniformity (GC-rich regions) | Poor coverage in high-GC regions due to bisulfite bias [11] | Probe-dependent, cross-hybridization in GC-rich regions [3] | Significantly more uniform coverage, minimal GC bias [11] | Human CpG island analysis [11] |
| Technical Reproducibility | Pearson r=0.826-0.906 between replicates [11] | High reproducibility for predefined sites [27] | Pearson r=0.89-0.98 between replicates [3] [11] | Biological replicate analysis [3] [11] |
| DNA Input Requirements | 100ng+ for standard protocols [3] | 500ng for standard protocol [7] | Effective with 1-10ng input DNA [3] | Titration experiments [3] |
| DNA Degradation | Significant fragmentation (100-200bp fragments) [3] | Moderate fragmentation but standardized [7] | Minimal fragmentation (300-500bp fragments) [3] | Fragment size analysis [3] |
Specialized Performance Metrics
Table 2: Specialized application performance and practical considerations
| Parameter | WGBS | EPIC Array | EM-seq | Experimental Context |
|---|---|---|---|---|
| Methylation Quantification Accuracy | High but overestimation in low-complexity regions [3] | Good for intermediate methylation values, compression at extremes [3] | High accuracy, particularly in CHG and CHH contexts [3] | Comparison to synthetic standards [3] |
| Library Complexity | Moderate, GC bias reduces complexity [11] | Fixed by design | High, >30% improvement over WGBS at low input [3] | Duplication rate analysis [3] |
| Non-CpG Methylation Detection | Yes, with limitations in GC-rich regions [7] | Limited to predefined CpG sites | Yes, with improved sensitivity [3] | Arabidopsis thaliana study [3] |
| Operational Considerations | 2-3 days library prep, established protocols [7] | 2-day protocol, standardized analysis [7] | 2-4 days library prep, specialized reagents [3] | Protocol documentation [7] [3] |
| Cost per Sample | $$-$$$ (sequencing-dependent) [7] | $ (fixed cost) [7] | $$-$$$ (reagent costs higher) [3] | Market pricing analysis [7] [3] |
Experimental Protocols for Performance Validation
Assessing Conversion Efficiency
Principle: Conversion efficiency verification is critical for data quality control, ensuring unmethylated cytosines are properly converted while methylated cytosines remain protected.
EM-seq Protocol:
- Spike-in Controls: Include unmethylated phage lambda DNA and CpG-methylated pUC19 DNA controls provided in the NEBNext Enzymatic Methyl-seq Kit during library preparation [42].
- Conversion Assessment: Calculate conversion efficiency as the percentage of cytosines remaining in the unmethylated lambda control after conversion and sequencing. Threshold: >99.5% conversion efficiency recommended [3].
- Data Analysis: Determine methylation levels in the methylated pUC19 control to verify protection of methylated cytosines. Expected value: >95% methylation retention [42].
WGBS/EPIC Protocol:
- Control Inclusion: Use unmethylated lambda DNA spike-in during bisulfite treatment with EZ DNA Methylation Kit (Zymo Research) [7].
- Efficiency Calculation: Assess percentage of unconverted cytosines in lambda genome. Threshold: >99% conversion required [7].
- Quality Flagging: Flag samples with conversion efficiency <99% for potential exclusion or careful interpretation [7].
Evaluating Coverage Uniformity
Principle: Uniform coverage across different genomic contexts ensures unbiased methylation assessment, particularly in GC-rich regions like CpG islands.
EM-seq/WGBS Protocol:
- Sequencing and Alignment: Sequence libraries to appropriate depth (typically 20-30× for mammalian genomes) and align using Bismark or similar bisulfite-aware aligner [11] [42].
- GC-Bias Assessment: Calculate coverage distribution across GC-content bins (e.g., 0-20%, 20-40%, etc.) and compare to expected distribution [11].
- Regional Analysis: Specifically assess coverage in CpG islands, shores, shelves, and open sea regions defined by UCSC genome browser annotations [27] [11].
- Metric Calculation: Compute coefficient of variation of coverage across GC bins. Lower values indicate more uniform coverage [11].
EPIC Array Protocol:
- Hybridization Quality Control: Assess fluorescence intensity distributions and background signals using minfi package in R [7].
- Detection P-values: Calculate detection p-values for each probe; remove probes with p > 0.01 [7].
- GC-Bias Evaluation: Monitor cross-hybridization potential in GC-rich regions by examining probe performance metrics [3].
Measuring Technical Reproducibility
Principle: Technical reproducibility ensures consistent results across replicate analyses of the same sample.
Standardized Protocol:
- Replicate Design: Process the same biological sample in at least three technical replicates for each method [27] [11].
- Library Preparation: Perform library preparation independently for each replicate following standardized protocols [27].
- Data Generation: Sequence replicates across different lanes or hybridize arrays in different batches to account for technical variability [27].
- Correlation Analysis: Calculate Pearson correlation coefficients between β-values of technical replicates for overlapping CpG sites [11].
- Consistency Metrics: Compute intraclass correlation coefficients (ICC) for methylation values across replicates. Threshold: ICC > 0.85 considered high reproducibility [3].
Essential Research Reagents and Materials
Table 3: Key research reagent solutions for DNA methylation profiling
| Reagent/Kits | Function | Specific Examples | Quality Control Application |
|---|---|---|---|
| DNA Extraction Kits | High-quality DNA isolation | Nanobind Tissue Big DNA Kit (Circulomics), QIAamp DNA Mini Kit (Qiagen) [7] [42] | Ensure DNA integrity (A260/280: 1.7-1.9) for optimal conversion [42] |
| Bisulfite Conversion Kits | Chemical conversion of unmethylated C to U | EZ DNA Methylation Kit (Zymo Research) [7] | Conversion efficiency monitoring via spike-in controls [7] |
| Enzymatic Conversion Kits | Enzymatic conversion preserving DNA integrity | NEBNext Enzymatic Methyl-seq Kit (New England Biolabs) [3] [42] | Assess DNA fragmentation levels and conversion uniformity [3] |
| Methylation Arrays | Targeted methylation profiling | Infinium MethylationEPIC v1.0 BeadChip (Illumina) [7] | Standardized quality metrics via control probes [7] |
| Control DNAs | Conversion efficiency standards | Unmethylated phage lambda DNA, CpG-methylated pUC19 [3] [42] | Essential for quantifying conversion efficiency [3] |
| Library Prep Kits | Sequencing library construction | SureSelectXT Methyl-Seq (Agilent) [27] | Library complexity assessment via duplication rates [27] |
| Quality Control Instruments | DNA and library QC | Agilent 4200 TapeStation, Qubit Fluorometer [42] | Quantification and size distribution analysis [42] |
Interpretation Guidelines and Best Practices
Data Quality Thresholds
Establishing rigorous quality thresholds is essential for reliable methylation data:
Conversion Efficiency: Require >99.5% for EM-seq and >99% for WGBS/EPIC based on spike-in controls. Samples failing these thresholds should be carefully reviewed for potential false positives [7] [3].
Coverage Uniformity: For sequencing-based methods, expect more uniform coverage across GC gradients with EM-seq (10-40× mode) compared to WGBS (8-12× mode) [11]. For arrays, ensure >95% of probes pass detection p-value threshold of 0.01 [7].
Reproducibility: Technical replicates should demonstrate Pearson correlation >0.9 for sequencing methods and >0.95 for arrays. Intraclass correlation coefficients should exceed 0.85 for all platforms [3] [11].
Platform Selection Guidelines
The optimal platform depends on research priorities:
Choose WGBS when: Working with established protocols, budget constraints prioritize reagent costs over sample input, and comprehensive genome coverage is needed with acceptance of GC-rich region limitations [7] [11].
Select EPIC arrays when: Processing large sample sizes (>100 samples), standardized analysis pipelines are preferred, targeted coverage of predefined regulatory regions is sufficient, and sample input is not limiting [7] [27].
Opt for EM-seq when: Analyzing precious samples with limited DNA input (1-10ng), investigating GC-rich regions like CpG islands, minimizing technical biases is prioritized, and higher reagent costs are acceptable [3] [11].
Conversion efficiency, coverage uniformity, and technical reproducibility form the foundation of quality control in DNA methylation profiling. WGBS provides comprehensive coverage but suffers from GC bias and DNA degradation. EPIC arrays offer cost-effective population-scale analysis but lack whole-genome coverage. EM-seq emerges as a robust alternative with superior performance in GC-rich regions and low-input scenarios. By implementing the standardized protocols and quality thresholds outlined in this guide, researchers can ensure data reliability and select the most appropriate platform for their specific research context.
This guide provides a systematic comparison of three prevalent DNA methylation analysis techniques—Whole-Genome Bisulfite Sequencing (WGBS), Illumina MethylationEPIC (EPIC) Array, and Enzymatic Methyl-seq (EM-seq)—to help researchers troubleshoot common issues related to library yield, amplification bias, and array hybridization.
Methodological Principles and Workflows
Understanding the fundamental principles of each method is crucial for effective troubleshooting, as the core chemistry directly impacts the common problems encountered.
Whole-Genome Bisulfite Sequencing (WGBS)
WGBS relies on sodium bisulfite conversion, a chemical process that deaminates unmethylated cytosines to uracils, while methylated cytosines remain unchanged [8]. Following conversion, sequencing library preparation (pre- or post-bisulfite adapter tagging) and next-generation sequencing (NGS) are performed. The methylation status is then determined by comparing the sequencing data to a reference genome; cytosines that read as thymines indicate unconverted (unmethylated) bases, while those that remain as cytosines are methylated [32].
Illumina MethylationEPIC (EPIC) Array
The EPIC array is a microarray-based platform that uses probe hybridization to assess the methylation status of pre-defined genomic locations. DNA is first treated with bisulfite, then applied to the array where it hybridizes to probes designed for specific CpG sites. Fluorescent signals detect the relative abundance of methylated and unmethylated alleles at nearly 935,000 CpG sites, primarily located in gene promoters, coding regions, and enhancer elements [7] [3].
Enzymatic Methyl-seq (EM-seq)
EM-seq utilizes an enzymatic conversion system as an alternative to harsh bisulfite chemistry. The method employs two key enzymatic steps:
- TET2 enzyme oxidizes 5-methylcytosine (5mC) and 5-hydroxymethylcytosine (5hmC) to derivatives, protecting them from subsequent deamination [7] [8].
- APOBEC enzyme deaminates unmethylated cytosines to uracils [7] [8]. The resulting DNA is then prepared for NGS, where the methylation status is called similarly to WGBS, but with less DNA damage [3].
The following diagram illustrates the core workflow and critical differences in the initial steps of each method:
Performance Comparison and Experimental Data
Systematic comparisons using human biological samples reveal distinct performance characteristics, strengths, and limitations for each method [7] [11].
Key Performance Metrics
Table 1: Comparative performance of WGBS, EPIC array, and EM-seq across key metrics.
| Metric | WGBS | EPIC Array | EM-seq |
|---|---|---|---|
| Resolution | Single-base [8] | Single-base (at predefined sites) [7] | Single-base [3] |
| Genomic Coverage | ~28 million CpGs (≈80-95% of genome) [7] [27] [11] | ~935,000 CpGs (targeted) [7] [3] | Comparable to WGBS, often higher in GC-rich regions [7] [11] |
| DNA Input Requirement | High (µg level recommended) [8] [3] | Moderate (500 ng used in studies) [7] | Low (as low as 10 ng) [8] [3] |
| CpG Detection in GC-rich Regions | Reduced coverage due to DNA fragmentation and bias [11] | Probe cross-hybridization can lead to overestimation [3] | Superior, more uniform and unbiased coverage [3] [11] |
| Library Yield Issues | Significant DNA loss from bisulfite degradation [8] [32] | Not applicable (direct hybridization) | Higher and more consistent yields due to gentle enzymatic treatment [8] [3] |
| Amplification Bias | High, due to bisulfite-induced fragmentation and GC-content variation [8] [49] | Not a major factor (non-PCR based) | Lower, more uniform coverage and fewer duplicates [8] [3] |
| Methylation Concordance | Gold standard, but can overestimate due to incomplete conversion [7] | High correlation with sequencing methods for shared CpGs [7] [27] | Very high concordance with WGBS (R >0.89), reliable quantification [7] [3] |
Coverage and Bias Assessment
Quantitative data from comparative studies highlight critical differences in how each method handles genomic regions with varying GC content.
Table 2: Quantitative comparison of coverage and bias from experimental studies. WGBS data is used as the baseline for comparison where applicable.
| Assessment Parameter | WGBS | EPIC Array | EM-seq |
|---|---|---|---|
| CpG Sites Detected | ~28.2 million (full genome potential) [11] | ~846,464 - 935,000 per sample (targeted) [7] [27] | Often higher than WGBS; ~32% more sites detected in low-input Arabidopsis study [3] |
| Coverage Uniformity (GC-rich regions) | Poor; coverage drops significantly [11] | Variable; subject to probe design and hybridization issues [3] | Excellent; more consistent and less prone to GC bias [3] [11] |
| DNA Degradation & Duplication | High fragmentation; TruSeq showed ~8.4% adaptor read-through and higher PCR duplicates [49] | Not applicable | Minimal fragmentation; lower duplication rates and higher library complexity [8] [3] |
Troubleshooting Common Issues
Low Library Yield
WGBS:
- Primary Cause: Extensive DNA degradation during harsh bisulfite treatment (high temperature, strong alkaline conditions), leading to strand breaks and loss of amplifiable fragments [7] [32].
- Solutions:
- Use post-bisulfite adapter tagging (PBAT) methods to minimize handling of fragmented DNA [32].
- Increase starting DNA input to compensate for expected losses (often impractical for precious samples) [8].
- Optimize bisulfite conversion protocols, though milder conditions risk incomplete conversion [7].
EM-seq:
- Primary Cause: Typically related to specific reagent or protocol failures rather than inherent DNA damage. Potential causes include inefficient enzymatic reactions (oxidation or deamination), sample loss during bead cleanups, or EDTA contamination inhibiting the TET2 reaction [50].
- Solutions:
- Ensure DNA is eluted in nuclease-free water or recommended buffer to avoid EDTA carryover [50].
- Verify reagent quality and pipetting accuracy, particularly for the Fe(II) solution which must be fresh and correctly diluted [50].
- Avoid bead overdrying during cleanups and ensure thorough mixing after adding master mixes [50].
EPIC Array:
- This issue is not relevant to the EPIC array as it does not involve a sequencing library construction step.
Amplification Bias
WGBS:
- Primary Cause: Bisulfite treatment disproportionately fragments and depletes DNA in unmethylated, cytosine-rich regions. This creates an unbalanced library where GC-rich and heavily methylated regions are over-represented after PCR amplification [8] [32]. Studies show specific kits like TruSeq can suffer from high PCR duplicate rates [49].
- Solutions:
- Use amplification-free methods like PBAT where feasible [32].
- Employ library prep kits designed for lower bias, such as Swift Accel-NGS, which demonstrated superior coverage and lower duplication in comparisons [49].
- Increase sequencing depth to compensate for uneven coverage, though this increases cost.
EM-seq:
- Primary Cause: The enzymatic conversion is gentler, causing less DNA damage and resulting in libraries with more uniform coverage and lower duplication rates [8] [3]. Amplification bias is inherently minimized.
- Solutions:
- Follow optimized protocols to maintain high library complexity. The primary focus should be on achieving high oxidation and deamination efficiency to ensure data quality rather than mitigating severe bias [50].
EPIC Array:
- This issue is not a major concern for the EPIC array, as it is a direct hybridization assay that does not require PCR amplification for signal detection [7].
Array Hybridization Issues
EPIC Array:
- Primary Cause: Cross-hybridization occurs when bisulfite-converted DNA fragments bind non-specifically to probes with similar sequences, leading to inaccurate methylation quantification. This is particularly problematic in GC-rich regions and repetitive elements [3]. Incomplete bisulfite conversion can also cause false positive methylation calls [7].
- Solutions:
- Ensure complete and high-quality bisulfite conversion of the DNA sample.
- Be aware that methylation values (beta values) at the extremes (close to 0 or 1) may be less reliable [3].
- Recognize the platform's limitation to predefined sites and its potential inability to detect methylation events outside these regions.
WGBS & EM-seq:
- These issues are not applicable to sequencing-based methods, as they do not rely on probe hybridization for methylation calling.
The Scientist's Toolkit: Essential Research Reagents
The following reagents are critical for the success of the respective methods, and their quality directly impacts the issues discussed above.
Table 3: Key research reagents and their functions in DNA methylation profiling.
| Reagent / Kit | Function | Method |
|---|---|---|
| Sodium Bisulfite | Chemical deamination of unmethylated cytosine to uracil. | WGBS, EPIC Array |
| TET2 Enzyme | Oxidizes 5mC and 5hmC to protect them from deamination. | EM-seq |
| APOBEC Enzyme | Deaminates unmethylated cytosine to uracil. | EM-seq |
| Infinium MethylationEPIC BeadChip | Microarray with probes for targeted hybridization to ~935,000 CpG sites. | EPIC Array |
| Methylated Adapters | Allows for ligation and sequencing of bisulfite-converted DNA without losing methylation information. | WGBS |
| Fe(II) Solution | Cofactor essential for the TET2 enzymatic oxidation reaction. | EM-seq |
| NEBNext EM-seq Kit | Commercial kit providing optimized reagents for the entire enzymatic conversion workflow. | EM-seq |
Protocol for Comparative Studies (as per search results)
The experimental data cited in this guide often comes from studies that directly compare multiple methods on the same biological samples to ensure fairness [7] [11]. A typical protocol involves:
- Sample Selection: Using DNA extracted from multiple sources (e.g., human whole blood, cell lines, fresh-frozen tissue) [7].
- Parallel Processing: Dividing each DNA sample for parallel library preparation or processing with WGBS, EM-seq, and the EPIC array.
- Sequencing & Analysis: Sequencing WGBS and EM-seq libraries on Illumina platforms (e.g., NovaSeq) and processing EPIC arrays according to manufacturer specifications [7].
- Data Comparison: Mapping reads, calling methylation levels, and comparing metrics like coverage, reproducibility, and methylation concordance at overlapping CpG sites [7] [11].
Decision Framework for Method Selection
The following flowchart provides a logical pathway for selecting the most appropriate methylation profiling method based on research priorities and sample constraints:
Head-to-Head Comparisons and Validation Frameworks for Confident Data Interpretation
The accurate quantification of DNA methylation is fundamental to advancing our understanding of epigenetic regulation in development and disease. While whole-genome bisulfite sequencing (WGBS) has long been the gold standard, alternative methods like the Illumina MethylationEPIC (EPIC) microarray and Enzymatic Methyl-seq (EM-seq) have emerged, each with distinct technical advantages and limitations. This systematic review synthesizes evidence from recent cross-method validation studies to evaluate the concordance and divergence between WGBS, EPIC, and EM-seq. We find that while all methods show strong correlation in standard contexts, each possesses unique strengths: EM-seq demonstrates superior performance in GC-rich regions and with low-input DNA, the EPIC array offers cost-effectiveness for large cohort studies, and WGBS remains the most comprehensive reference. Furthermore, emerging machine learning frameworks are successfully bridging data from these diverse platforms, enabling robust cross-platform classification. This guide provides researchers and drug development professionals with a data-driven foundation for selecting and deploying these critical epigenetic tools.
DNA methylation, the addition of a methyl group to cytosine, is a key epigenetic mechanism that regulates gene expression without altering the underlying DNA sequence. Its role in cellular differentiation, genomic imprinting, and the pathogenesis of diseases like cancer has made its accurate quantification a priority in molecular research [1] [51]. The choice of profiling method profoundly impacts the scope, resolution, and biological validity of the resulting data.
For years, the field has relied on two primary technologies: Whole-genome bisulfite sequencing (WGBS), which provides single-base resolution methylation status for nearly every CpG site in the genome, and the Illumina MethylationEPIC (EPIC) BeadChip, a microarray that interrogates over 935,000 pre-defined CpG sites at a lower cost [1] [52]. The defining step for both is bisulfite conversion, a harsh chemical treatment that deaminates unmethylated cytosines to uracils but causes significant DNA fragmentation and degradation [1] [8].
Recently, Enzymatic Methyl-seq (EM-seq) has emerged as a compelling alternative. It uses a series of enzymes to achieve the same base conversion as bisulfite treatment but under milder conditions that better preserve DNA integrity [8] [3]. This review systematically examines cross-validation studies to dissect the technical performance, data concordance, and practical applications of WGBS, EPIC, and EM-seq, providing a framework for informed methodological selection in epigenetic research.
Technical Principles and Methodological Workflows
A fundamental understanding of each method's biochemical principles is necessary to interpret their comparative performance.
Whole-Genome Bisulfite Sequencing (WGBS)
The WGBS workflow begins with fragmenting genomic DNA, followed by bisulfite conversion. This treatment involves incubating DNA with sodium bisulfite under high temperature and acidic conditions, which deaminates unmethylated cytosines (C) to uracils (U). During subsequent PCR amplification and sequencing, uracils are read as thymines (T), while methylated cytosines (5mC) are resistant to conversion and are still read as cytosines [8]. The primary limitation is that bisulfite treatment introduces single-strand breaks and substantial DNA fragmentation, leading to DNA loss and requiring high input amounts (typically µg level for mammalian genomes) [1] [8]. Furthermore, incomplete conversion of unmethylated Cs can lead to false-positive methylation calls.
Illumina MethylationEPIC (EPIC) Microarray
The EPIC array is a hybridization-based platform that uses probe binding to assess predefined sites. DNA is first bisulfite-converted. The converted DNA is then whole-genome amplified, fragmented, and hybridized to array probes designed for specific genomic loci. The methylation status is determined by comparing the signal intensity from probes designed to bind to the methylated (C) versus unmethylated (T) state [1]. The key advantage is its low cost and simplicity for processing large sample sets. Its major limitation is that it is restricted to a fixed set of ~935,000 CpG sites, primarily in promoters, enhancers, and CpG islands, offering no data on the vast majority of CpGs in the genome [1] [52].
Enzymatic Methyl-Sequencing (EM-seq)
EM-seq replaces harsh bisulfite chemistry with a two-step enzymatic reaction. First, the TET2 enzyme oxidizes 5-methylcytosine (5mC) and 5-hydroxymethylcytosine (5hmC) to 5-carboxylcytosine (5caC). Second, the APOBEC enzyme family deaminates unmodified cytosines to uracils, while the oxidized derivatives of 5mC and 5hmC are protected from deamination [1] [8]. As in WGBS, uracils are read as thymines during sequencing. This enzymatic process is gentler, resulting in significantly less DNA degradation and fragmentation. This allows for lower DNA input (as low as 10 ng) and more uniform genome coverage, particularly in GC-rich regions like CpG islands that are challenging for bisulfite-based methods [8] [3].
The following diagram illustrates the core biochemical conversion principles that differentiate these methods.
Systematic Comparison of Performance Metrics
Direct comparative studies reveal how these technologies perform across critical parameters such as resolution, coverage, input requirements, and cost.
Table 1: Key Feature Comparison of WGBS, EPIC, and EM-seq
| Feature | WGBS | EPIC Array | EM-seq |
|---|---|---|---|
| Principle | Bisulfite conversion & sequencing [8] | Bisulfite conversion & probe hybridization [1] | Enzymatic conversion & sequencing [8] |
| Resolution | Single-base [1] [8] | Single-base (at predefined sites) [1] | Single-base [8] [3] |
| Genomic Coverage | ~80-95% of CpGs (unbiased) [1] [49] | ~935,000 predefined CpG sites [1] [52] | Nearly whole-genome, comparable to WGBS [8] [3] |
| DNA Input | High (µg level) [8] | Moderate (~500 ng) [1] | Low (ng level, down to 10 ng) [8] [3] |
| DNA Degradation | Extensive fragmentation [1] [8] | Extensive fragmentation [1] | Minimal fragmentation [8] [3] |
| CpG Island Bias | Under-representation due to GC-bias [8] | Probe-dependent, potential cross-hybridization [3] | More uniform coverage [8] [3] |
| Cost | High [1] [53] | Low [1] | High (reagents); potentially offset by lower input [8] |
Quantitative data from benchmarking studies allows for a more granular performance comparison.
Table 2: Quantitative Performance Metrics from Cross-Validation Studies
| Metric | WGBS | EPIC Array | EM-seq | Notes |
|---|---|---|---|---|
| CpG Detection Sensitivity | Gold standard; detects ~32% more sites than WGBS at low input in A. thaliana [3] | Limited to designed probe set | Higher than WGBS at low input; detects 32% more sites in A. thaliana at 10 ng input [3] | EM-seq's advantage is most pronounced with limited DNA material. |
| Correlation with WGBS (Pearson's R) | 1 (Reference) | High concordance reported [1] | R = 0.89 in high-input DNA samples [3] | EM-seq shows high concordance with WGBS, indicating strong reliability [1]. |
| Technical Reproducibility (ICC) | Decreases significantly with input <50 ng [3] | High for standardized workflow | Maintains high ICC even at low input [3] | EM-seq offers more stable detection performance with precious samples. |
| Coverage Uniformity | Good, but with GC-bias | N/A (fixed probes) | Superior in GC-rich regions [8] [3] | EM-seq's enzymatic treatment avoids the biases of harsh bisulfite chemistry. |
| Library Complexity / Duplication Rate | Varies by kit; TruSeq suffers from high PCR duplicates [49] | N/A | Lower library repetition rate (<10%) vs. PBAT at 10 ng input [3] | Higher complexity in EM-seq provides more efficient sequencing. |
Experimental Protocols in Benchmarking Studies
To ensure the validity of the comparisons summarized in the tables above, integrated benchmarking studies follow rigorous experimental designs. A typical protocol for a cross-method validation study involves:
- Sample Selection and DNA Extraction: The same DNA samples from diverse sources (e.g., human tissue, cell lines, and whole blood) are used for all compared methods. DNA is extracted using standard kits, and its purity and quantity are rigorously assessed (e.g., via NanoDrop and Qubit fluorometer) [1].
- Parallel Library Preparation and Sequencing:
- WGBS: High-molecular-weight DNA (e.g., 1 µg) is fragmented and subjected to bisulfite conversion using a kit like the EZ DNA Methylation Kit (Zymo Research). Libraries are prepared with kits such as Swift Accel-NGS, Illumina TruSeq, or QIAseq QIAseq, and sequenced on Illumina platforms [1] [49].
- EPIC Array: DNA (500 ng) is bisulfite-converted with the same EZ DNA Methylation Kit and hybridized to the Infinium MethylationEPIC BeadChip following the manufacturer's protocol [1].
- EM-seq: DNA (e.g., as low as 10 ng) is used with the EM-seq kit, which involves sequential enzymatic reactions with TET2 and APOBEC, followed by library preparation and sequencing on Illumina platforms [8] [3].
- Data Processing and Analysis:
- Sequencing Data (WGBS/EM-seq): Reads are aligned to a bisulfite-converted reference genome. Methylation levels at each CpG are calculated as the percentage of reads reporting a C versus a T. Tools like Bismark are commonly used.
- Microarray Data (EPIC): Raw intensity data is processed using packages like
minfiin R, normalized (e.g., with BMIQ), and methylation β-values are calculated [1].
- Cross-Platform Validation: Methylation levels are compared at overlapping CpG sites. Correlation coefficients (Pearson/Spearman) are calculated, and concordance is assessed via scatter plots and Bland-Altman analysis. Differential methylation analysis and coverage in specific genomic contexts (e.g., CpG islands, gene bodies) are systematically evaluated [1] [3].
The Scientist's Toolkit: Essential Research Reagents and Materials
The following table details key reagents and kits cited in the foundational studies discussed in this review.
Table 3: Key Research Reagent Solutions for DNA Methylation Profiling
| Product Name | Primary Function | Key Features & Applications |
|---|---|---|
| Zymo Research EZ DNA Methylation Kit | Bisulfite conversion of DNA for WGBS and EPIC array [1]. | Standardized protocol for efficient C-to-U conversion; used in both sequencing and array applications. |
| Illumina TruSeq DNA Methylation Kit | Library preparation for WGBS [49]. | Low DNA input requirement; compared against other kits in performance studies. |
| Swift Accel-NGS Methyl-Seq DNA Library Kit | Library preparation for WGBS [49]. | Achieved highest proportion of CpG sites assayed and effective coverage in comparative study. |
| EM-seq Kit (New England Biolabs) | Enzymatic conversion and library preparation for EM-seq [8]. | Uses TET2 and APOBEC enzymes for gentle conversion; ideal for low-input and degraded samples. |
| Infinium MethylationEPIC v1.0 BeadChip | Microarray for genome-wide methylation profiling [1]. | Interrogates >850,000 CpG sites; standard for high-throughput, cost-effective cohort studies. |
| DNeasy Blood & Tissue Kit (Qiagen) | DNA extraction from cell lines and tissues [1]. | Provides high-quality, pure DNA essential for all downstream methylation analyses. |
| Nanobind Tissue Big DNA Kit (Circulomics) | Extraction of high-molecular-weight DNA from tissues [1]. | Optimal for WGBS where DNA integrity is a critical factor for library preparation. |
Analysis of Concordance and Divergence in Methylation Calling
Synthesizing evidence from multiple studies reveals clear patterns of agreement and unique profiles for each method.
High Overall Concordance but Method-Specific Strengths: Studies consistently report a high correlation (e.g., R = 0.89) between EM-seq and WGBS in CpG methylation calling, confirming EM-seq as a robust and reliable alternative [1] [3]. Despite this overall agreement, each method detects a subset of unique CpG sites, underscoring their complementary nature. EM-seq excels in capturing methylation information in GC-rich regions and with low-input DNA, while WGBS provides the most unbiased genome-wide map, and the EPIC array offers a cost-effective snapshot of biologically relevant regions [1] [8] [3].
The Impact of DNA Input and Quality: The divergence between methods becomes most apparent when DNA quantity or quality is suboptimal. In a study on Arabidopsis thaliana, EM-seq detected 32% more methylation sites than WGBS at a low input of 10 ng. Furthermore, the technical reproducibility of WGBS decreased significantly (CV value increased by 45%) with inputs below 50 ng, whereas EM-seq maintained stable performance [3]. This makes EM-seq the superior choice for precious clinical samples, liquid biopsies (e.g., ctDNA), and ancient DNA [8].
Cross-Platform Integration via Machine Learning: The inherent differences in data structure and coverage between these methods are no longer an insurmountable barrier. Novel machine learning frameworks, such as the crossNN neural network model, can now accurately classify tumors using sparse methylomes from different platforms (WGBS, EPIC, EM-seq, nanopore, targeted sequencing) by treating missing CpG sites as a technical feature rather than a flaw [53]. Another study demonstrated a random forest model that integrated WGBS, EPIC, and EM-seq data to predict tissue and disease origin from cell-free DNA with high accuracy [54]. This demonstrates that with appropriate bioinformatic tools, data from these diverse platforms can be harmonized for powerful, integrated analysis.
The following chart visualizes the decision-making process for selecting the most appropriate methylation profiling method based on common research goals.
The systematic comparison of WGBS, EPIC, and EM-seq reveals a nuanced landscape where no single method is universally superior. Instead, the optimal choice is dictated by the specific research question, sample characteristics, and budgetary constraints. WGBS remains the comprehensive gold standard for discovery-phase projects where cost and input DNA are not limiting factors. The EPIC array is unparalleled for large-scale epidemiological studies requiring cost-effective profiling of well-annotated genomic regions. EM-seq emerges as the technology of choice for challenging sample types, including low-input, degraded, or GC-rich DNA, offering robust performance and excellent concordance with WGBS.
Critically, the field is moving beyond siloed platform comparisons. The development of sophisticated machine learning models capable of integrating sparse data from these diverse technologies heralds a new era of cross-platform epigenomics. This allows researchers to leverage the unique strengths of each method, combine datasets from different studies, and build more powerful diagnostic and prognostic models. As these tools continue to mature, the focus will shift from methodological competition to strategic integration, accelerating the translation of DNA methylation research into clinical practice.
DNA methylation analysis is a cornerstone of epigenetic research, with critical applications in understanding disease mechanisms, discovering biomarkers, and guiding clinical diagnostics [55]. The choice of profiling technology significantly impacts the reliability and biological relevance of the data obtained, especially when working with diverse clinical samples such as cell-free DNA (cfDNA), tissues, and cell lines. While whole-genome bisulfite sequencing (WGBS) has long been the gold standard for base-resolution methylome analysis, and Illumina's EPIC microarray has offered a cost-effective alternative for large studies, both methods have notable limitations, including DNA degradation from harsh bisulfite treatment and restricted coverage to predefined sites [7] [56].
Enzymatic Methyl-Sequencing (EM-seq) has emerged as a powerful alternative that addresses several of these shortcomings by utilizing a gentle enzymatic conversion process, thereby preserving DNA integrity [7] [56]. This technical comparison guide provides an objective performance benchmark of WGBS, EPIC array, and EM-seq across various clinical sample types. By synthesizing data from recent, independent studies, we aim to offer researchers, scientists, and drug development professionals a clear, evidence-based framework for selecting the most appropriate methodology for their specific research context and sample types.
Core Technology and Experimental Protocols
A fundamental understanding of the underlying biochemistry and standard protocols for each method is crucial for interpreting performance data.
Whole-Genome Bisulfite Sequencing (WGBS)
Experimental Protocol: The foundational step in WGBS involves treating DNA with sodium bisulfite, which deaminates unmethylated cytosines to uracils, while methylated cytosines remain unchanged [56]. Following conversion, the DNA is sequenced, and the resulting sequences are compared to a reference genome to determine methylation status at each cytosine position. A typical protocol involves:
- DNA Fragmentation: Via sonication or enzymatic digestion.
- Bisulfite Conversion: Using commercial kits (e.g., EZ DNA Methylation Kit from Zymo Research). This step involves incubation under high temperature and acidic pH, leading to significant DNA degradation [7] [5].
- Library Preparation: Building sequencing libraries from the converted DNA, often requiring amplification.
- High-Throughput Sequencing: On platforms like Illumina, requiring deep sequencing (often 30x genome coverage or more) for comprehensive analysis [56].
Illumina MethylationEPIC (EPIC) Array
Experimental Protocol: The EPIC array also relies on bisulfite conversion but uses hybridization to pre-designed probes rather than sequencing. The current EPICv2 BeadChip interrogates over 930,000 predefined CpG sites [5]. A standard workflow includes:
- Bisulfite Conversion: As described for WGBS [5].
- Whole-Genome Amplification: Of the converted DNA.
- Fragmentation, Precipitation, and Resuspension.
- Hybridization: To the BeadChip array.
- Single-Base Extension and Staining: Fluorescently labeled nucleotides are incorporated.
- Imaging and Analysis: The fluorescence intensity is measured, and beta-values (ratio of methylated to total signal intensity) are calculated for each CpG site [7].
Enzymatic Methyl-Sequencing (EM-seq)
Experimental Protocol: EM-seq replaces harsh chemical conversion with a series of enzymatic reactions to distinguish methylated from unmethylated cytosines [7] [56].
- DNA Input: Can handle lower DNA inputs compared to WGBS [7].
- Enzymatic Conversion: This two-step process is key:
- TET2 and T4-BGT Treatment: The TET2 enzyme oxidizes 5-methylcytosine (5mC) and 5-hydroxymethylcytosine (5hmC) to 5-carboxylcytosine (5caC) and other derivatives. Concurrently, T4-β-glucosyltransferase (T4-BGT) glucosylates 5hmC, protecting it from further oxidation and enabling potential distinction from 5mC [7].
- APOBEC Deamination: The APOBEC enzyme selectively deaminates unmodified cytosines to uracils, while all oxidized and glucosylated derivatives are protected [7].
- Library Preparation and Sequencing: The converted DNA undergoes standard library prep and sequencing on Illumina or other NGS platforms. This enzymatic process preserves DNA integrity, resulting in longer fragment sizes and reduced sequencing bias.
The following diagram illustrates the core procedural workflows for these three key methods.
Performance Benchmarking in Clinical Samples
Recent comparative studies have evaluated these technologies head-to-head using human-derived samples, providing a robust dataset for benchmarking.
Concordance and Coverage
A comprehensive 2025 study analyzing human tissue, cell lines, and whole blood found that EM-seq showed the highest concordance with WGBS, confirming its reliability due to similar sequencing chemistry [7]. However, each method captured unique CpG sites, underscoring their complementary nature. Oxford Nanopore Technologies (ONT), while showing lower agreement with the other methods, uniquely enabled methylation detection in challenging genomic regions like repetitive elements [7].
Table 1: Performance Comparison Across Key Metrics
| Metric | WGBS | EPIC Array | EM-seq |
|---|---|---|---|
| Resolution | Single-base [56] | Single-base (at predefined sites) [56] | Single-base [7] |
| Theoretical CpG Coverage | ~28 million sites (near-complete) [56] | ~930,000 predefined sites [5] | Near-complete, comparable to WGBS [7] |
| Effective Coverage | ~80% of CpGs [7] | Limited to probe design | High and more uniform than WGBS [7] |
| DNA Integrity | High degradation due to bisulfite treatment [7] | Degradation due to bisulfite treatment [7] | High; gentle enzymatic treatment preserves DNA [7] [56] |
| 5mC/5hmC Discrimination | No (conflates 5mC and 5hmC) | No (conflates 5mC and 5hmC) | Yes, with modified protocol [7] |
| Concordance with WGBS | (Gold Standard) | High at overlapping sites [5] | Highest [7] |
Sample-Type Specific Performance
The suitability of a method can vary significantly depending on the sample source.
- Cell Lines and Tissues (High-Quality DNA): For samples with abundant, high-quality DNA, all three methods perform robustly. WGBS and EM-seq provide the most comprehensive data. A study on ovarian cancer tissues found strong sample-wise correlation between EPIC array and targeted bisulfite sequencing, indicating that for defined target sets, the data are highly reproducible across platforms [5].
- Cell-Free DNA (cfDNA) and Challenging Samples: The integrity of input DNA becomes paramount when working with fragmented or low-input samples like cfDNA. Here, EM-seq's gentle enzymatic process offers a distinct advantage by minimizing further degradation and producing larger sequencing-competent fragments, which improves coverage and library complexity [7] [56]. While the EPIC array is still widely used for cfDNA studies, its reliance on bisulfite conversion can be a limiting factor with degraded samples [55]. WGBS requires deep sequencing, which can be prohibitively expensive and inefficient for fragmented cfDNA.
Table 2: Suitability for Different Clinical Sample Types
| Sample Type | Recommended Method | Key Considerations |
|---|---|---|
| Cell Lines & Tissues (High-Quality DNA) | EM-seq or WGBS | EM-seq preferred for superior DNA preservation and uniform coverage. WGBS is a established alternative. EPIC array is cost-effective for large cohort studies if coverage is sufficient. |
| FFPE Tissues | EM-seq | The enzymatic protocol is more robust for dealing with cross-linked and fragmented DNA compared to bisulfite-dependent methods [56]. |
| Cell-Free DNA (cfDNA) | EM-seq | Superior for fragmented, low-input samples due to gentle conversion preserving already-short DNA molecules [7] [56] [55]. |
| Large Epidemiological Cohorts | EPIC Array | Unmatched cost-effectiveness and throughput for profiling hundreds of thousands of predefined CpGs across thousands of samples [56] [57]. |
Practical Implementation and Analytical Considerations
Beyond core performance, practical aspects like cost, time, and data analysis are critical for method selection.
Cost, Time, and Data Analysis
WGBS is the most resource-intensive method, requiring high sequencing depth and sophisticated bioinformatic pipelines for alignment and methylation calling. Benchmarking studies have shown that the choice of alignment algorithm (e.g., BSMAP, Bismark, Bwa-meth) can significantly impact the accuracy of methylome data, including the calling of differentially methylated regions [58].
EPIC Array is the most cost-effective for large studies, with a streamlined, standardized workflow from wet lab to data analysis (e.g., using R packages like minfi), making it accessible to labs without extensive bioinformatics support [7] [56] [5].
EM-seq costs are comparable to WGBS but can be more efficient due to reduced duplication rates from better-preserved DNA. While it still requires NGS data analysis, the resulting data is of high quality and less prone to bisulfite-specific artifacts.
The Scientist's Toolkit: Essential Research Reagents and Materials
The following table details key reagents and kits used in the featured experiments and the broader field.
Table 3: Key Research Reagent Solutions for DNA Methylation Profiling
| Item | Function | Example Products & Kits |
|---|---|---|
| DNA Extraction Kits | Isolate high-quality DNA from various sample matrices. | Nanobind Tissue Big DNA Kit (Circulomics), DNeasy Blood & Tissue Kit (Qiagen), QIAamp DNA Mini Kit (for swabs) [7] [5]. |
| Bisulfite Conversion Kits | Chemically convert unmethylated cytosine to uracil for WGBS and EPIC array. | EZ DNA Methylation Kit (Zymo Research), EpiTect Bisulfite Kit (QIAGEN) [7] [5]. |
| Enzymatic Conversion Kits | Enzymatically convert base states for EM-seq. | EM-seq Kit (e.g., from New England Biolabs) [7]. |
| Methylation Array Kits | Process bisulfite-converted DNA for hybridization to microarrays. | Infinium MethylationEPIC BeadChip Kit (Illumina) [7] [5]. |
| Targeted Sequencing Panels | Enrich for specific CpG loci for cost-effective, deep sequencing. | QIAseq Targeted Methyl Custom Panel (QIAGEN) [5]. |
| Library Prep Kits | Prepare sequencing libraries from converted DNA. | Kits compatible with bisulfite-converted or enzymatically converted DNA (e.g., from Illumina, NEB). |
| Bioinformatics Tools | Align reads, call methylation states, and perform differential analysis. | minfi (for array data) [7] [5], Bismark/BSMAP/Bwa-meth (for WGBS/EM-seq) [58], deconvolution algorithms (e.g., EpiDISH, MethylResolver) [59]. |
The choice between WGBS, EPIC array, and EM-seq is not one-size-fits-all and should be driven by specific experimental goals and sample types.
- The EPIC array remains the platform of choice for large-scale epidemiological studies where cost and throughput are primary concerns, and predefined CpG coverage is sufficient.
- WGBS continues to be a powerful tool for discovering novel methylation patterns across the entire genome when DNA quantity and quality are high.
- EM-seq emerges as the robust successor to WGBS for base-resolution whole methylome studies, particularly superior for precious, fragmented, or low-input clinical samples like cfDNA and FFPE tissues due to its non-destructive enzymatic conversion. Its ability to provide more uniform coverage and the potential to distinguish 5hmC further solidifies its position as a leading technology for the future of methylation research.
For researchers prioritizing data quality and integrity from challenging clinical samples, EM-seq represents the most advanced and reliable method. For large cohort studies focused on established CpG sites, the EPIC array offers an efficient and validated solution. This benchmarking guide provides the necessary evidence to make an informed decision tailored to specific research needs in drug development and clinical science.
In the field of epigenetics, accurate DNA methylation analysis is fundamental for understanding gene regulation, cellular differentiation, and disease mechanisms. The choice of detection method significantly impacts the quality, reliability, and scope of the resulting data. This guide provides an objective comparison of three principal technologies for methylation quantification: Whole-Genome Bisulfite Sequencing (WGBS), the Illumina MethylationEPIC (EPIC) microarray, and Enzymatic Methyl sequencing (EM-seq). Framed within a broader thesis on method selection, we focus on quantitatively assessing the superior library complexity and coverage uniformity of EM-seq, which employs a gentle enzymatic conversion process, against the harsh chemical treatment of WGBS and the targeted design of the EPIC array.
The fundamental difference between these methods lies in their approach to distinguishing methylated cytosines from unmethylated ones.
Whole-Genome Bisulfite Sequencing (WGBS) is the long-standing gold standard. It relies on sodium bisulfite to chemically deaminate unmethylated cytosines to uracils, which are then sequenced as thymines. Methylated cytosines are protected from this conversion and are read as cytosines. However, the required conditions—high temperature, low pH, and long incubation—cause severe DNA fragmentation, depurination, and degradation, leading to biased sequencing libraries and loss of information [7] [60].
Illumina MethylationEPIC (EPIC) Array is a microarray-based technology that interrogates the methylation status of over 935,000 pre-defined CpG sites, primarily located in promoter, enhancer, and gene body regions. Like WGBS, it uses bisulfite-converted DNA but probes specific sites through hybridization. Its main limitations are its restriction to pre-designed sites, inability to discover novel methylation loci, and potential for cross-hybridization artifacts in repetitive regions [7] [5].
Enzymatic Methyl sequencing (EM-seq) represents a next-generation approach that replaces harsh bisulfite chemistry with a series of enzymatic reactions. The process involves two key steps:
- TET2 Oxidation: The TET2 enzyme oxidizes 5-methylcytosine (5mC) and 5-hydroxymethylcytosine (5hmC) to 5-carboxylcytosine (5caC).
- APOBEC Deamination: The APOBEC enzyme deaminates unmodified cytosines to uracils, while the oxidized derivatives (5caC) are protected.
This process achieves the same outcome as bisulfite treatment—converting unmethylated C to T while retaining methylated C—but does so with minimal DNA damage, preserving integrity [60] [61].
The following diagram illustrates this core enzymatic pathway of EM-seq.
Diagram 1: The core enzymatic conversion pathway of EM-seq.
Performance Benchmarking: Quantitative Data Comparison
Independent studies have systematically benchmarked these technologies. The data consistently demonstrate that EM-seq outperforms WGBS in key metrics related to library quality and data uniformity, while providing comprehensive coverage beyond the EPIC array's targeted design.
A 2025 comparative evaluation assessed WGBS, EM-seq, EPIC array, and Oxford Nanopore Technologies (ONT) sequencing across human tissue, cell line, and blood samples. The findings highlighted EM-seq's exceptional performance in preserving DNA integrity and achieving uniform coverage [7].
Table 1: Comparative Performance of WGBS vs. EM-seq from a 2025 Benchmarking Study [7]
| Performance Metric | WGBS | EM-seq | Technical Implication |
|---|---|---|---|
| DNA Integrity | Severe fragmentation due to harsh bisulfite conditions [60] | High integrity; minimal DNA damage [60] | EM-seq preserves longer DNA fragments, enabling more accurate sequencing. |
| GC Coverage Bias | Skewed profile; under-representation of GC-rich regions [60] | Flat, uniform distribution [60] | EM-seq provides unbiased coverage of CpG islands and other GC-rich promoter regions. |
| CpG Detection Efficiency | Lower CpG counts at similar sequencing depth [7] | Higher number of CpGs detected at same depth [7] [60] | EM-seq yields more data per sequencing dollar, reducing costs for genome-wide coverage. |
| Agreement with WGBS | (Gold standard) | Highest concordance [7] | EM-seq reliably reproduces gold-standard results without the associated DNA damage. |
| Unique Captured Regions | Limited access to complex, high-GC regions [7] | Captures unique loci in challenging genomic regions [7] | EM-seq enables methylation profiling in previously inaccessible parts of the genome. |
Further evidence from a 2021 study evaluating library prep protocols on human fallopian tube samples concluded that the "NEBNext Enzymatic Methyl-seq kit appeared to be the best option for whole-genome DNA methylation sequencing of high-quality DNA," noting its superior performance in terms of library complexity and uniformity [62].
The advantages of EM-seq are particularly pronounced with low-input samples, a critical consideration for clinical research involving precious samples like cell-free DNA (cfDNA) or biopsies. A 2022 study directly comparing EM-seq and Post-Bisulfite Adapter Tagging (PBAT) for low-input DNA found that EM-seq libraries demonstrated higher complexity and better sequencing quality [3]. At a 10 ng DNA input, EM-seq produced ~25% more unique sequencing data than PBAT, directly resulting from its non-destructive conversion chemistry [3].
Experimental Protocols for Key Comparisons
To ensure the reproducibility of the comparative data cited, this section outlines the standard methodologies employed in the benchmark studies.
Protocol: Comparative Library Preparation for WGBS and EM-seq
This protocol is adapted from methodologies used in the 2025 and 2021 benchmarking studies [7] [62].
1. Sample Preparation:
- Input: Use high-quality DNA (e.g., from human tissue, cell lines, or blood) extracted via a standardized kit (e.g., DNeasy Blood & Tissue Kit, Qiagen). Assess purity and concentration using a fluorometer.
- Controls: Spike-in unmethylated (e.g., lambda phage) and methylated (e.g., pUC19) control DNA to monitor conversion efficiency.
2. Library Construction (Parallel Tracks):
- EM-seq Track: Use the NEBNext Enzymatic Methyl-seq Kit.
- Fragmentation & End-prep: Fragment DNA and repair ends.
- Adapter Ligation: Ligate Illumina-compatible adapters.
- Enzymatic Conversion: Treat with TET2 and APOBEC3A enzymes per manufacturer's instructions to convert unmodified cytosines.
- PCR Amplification: Amplify the library with a limited number of PCR cycles (e.g., 4-8 cycles).
- WGBS Track: Use a commercial WGBS kit (e.g., KAPA HyperPrep with Zymo EZ DNA Methylation-Gold Kit).
- Adapter Ligation: Ligate methylated adapters to fragmented DNA.
- Bisulfite Conversion: Treat with sodium bisulfite (e.g., using the EZ DNA Methylation-Gold kit) under standard conditions (e.g., 98°C for 8-10 minutes, 64°C for 3.5 hours).
- Desalting & Purification: Purify the converted DNA.
- PCR Amplification: Amplify the library (e.g., 10 cycles).
3. Sequencing & Analysis:
- Sequence all libraries on an Illumina platform (e.g., NovaSeq 6000) to a sufficient depth (e.g., 30x genome coverage).
- Process data through a standardized bioinformatic pipeline for bisulfite-converted reads (e.g., using Bismark for alignment and MethylKit for differential methylation analysis).
- Collect metrics: mapping efficiency, duplicate rate, cytosine conversion efficiency, coverage depth, and CpG coverage uniformity.
Protocol: Assessing Performance with Low-Input DNA
This protocol is based on the 2022 study comparing EM-seq and PBAT [3].
1. Sample Titration:
- Serially dilute human genomic DNA (e.g., NA12878) to inputs of 1 ng, 5 ng, and 10 ng.
2. Library Construction:
- EM-seq: Follow the low-input protocol of the NEBNext Enzymatic Methyl-seq Kit for the titrated inputs.
- PBAT: Perform post-bisulfite adapter tagging. This involves bisulfite conversion of unfragmented DNA first, followed by adapter ligation and PCR amplification.
3. Quality Assessment and Sequencing:
- Evaluate library yield and size distribution using a Bioanalyzer.
- Sequence libraries and analyze data for library complexity (unique read count, duplicate rate), coverage breadth, and methylation calling accuracy at different coverages.
The workflow for this low-input comparison is summarized below.
Diagram 2: Experimental workflow for low-input DNA method comparison.
The Scientist's Toolkit: Essential Research Reagents
Successful execution of these protocols, particularly the emerging EM-seq method, requires specific, high-quality reagents. The following table details key solutions for EM-seq and comparative methodologies.
Table 2: Key Research Reagent Solutions for DNA Methylation Sequencing
| Reagent / Kit Name | Provider | Primary Function | Key Application Note |
|---|---|---|---|
| NEBNext Enzymatic Methyl-seq Kit | New England Biolabs (NEB) | All-in-one library prep and enzymatic conversion for Illumina. | The featured EM-seq solution; optimal for high-quality DNA, providing superior library complexity and uniform coverage [60] [62]. |
| xGen Methyl-Seq DNA Library Prep Kit | IDT | Post-bisulfite library prep using Adaptase technology for low-input WGBS. | An advanced bisulfite-based alternative designed to maximize library complexity from low-input and fragmented samples like cfDNA [63]. |
| EZ DNA Methylation-Gold Kit | Zymo Research | Chemical bisulfite conversion of DNA. | The standard for traditional WGBS and EPIC array sample prep; known for high conversion efficiency but causes DNA degradation [62] [64]. |
| Infinium MethylationEPIC v2 BeadChip | Illumina | Microarray for profiling >935,000 CpG sites. | Ideal for large-scale population studies where cost-effectiveness and standardized analysis are priorities over whole-genome coverage [7] [65]. |
| DNeasy Blood & Tissue Kit | Qiagen | Isolation of high-quality genomic DNA from various sources. | Critical first step for any sequencing method to ensure pure, high-molecular-weight input material [7] [62]. |
| Lambda Phage DNA | Various | Unmethylated control DNA. | Essential spike-in for quantifying the cytosine conversion efficiency in both EM-seq and WGBS protocols [62]. |
The quantitative data and experimental comparisons presented in this guide objectively demonstrate that EM-seq holds distinct technical advantages over WGBS and the EPIC array for whole-genome methylation analysis. Its enzymatic conversion chemistry directly addresses the primary limitation of WGBS—DNA degradation—resulting in libraries with higher complexity, reduced sequencing bias, and more uniform genome coverage, especially in GC-rich regions. While the EPIC array remains a cost-effective tool for profiling predefined sites in large cohorts, it cannot achieve the discovery power of a true whole-genome method.
Therefore, for research applications where data quality, comprehensive genomic coverage, and efficient use of sequencing resources are paramount—such as in novel biomarker discovery, profiling precious low-input clinical samples, or exploring methylation in complex genomic regions—EM-seq emerges as the superior technical choice. It delivers the single-base resolution of the gold standard WGBS while overcoming its most significant drawbacks, establishing a new benchmark for accuracy and efficiency in methylation quantification research.
DNA methylation, a fundamental epigenetic mechanism involving the addition of a methyl group to cytosine bases, plays a critical role in gene regulation, cellular differentiation, and disease pathogenesis without altering the underlying DNA sequence [7] [66]. The accurate and comprehensive assessment of DNA methylation patterns is thus essential for understanding their role in various biological processes and disease mechanisms. While bisulfite sequencing has long been the default method for analyzing methylation marks due to its single-base resolution, the associated DNA degradation poses a significant concern for fragmented samples [7] [67]. Although several methods have been proposed to circumvent this issue, there has been no clear consensus on which method might be better suited for specific study designs, particularly regarding their ability to capture unique versus overlapping CpG sites across the genome [7] [68].
This guide objectively compares three prominent DNA methylation profiling technologies—whole-genome bisulfite sequencing (WGBS), Illumina MethylationEPIC (EPIC) microarray, and enzymatic methyl-sequencing (EM-seq)—focusing on their complementary nature in identifying distinct and shared CpG sites. By examining recent comparative studies and experimental data, we provide researchers with practical insights for selecting appropriate methodologies based on specific research goals, sample availability, and genomic regions of interest.
Fundamental Technological Differences
The three technologies employ distinct approaches for detecting DNA methylation. Whole-genome bisulfite sequencing (WGBS) represents the traditional gold standard, utilizing harsh chemical bisulfite treatment to convert unmethylated cytosines to uracils while methylated cytosines remain unchanged, followed by next-generation sequencing to achieve single-base resolution across virtually the entire genome [7] [3]. However, this process causes substantial DNA fragmentation and degradation, requiring high DNA input (typically 100ng+) and potentially introducing coverage biases, particularly in GC-rich regions [7] [3].
The Illumina MethylationEPIC (EPIC) BeadChip employs a microarray-based approach that interrogates a predefined set of approximately 935,000 CpG sites primarily located in gene promoters, enhancers, and other functionally relevant regions [7] [44] [3]. This technology offers a cost-effective solution for large-scale epigenome-wide association studies (EWAS) but is limited to its fixed content, unable to discover novel methylation sites outside the predetermined panel [7] [44].
Enzymatic methyl-sequencing (EM-seq) has emerged as a robust alternative that replaces harsh chemical treatment with a gentle enzymatic conversion process. Utilizing TET2 and APOBEC enzymes, EM-seq protects methylated cytosines while converting unmethylated cytosines to uracils, thereby preserving DNA integrity and enabling more uniform genome coverage, especially in GC-rich regions and with low-input DNA (as low as 10-25ng) [7] [69] [3].
Experimental Workflows and Technical Procedures
The experimental workflows for each technology differ significantly in their handling of DNA and conversion processes. The following diagram illustrates the key procedural differences:
Diagram 1: Comparative Workflows of DNA Methylation Detection Technologies. WGBS and EPIC array both utilize bisulfite treatment that degrades DNA, while EM-seq employs a gentler enzymatic conversion process that preserves DNA integrity.
Comparative Performance Analysis
Genomic Coverage and CpG Detection
The technologies demonstrate substantial differences in their ability to detect and quantify CpG sites across the genome. Recent comparative evaluations using human samples derived from tissue, cell lines, and whole blood provide quantitative insights into their coverage characteristics [7].
Table 1: Comparative Genomic Coverage of Methylation Profiling Technologies
| Technology | Total CpGs Detectable | Coverage Uniformity | Unique Advantages | Major Limitations |
|---|---|---|---|---|
| WGBS | ~28 million sites (theoretical) [44] | Moderate with GC-bias [3] | Single-base resolution; genome-wide coverage [7] | DNA degradation; high input requirements [7] [3] |
| EPIC Array | ~935,000 predefined sites [7] [3] | Limited to predefined regions [44] | Cost-effective for large cohorts; standardized analysis [7] [48] | Fixed content; no discovery of novel sites [7] [44] |
| EM-seq | Comparable to WGBS [7] | High, especially in GC-rich regions [69] [3] | Preserves DNA integrity; low-input capability [7] [69] | Longer protocol (2-4 days) [3] |
Despite substantial overlap in CpG detection among methods, each technology identifies unique CpG sites, emphasizing their complementary nature [7]. EM-seq shows the highest concordance with WGBS, indicating strong reliability due to their similar sequencing chemistry, while capturing additional sites in challenging genomic regions [7] [69].
Technical Performance Metrics
Direct comparisons of these technologies across multiple performance parameters reveal their respective strengths and limitations for different research scenarios.
Table 2: Technical Performance and Practical Considerations
| Parameter | WGBS | EPIC Array | EM-seq |
|---|---|---|---|
| DNA Input Requirements | High (100ng+) [3] | Moderate (500ng) [7] | Low (10-25ng) [7] [69] |
| Single-Base Resolution | Yes [7] | No (probe-based) [44] | Yes [7] |
| Reproducibility | High for high-input samples [3] | High [44] | High, even for low-input [69] [3] |
| Cost per Sample | High [7] | Low [7] [44] | Moderate [7] |
| Handling of GC-rich Regions | Problematic with biases [3] | Probe cross-hybridization issues [3] | Superior with even coverage [69] [3] |
| Multi-omics Data from Single Run | Limited | No | Yes (methylation, SNVs, CNVs) [69] |
Performance comparisons at low DNA inputs (10-25ng) demonstrate EM-seq's superiority in nearly all metrics, capturing the highest number of CpGs and true single nucleotide variants (SNVs) while maintaining high mapping rates and conversion efficiency [69].
Experimental Evidence: Head-to-Head Comparisons
Concordance Studies Across Platforms
Recent systematic evaluations have quantified the agreement between different methylation profiling technologies. A 2025 comparative study assessing DNA methylation profiles across three human genome samples found that EM-seq showed the highest concordance with WGBS, indicating strong reliability due to their similar sequencing chemistry [7]. Despite this high overall agreement, each method identified unique CpG sites, emphasizing their complementary nature [7].
Another study comparing the EPIC array with targeted next-generation sequencing approaches found an overall high concordance (r = 0.84) between platforms in highly methylated and minimally methylated regions [48]. However, substantial disagreement was present between the two methods in moderately methylated regions, with sequencing measurements exhibiting greater within-site variation [48]. This suggests that the choice of technology can significantly impact results in genomic regions with intermediate methylation levels.
Research comparing methylation capture sequencing (MC-seq) and EPIC arrays in peripheral blood mononuclear cells revealed that among the 472,540 CpG sites captured by both platforms, methylation of most CpG sites was highly correlated in the same sample (r: 0.98-0.99) [44]. However, methylation for a small proportion of CpGs (N = 235) differed significantly between the two platforms, with differences in beta values of greater than 0.5 [44].
Coverage Distribution Across Genomic Features
The technologies demonstrate distinct patterns in their coverage of various genomic features, which contributes to their complementary nature:
Diagram 2: Comparative Coverage of Genomic Features Across Platforms. Each technology exhibits distinct coverage patterns across different genomic features, with EM-seq generally providing more uniform coverage, especially in challenging regions.
MC-seq detects more CpGs in coding regions and CpG islands compared with the EPIC array, demonstrating the advantage of sequencing-based approaches in capturing methylation marks in functionally important regions [44]. EM-seq particularly outperforms WGBS in detecting methylation in GC-rich regions and repetitive elements, areas traditionally challenging for bisulfite-based methods [69] [3].
Research Reagent Solutions and Methodological Considerations
Essential Research Materials and Kits
Successful implementation of DNA methylation profiling requires appropriate selection of research reagents and kits tailored to each technology:
Table 3: Essential Research Reagents and Kits for DNA Methylation Profiling
| Technology | Key Commercial Kits | Primary Function | Critical Considerations |
|---|---|---|---|
| WGBS | EZ DNA Methylation Kit (Zymo Research) [7] | Bisulfite conversion | DNA degradation concerns; requires high input [7] |
| EPIC Array | Infinium MethylationEPIC BeadChip (Illumina) [7] | Microarray hybridization | Fixed content; limited to ~935K predefined CpGs [7] [44] |
| EM-seq | NEBNext Enzymatic Methyl-Seq Kit (New England Biolabs) [69] | Enzymatic conversion | Gentler on DNA; suitable for low-input and degraded samples [7] [69] |
| Bisulfite Conversion Control | EZ DNA Methylation-Gold Kit (Zymo Research) [44] | Quality control | Essential for assessing conversion efficiency [44] |
| Library Preparation | SureSelectXT Methyl-Seq (Agilent) [44] | Target enrichment | For capture-based approaches; reduces sequencing costs [44] |
Methodological Protocols for Comparative Studies
For researchers conducting technology comparisons, the following experimental approaches ensure valid and reproducible results:
Sample Preparation and Quality Control: DNA samples should undergo rigorous quality assessment using spectrophotometry (A260/A280 and A260/230 ratios) and fluorometry for concentration measurement [7] [44]. DNA integrity and fragment size should be confirmed using microfluidic platforms such as the Agilent Bioanalyzer [44]. For method comparisons, utilizing reference materials like HapMap NA12878 enables benchmarking across laboratories and platforms [69].
Platform-Specific Processing Protocols: For WGBS, standard protocols involve DNA shearing to 150-300bp fragments followed by bisulfite conversion using kits such as the EZ DNA Methylation-Gold Kit [69]. For EPIC arrays, 500ng of DNA is typically bisulfite converted using the EZ DNA Methylation Kit followed by whole-genome amplification, enzymatic fragmentation, and hybridization to the BeadChips [7]. For EM-seq, the NEBNext Enzymatic Methyl-Seq protocol involves DNA shearing followed by TET2 oxidation and APOBEC deamination without DNA degradation [69].
Bioinformatic Processing and Normalization: Different bioinformatic pipelines are required for each technology. For sequencing-based methods (WGBS and EM-seq), tools like Bismark, BSMAP, or SAAP-BS are used for alignment and methylation calling [69]. For EPIC array data, the minfi package in R is commonly used for preprocessing, normalization, and beta-value calculation [7] [48]. Cross-platform comparisons require careful mapping of CpG coordinates and statistical reconciliation of different measurement scales (beta-values for arrays, ratios for sequencing) [48] [44].
The comparative analysis of WGBS, EPIC array, and EM-seq technologies reveals their fundamentally complementary nature in DNA methylation profiling. While WGBS remains the gold standard for comprehensive genome-wide methylation analysis, its limitations in DNA degradation and input requirements restrict its utility for precious samples. The EPIC array offers an efficient solution for large-scale epidemiological studies but is constrained by its predetermined content. EM-seq emerges as a robust alternative that preserves DNA integrity while providing coverage comparable to WGBS, particularly excelling in GC-rich regions and low-input scenarios [7] [69].
The selection of an appropriate methylation profiling technology should be guided by specific research objectives, sample characteristics, and resource constraints. For discovery-phase studies requiring comprehensive genome-wide coverage, EM-seq provides optimal balance between data quality and sample preservation. For targeted analysis of well-annotated genomic regions in large cohorts, the EPIC array remains cost-effective. For applications requiring maximum genomic coverage without budget or input limitations, WGBS continues to offer the most complete picture of the methylome.
Future methodological developments will likely focus on integrating the complementary strengths of these technologies, potentially through hybrid approaches that combine targeted arrays with sequencing-based validation. As single-cell methylomics advances, enzymatic approaches like EM-seq are poised to play an increasingly important role in understanding cellular heterogeneity in development and disease.
Conclusion
The choice between WGBS, EPIC array, and EM-seq is not about finding a single superior technology, but about selecting the most appropriate tool for a specific research question and sample context. WGBS remains a comprehensive discovery tool, while the EPIC array excels in cost-effective, high-throughput targeted studies. EM-seq has firmly established itself as a robust, DNA-preserving alternative, particularly superior for low-input and fragmented samples like cfDNA and FFPE. The future of DNA methylation analysis lies in leveraging the complementary strengths of these methods—using WGBS or EM-seq for unbiased discovery and the EPIC array or targeted sequencing for clinical validation across large cohorts. As we move toward liquid biopsy-based diagnostics, methods that maximize data quality from minimal input, such as EM-seq, will be instrumental in translating epigenetic discoveries into clinical practice.
References
- 1. Comparison of current methods for genome-wide DNA ... [https://epigeneticsandchromatin.biomedcentral.com/articles/10.1186/s13072-025-00616-3]
- 2. Accounting for differences between Infinium ... [https://www.life-science-alliance.org/content/8/9/e202403155]
- 3. Practical Case Studies for Comparison Between EM-seq ... [https://www.cd-genomics.com/resource-em-seq-comparison-wgbs-pbat-case.html]
- 4. Ultra-mild bisulfite outperforms existing methods for 5- ... [https://www.nature.com/articles/s41467-025-66033-y]
- 5. Comparative Performance of Methylation Array and ... [https://pmc.ncbi.nlm.nih.gov/articles/PMC12589796/]
- 6. PMC - PubMed Central [https://pmc.ncbi.nlm.nih.gov/articles/PMC12539629/]
- 7. Comparison of current methods for genome-wide DNA ... [https://pmc.ncbi.nlm.nih.gov/articles/PMC12376410/]
- 8. WGBS vs. EM-seq: Key Differences in Principles, Pros ... [https://www.cd-genomics.com/resource-em-seq-wgbs-comparison-workflow-applications.html]
- 9. Evaluation of the HumanMethylationEPIC v2.0 Bead Chip ... [https://pmc.ncbi.nlm.nih.gov/articles/PMC12369268/]
- 10. Comprehensive evaluation of the Infinium human ... [https://epicom.biomedcentral.com/articles/10.1186/s43682-023-00021-5]
- 11. Comparing methylation levels assayed in GC-rich regions ... [https://pmc.ncbi.nlm.nih.gov/articles/PMC11289974/]
- 12. Comprehensive Guide to DNA Methylation Arrays in ... [https://www.cd-genomics.com/resource-comprehensive-guide-dna-methylation-arrays-epigenetic-research.html]
- 13. DNA methylation data by sequencing - Clinical Epigenetics [https://clinicalepigeneticsjournal.biomedcentral.com/articles/10.1186/s13148-019-0795-x]
- 14. Enzymatic methyl sequencing detects DNA methylation at ... [https://pmc.ncbi.nlm.nih.gov/articles/PMC8256858/]
- 15. Overview of EM-seq: A New Detection Approach for DNA ... [https://www.cd-genomics.com/epigenetics/resource-dna-methylation-detection-em-seq.html]
- 16. MethylC-analyzer: a comprehensive downstream pipeline for ... [https://as-botanicalstudies.springeropen.com/articles/10.1186/s40529-022-00366-5]
- 17. Quality assessment of enzymatic methyl-seq library ... [https://www.sciencedirect.com/science/article/pii/S0006291X24000238]
- 18. Critical evaluation of the Illumina MethylationEPIC BeadChip ... [https://genomebiology.biomedcentral.com/articles/10.1186/s13059-016-1066-1]
- 19. How to Choose the Right Methylation Array for Your ... [https://www.cd-genomics.com/resource-choose-right-methylation-array-illumina-affymetrix.html]
- 20. Genome-wide DNA methylation profiling in human breast ... [https://pmc.ncbi.nlm.nih.gov/articles/PMC8216193/]
- 21. EM-seq Service [https://www.cd-genomics.com/em-seq-service.html]
- 22. The performance of whole genome bisulfite sequencing on ... [https://www.sciencedirect.com/science/article/pii/S2405844023037787]
- 23. Methylation reference datasets from quartet DNA materials ... [https://www.nature.com/articles/s41467-025-64250-z]
- 24. Validation of the new EPIC DNA methylation microarray (900K ... [https://pmc.ncbi.nlm.nih.gov/articles/PMC9988339/]
- 25. Characterisation and reproducibility of the ... - BMC Genomics [https://bmcgenomics.biomedcentral.com/articles/10.1186/s12864-024-10027-5]
- 26. Comparison of Methods for DNA Methylation Analysis [https://www.neb.com/en-us/tools-and-resources/selection-charts/dna-methylation-table?srsltid=AfmBOoquJlNPlVC7Z90446-xa_xDES58aODFzypnJmwx4FqCQ80GhIWA]
- 27. Comparison of methylation capture sequencing and ... [https://pmc.ncbi.nlm.nih.gov/articles/PMC7684759/]
- 28. Microarray-Based DNA Methylation Profiling: Validation ... [https://www.sciencedirect.com/science/article/pii/S1525157824000345]
- 29. The new NEBNext Enzymatic Methyl-seq ( EM - seq ) - New England... [https://www.neb-online.de/en/next-generation-sequencing/the-new-nebnext-enzymatic-methyl-seq-em-seq/]
- 30. of Comparison Capture Sequencing and Infinium Methylation ... EPIC [https://www.researchsquare.com/article/rs-33940/v2]
- 31. Library Prep Kits for Sequencing Low - Input and Degraded ... FFPE [https://blog.genohub.com/2025/01/31/low-input-and-degraded-ffpe-samples-in-ngs-choosing-the-right-library-prep-kit/]
- 32. Analysis and performance assessment of the whole ... [https://pmc.ncbi.nlm.nih.gov/articles/PMC8963483/]
- 33. WGBS Data Analysis: Workflow and Performance ... [https://www.cd-genomics.com/epigenetics/resource-wgbs-dna-analysis-workflow-software.html]
- 34. Harvesting improved methylome sequencing accuracy [https://www.neb.com/en-ca/nebinspired-blog/harvesting-improved-methylome-sequencing-accuracy?srsltid=AfmBOoqK3vaI5AyHj-eLid-_M7Voy7w1Qi6FA7xlZIa20gsjaZzSvh2M]
- 35. Comparison of EM-seq and PBAT methylome library methods ... [https://pmc.ncbi.nlm.nih.gov/articles/PMC9542412/]
- 36. Cost-effective solutions for high-throughput enzymatic DNA ... [https://journals.plos.org/plosgenetics/article?id=10.1371/journal.pgen.1011667]
- 37. Discovery of novel DNA methylation biomarker panels for ... [https://www.nature.com/articles/s41598-024-53754-1]
- 38. Infinium MethylationEPIC v2.0 Kit | Methylation profiling array [https://www.illumina.com/products/by-type/microarray-kits/infinium-methylation-epic.html]
- 39. A multicenter prospective clinical trial reveals cell-free DNA ... [https://www.jci.org/articles/view/186816]
- 40. Choosing the Appropriate DNA Methylation Sequencing ... [https://www.cd-genomics.com/resource-how-choose-dna-methylation-sequencing-technology.html]
- 41. Comprehensive comparison of enzymatic and bisulfite DNA ... [https://clinicalepigeneticsjournal.biomedcentral.com/articles/10.1186/s13148-025-01959-0]
- 42. Benchmark of the Oxford Nanopore, EM-seq, and ... [https://www.frontiersin.org/journals/epigenetics-and-epigenomics/articles/10.3389/freae.2024.1362926/full]
- 43. Bisulfite Conversion Kits [https://www.zymoresearch.com/pages/bisulfite-conversion-kits?srsltid=AfmBOorjeK_EggjjKhyOb2cfV2npAaJuPQn38gpTT2PoDidbU_A8q6Ja]
- 44. Comparison of methylation capture sequencing and Infinium ... [https://epigeneticsandchromatin.biomedcentral.com/articles/10.1186/s13072-020-00372-6]
- 45. Bisulfite Sequencing (BS-Seq)/WGBS [https://www.illumina.com/techniques/sequencing/methylation-sequencing/bisulfite-sequencing.html]
- 46. Whole Genome Methylation Sequencing via Enzymatic ... [https://pubmed.ncbi.nlm.nih.gov/39546198/]
- 47. Bisulfite sequencing, but at what cost? [https://www.neb.com/en-us/nebinspired-blog/bisulfite-sequencing-but-at-what-cost?srsltid=AfmBOooQNQB_nlmGA5G9_CqIc_fc-PvxE1YmQ9amfp00fJKBcYo8Ly_u]
- 48. Comparison of DNA methylation measurements from EPIC ... [https://pmc.ncbi.nlm.nih.gov/articles/PMC9665150/]
- 49. Systematic evaluation of library preparation methods and ... [https://www.nature.com/articles/s41598-019-46875-5]
- 50. EM-seq Troubleshooting Guide [https://www.neb.com/en-ca/tools-and-resources/troubleshooting-guides/em-seq-troubleshooting-guide?srsltid=AfmBOopnQ9pYelXGZxHZGcmilq12xAPM4Ih87PMB86AgQf9Bm31KGzt1]
- 51. DNA methylation and machine learning - PubMed Central - NIH [https://pmc.ncbi.nlm.nih.gov/articles/PMC12512482/]
- 52. Advancements in DNA methylation technologies and their ... [https://pmc.ncbi.nlm.nih.gov/articles/PMC12309559/]
- 53. crossNN is an explainable framework for cross-platform ... [https://www.nature.com/articles/s43018-025-00976-5]
- 54. A DNA Methylation Classification Model Predicts Organ ... [https://arxiv.org/html/2506.00146v1]
- 55. the power of methylation-based cfDNA detection of tissue ... [https://pmc.ncbi.nlm.nih.gov/articles/PMC10588141/]
- 56. A Comprehensive Guide to DNA Methylation Sequencing ... [https://www.epicypher.com/resources/blog/a-comprehensive-guide-to-dna-methylation-sequencing-methods/]
- 57. Scalable screening of ternary-code DNA methylation ... [https://www.sciencedirect.com/science/article/pii/S2666979X25001855]
- 58. Benchmarking DNA methylation analysis of 14 alignment ... [https://www.sciencedirect.com/science/article/pii/S2001037022003853]
- 59. Benchmarking of methods for DNA methylome deconvolution [https://www.nature.com/articles/s41467-024-48466-z]
- 60. Enzymatic Methyl-seq: The Next Generation of Methylome ... [https://www.neb.com/en-us/tools-and-resources/feature-articles/enzymatic-methyl-seq-the-next-generation-of-methylome-analysis?srsltid=AfmBOorPVYV3m4NfmjovjGkU3SoZGor_gQYuTCwMduMMv6RlYki3ZoU3]
- 61. EM-seq: Principles, Workflow, Applications, and Challenges [https://www.cd-genomics.com/resource-em-seq-principle-workflow-application-challenge.html]
- 62. Evaluation of whole-genome DNA methylation sequencing ... [https://pmc.ncbi.nlm.nih.gov/articles/PMC8214260/]
- 63. xGen Methyl-Sequencing DNA Library Prep Kit and Adaptase [https://www.idtdna.com/pages/products/next-generation-sequencing/workflow/xgen-ngs-library-preparation/methyl-seq-dna-library-kit]
- 64. Ultra-mild bisulfite outperforms existing methods for 5- ... [https://pmc.ncbi.nlm.nih.gov/articles/PMC12615686/]
- 65. Methylation Sequencing | NGS advantages [https://www.illumina.com/techniques/sequencing/methylation-sequencing.html]
- 66. Comparison of DNA methylation based classification ... [https://www.nature.com/articles/s41698-024-00718-3]
- 67. Comparison of WGBS, EPIC array, EM-seq, and Nanopore ... [https://ega-archive.org/studies/EGAS00001008014]
- 68. Comparison of current methods for genome-wide DNA ... [https://pubmed.ncbi.nlm.nih.gov/40855329/]
- 69. Performance comparisons of methylation and structural ... [https://pmc.ncbi.nlm.nih.gov/articles/PMC10072131/]